Rabiatu A. Saleh![]() | Adekunle A. Adeleke
| Adekunle A. Adeleke![]() | Abdullahi S.B. Gimba
| Abdullahi S.B. Gimba![]() | Peter P. Ikubanni
| Peter P. Ikubanni![]() | Chizoma Adewumi
| Chizoma Adewumi![]() | Hauwa Rasheed
| Hauwa Rasheed![]() | Emmanuel O. Omotosho*
| Emmanuel O. Omotosho*![]()
© 2025 The authors. This article is published by IIETA and is licensed under the CC BY 4.0 license (http://creativecommons.org/licenses/by/4.0/).
OPEN ACCESS
Studies show lack of information about the detailed characterization of coal (Maiganga coal). This study aims to characterize Maiganga coal fly ash, the proximate, Ultimate, and calorific values were carried out on the studied coal sample following the American standards for Testing and Materials (ASTM) standards. Coal was decarbonized at different temperatures (900℃, 1000℃, 1100℃, 1200℃), further characterization was carried out using the following analytical technique, Fourier transform infrared (FTIR) revealed the presence of characteristic vibrational modes suggesting the presence of oxides, silicate and sulfate, X-ray diffraction (XRD) revealed the presence of various crystalline phases, including quartz, illite, calcite, microcline and chlorite, X-ray fluorescence (XRF) for elemental composition, Scanning Electron Microscopy (SEM) was used to investigate the morphology of the fly ash particles, analysis of the resulting image data shows particle size distribution, and how this varies throughout the sample, and Inductively Couple Plasma atomic emission Spectroscopy (ICP OES) confirmed the presence of trace metals and identified their relative concentrations, helping to determine the potential risks and benefits of using coal fly ash. Maiganga coal revealed reasonable concentration of Cesium which is an alkali metal but also a rare metal, other rare metals include lithium, rubidium, cobalt, gold, platinum, osmium, and iridium, the study also revealed the presence of 16 rare earth elements except for Promethium.
Maiganga coal, rare metals, cesium, decarbonization
Coal will continue to be a significant energy source for many years; yet, its spontaneous combustion poses the greatest safety risk linked to coal mining [1]. It remains an important energy resource globally, and it is still the main source of energy for heating, industry, and power production in many African nations. Despite the growing focus on renewable energy transitions in global discourse, it is important to have a comprehensive understanding of coal’s features, safety problems, and regional ramifications due to its long history and continued relevance in Africa [2]. Coal is widely distributed globally, with applications that vary from basic combustion for heat to complex partial oxidation processes for generating heat, gaseous or liquid fuels, and chemical feedstock [3]. The coal Industry is a fundamental component of the global energy sector, supplying ample and extensively spread fossil energy supplies for electricity generation. Coal primarily consists of a complex three-dimensional structure formed by fused aromatic moieties and is often categorized as lignite, bituminous coal, and anthracite. At present, bituminous coal is extensively utilized in coking, electricity generation, coal gasification, as a fuel, and in fuel cells due to its efficient burning, little ash and moisture content, and elevated calorific value [4]. Coal serves as a principal fuel source for energy and steam production in coal-fired power plants globally. Coal currently accounts for around 30% of primary energy and 41% of global electricity generation. Coal consumption is anticipated to exceed 50% by 2030, with developing countries responsible for 97% of the growth, mostly to satisfy enhanced electrification rates [5]. In the past decade, significant advancements have occurred globally in the coal-fired power production sector, impacting coal fly ash [6]. It is estimated that the world possesses around 850 megatons of identified coal reserves, sufficient to sustain current production levels for almost 130 years. Coal resources are present in nearly every country worldwide, with over 70 nations possessing recoverable reserves [7]. The extensive distribution of coal is thoroughly recorded, with deposits mostly located in North America, Russia, China, and Australia [8]. Bituminous coal, which has a high calorific value and relatively few impurities, is the most popular type of coal used in industrial and power generating applications worldwide. The other three main types of coal are lignite, sub-bituminous, and anthracite [9]. Coal is a productive fuel source due to its intricate structure, which includes carbon-rich matrix and fused aromatic rings [10]. South Africa, Mozambique, Botswana, and Zimbabwe make up the majority of Africa’s 300 gigatonnes of coal deposits, which account for more than 6% of the world’s total [11]. With coal making up around 85% of its energy mix, South Africa is a significant exporter and occupies more than 70% of the coal deposits on the continent [12, 13]. When it comes to domestic power generation and industrial operations, many African nations are still strongly dependent on coal, despite the worldwide trend towards decarbonization. In South Africa, for instance, almost 80% of the country's power comes from several coal-fired power facilities run by enterprise Eskom [14]. Likewise, Mozambique’s coal industry is seeing swift expansion, with the establishment of new mines and port infrastructure intended to transform the nation into an energy export center [11]. The demand for coal in Africa increased at a rate of 3.2% per year from 2010 to 2019, and it is projected to continue growing unless policy interventions are made. Even though Kenya and Ethiopia are putting a lot of money into renewable energy, a lot of African nations still use coal. South Africa is the 14th biggest CO₂ emitter in the world, and it gets a lot of its power from coal [15]. Coal extraction and storage in Africa pose considerable safety and environmental hazards. One of the most prevalent dangers that can occur in inadequately managed coal stockpiles and open-pit mines is spontaneous combustion, which can result in flames that are difficult to put out and that release hazardous gasses and particulate matter [16]. Despite worldwide consensus to reduce reliance on coal, Africa's unique developmental position makes the transition from non-renewable to renewable energy sources more challenging. According to Sachs et al. [17], a lot of African countries see coal as something of a "necessary evil" as it brings inexpensive and dependable electricity that is essential for their economies to flourish. This dependence exacerbates climatic vulnerabilities, particularly given Africa’s unequal susceptibility to climate change effects, including droughts and floods. Coal will continue to play a role in Africa’s energy mix for the foreseeable future, due to the continent’s present economic and infrastructure conditions. Renewable energy has enormous untapped potential in Africa. However, the continent is facing challenges in making the switch due to a lack of funding, unclear policies, and outdated infrastructure [18]. Although clean coal technologies like carbon capture and storage (CCS) have the potential to reduce emissions, they are still prohibitively expensive and have not been extensively applied on a large scale in Africa. The environmental dangers associated with coal mining and the risks of spontaneous combustion cannot be completely addressed by preservation efforts [19]. The combustion of coal results in the thermal transformation of its mineral constituents, yielding amorphous inorganic oxides. The extensive utilization of coal in power production generates significant amounts of coal combustion byproducts, leading to the establishment of substantial "hard won" end-use markets [7]. The current and anticipated end-use markets for coal byproducts are essential not only for the economics of power generation but also for the established supply chain stakeholders who have invested in, researched, developed, and advocated for coal ash in various end-use markets, particularly in the construction sector, which utilizes substantial quantities. The global increase in coal ash usage is influenced by several factors outside its quality and characteristics [20]. Proper legislation and regulation, together with the implementation of international classification systems, standards, and codes of conduct, are essential facilitators for enhancing adoption and ensuring "legal certainty" for ongoing investment [7]. Nigeria is expected to possess more than 4 billion metric tons of coal. The effective exploration of coal has resulted in the identification of extensive coal reserves in 14 of the 36 states in the nation [21].
Maiganga is situated inside the Gombe sandstone, close to and overlying the Pindiga Formation. The Pindiga Formation was deposited in marine settings, whereas the Gombe sandstone was formed in non-marine, perhaps delta plain environments [21-27]. This indicates that Nigeria possesses substantial coal seams; nevertheless, the natural coal resources are not completely used or optimized. This served as the impetus for the examination and assessment of coal characterization for power generating and industrial applications. The established advantages of coal ash utilization are extensively recorded in technical literature across several nations within the construction materials sector, highlighting the necessity to conserve natural resources, reduce energy emissions, and optimize storage space. When effective collection and management systems are implemented in modern coal-fired power plants, coal ash possesses considerable supply chain potential, prompting the investigation of Maiganga coal to identify its valuable constituents and the requisite concentration for extraction. Characterizing Maiganga coal can yield supplementary data for coal characterization. Numerous researchers have examined distinct coal deposits in Nigeria utilizing diverse analytical and spectroscopic techniques, including X-ray diffraction, Raman spectroscopy, and Fourier transform infrared spectroscopy. Nonetheless, there is an absence of comprehensive characterization data on Maiganga coal that elucidates its microstructural features, elemental concentrations, mineral composition, phases, and functional groups utilizing XRF, XRD, FTIR, SEM, and ICP OES analytical techniques. By analyzing or characterizing the examined sample, its processing and application may be enhanced, hence enhancing the quality metrics of coal for consumption. This study highlights the potential of Maiganga coal for rare metal recovery in Nigeria, particularly its significant cesium enrichment levels relative to worldwide coal resources. Nigerian coal is an untapped potential supply of valuable rare metals, as it is one of the few coal deposits on Earth with such high cesium concentrations. A review by Dodbiba and Fujita [28] highlights the rarity of high cesium concentrations in most coals and explores the distribution of rare metals, including cesium, in coal reserves across the world. The commercial utilization of coal would undoubtedly enhance the national economy, particularly that of the state. The research findings will also offer direction for the extraction of essential components, rare earth elements, and rare metals present and systematically identify and characterize rare metals present in the Maiganga coal deposit Gombe Nigeria.
2.1 Materials and methods
2.1.1 Study area
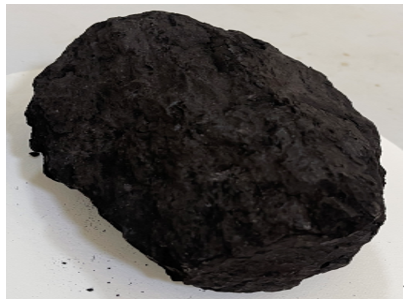
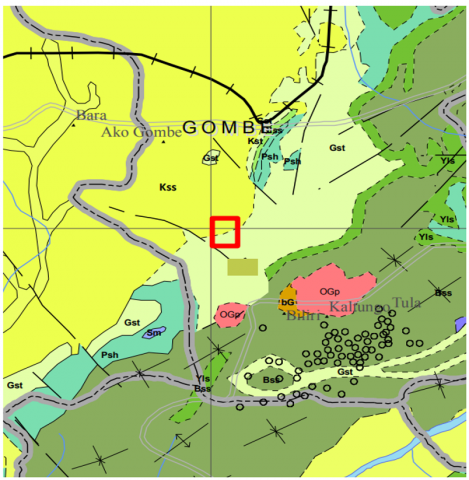
The research area includes the Maiganga coal mine, situated at a latitude of 09°59'19.20" and a longitude of 110°06'50.0" in Gombe State, northeast Nigeria. The materials were preserved in suitably labeled airtight containers to maintain their original conditions. 25 kilogram of new coal outcrops were obtained from the Garin Maiganga coal resource in Gombe State, Nigeria. Figure 1 shows an image of the studied coal sample. The samples were promptly kept in plastic bags to reduce contamination and oxidation. Figure 2 illustrates the geological map of Maiganga.
Figure 1. Maiganga coal sample
Figure 2. Geological map of the Gombe region showing the general location of the area [29]
2.1.2 Sample preparation
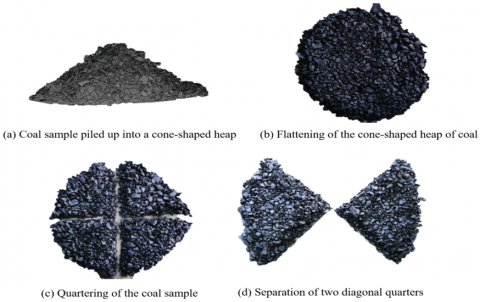
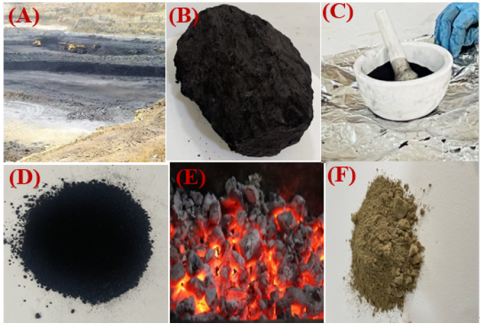
The coal sample obtained was diminished to a laboratory sample size for characterization. The coal sample was ground into fine powder in the Chemistry Laboratory of Nile University in Abuja, Nigeria. The coal sample was pulverized and sieved to 12.5 nm for total moisture assessment and 212 microns for testing and analysis. Samples are prepared using the coning and quartering technique to guarantee that they are representative of the whole batch (Figure 3). Divide the sample into smaller, equal parts after completely mixing it; this helps achieve homogeneity and reduces sampling bias. This technique reduces the impact of heterogeneity in the coal, including irregular mineral distribution, moisture content, and particle size variation, thereby offering a more precise foundation for further laboratory tests and testing [30]. Precautions were used to eliminate the necessity for further sifting and crushing during the testing phase. The combustion of raw coal was conducted in the Umaru Musa Yaradua University laboratory in Katsina State, Nigeria. The combustion products of the coal sample were acquired by incinerating at 900℃, 1000℃, 1100℃, and 1200℃, with specific time durations for each temperature as detailed in Table 1. The resultant ash samples were extracted from the furnace and allowed to cool in a desiccator. Upon cooling, the coal ash samples were gathered for subsequent examination (Figure 4). The elemental composition of the ash samples was examined using X-ray fluorescence (XRF) and Inductively Coupled Plasma Atomic Emission Spectrometry (ICP OES). A 10-gram sample of decarbonized coal and a 10-gram sample of pulverized coal were placed in a zip lock bag for examination. Both pulverized and decarbonized coal samples were examined at All School Lab, Ogun State [30]. The visual appearance of the coal samples after decarbonization at different temperatures is shown in Figure 5, demonstrating the progressive changes in ash characteristics with increasing temperature.
Figure 3. Coning and quartering of pulverized coal [30]
Figure 4. Image of Maiganga coal decarbonize to fly ash
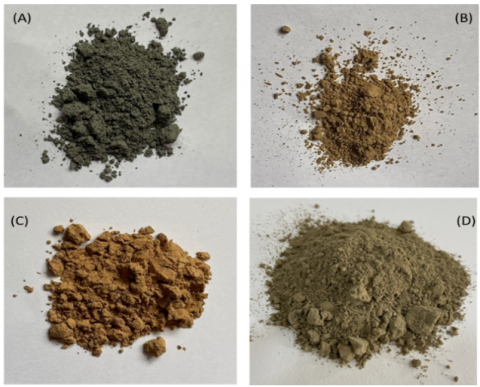
Figure 5. Plates 1A - D: Showing Burnt coal samples at different temperatures of (A) 900℃ (B) 1000℃ (C) 1100℃ and (D) 1200℃
Table 1. Analytical conditions for decarbonization
|
S/N |
Temperature (℃) |
Time (min) |
|
1. |
900℃ |
120 |
|
2. |
1000℃ |
270 |
|
3. |
1100℃ |
360 |
|
4. |
1200℃ |
480 |
2.2 Proximate, ultimate, and calorific value analysis
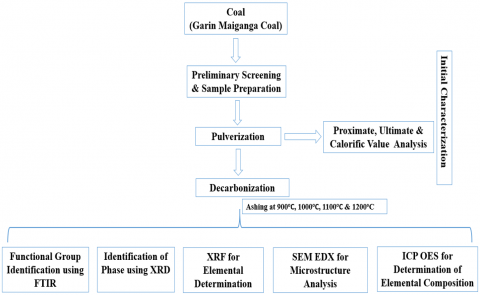
Figure 6 provides an overview of the comprehensive methodology employed in this study, illustrating the sequential analytical approach from sample preparation through characterization.
Figure 6. Overview of the methodology used in this study
The proximate analyses are regarded as essential assessments performed on coal samples. this analysis is carried out to check the quality of coal. Complementary analyses encompass moisture content, volatile matter, fixed carbon, and ash content. Proximate analysis differs from other tests that yield information on the elemental makeup of materials [31].
2.2.1 Moisture content (MC) of samples
Moisture is physically bound to coal in multiple forms, and its content directly affects proximate analyses. Additionally, moisture in coal displaces combustible matter (fixed carbon and volatile matter), thereby reducing the heat content per kilogram of coal due to vaporization [32]. The ASTM standard was utilized to ascertain the moisture content of pulverized coal. One gram was measured, transferred to a ceramic crucible, and subjected to an oven temperature of 105℃ for two hours under a nitrogen purge. The sample was weighed subsequent to chilling. Eq. (1) was used to determine the moisture content derived from the mass loss during the heating of the air-dried samples.
$\% M C=\frac{W-W_1}{W} \times 100$ (1)
where, w = weight of pulverized coal;
W₁ = weight of pulverized coal at 105℃ for 1hr.
2.2.2 Volatile matter
Volatile matter, a flammable component of coal that vaporizes when heated under certain conditions [33], may be determined by exposing oven-dried samples to heat under a nitrogen (N2) purge at a temperature of 850℃. The ASTM (E872-82, 2013) standard was utilized to ascertain the volatile matter (VM). The samples were housed in crucibles with ceramic covers and positioned within a stainless steel box located within a muffle furnace. Temperature readings within the stainless steel enclosure were documented at one-minute intervals during the heating procedure. Upon reaching the specified separation temperature of 850℃, the furnace was deactivated. The VM was assessed utilizing (Eq. (2)).
$\% \text{VM}=\frac{\text{A-B}}{\text{B}} \times 100$ (2)
where, VM = volatile matter of the sample;
A and B = Samples initial and final weight, respectively.
2.2.3 Ash content (AC)
Ash content consists of minerals and other inorganic ingredients that are predominantly incombustible materials remaining after the combustion of coal. The ash content of Maiganga coal was assessed by heating the sample to 730℃ in an air environment using a muffle furnace. The furnace was heated to 730 degrees and maintained at that temperature for 6 hours. Following ashing, the furnace was turned off and let to cool for one hour before the samples were moved to a desiccator for further cooling. The crucibles were weighed, and the ash quantity was calculated by subtracting the weight of the empty crucible. The ash content was assessed utilizing Eq. (3).
$\% A C=\frac{W_2-W_1}{W S} \times 100$ (3)
where, AC is the ash content of the sample, W₁ and W₂ represent the weight of the empty crucible and crucible with the ash, respectively and WS is the weight of the sample.
2.2.4 Percentage fixed carbon (PFC)
Fixed carbon represents the residual combustible solid minerals following the devolatilization of volatile matter and moisture from coal; it serves as an indirect indicator of the carbon content in the coal sample [34]. The proportion of fixed carbon was determined by subtracting the sum of the percentage of volatile matter and the percentage of ash content from 100. The carbon content is often calculated as a "difference," whereby all other elements are subtracted from 100 using (Eq. (4)) as percentages, with the residual supposed to represent the proportion of fixed carbon.
$\% F C=100-(\% V M+\% A C+\% M C)$ (4)
2.2.5 Ultimate analysis
Carbon, hydrogen, nitrogen, and sulfur were quantified using an automatic non-dispersive analyzer, whereas oxygen was calculated by difference. 1 gram of coal sample had been collected for thorough testing. Analysis was conducted with an LECO CHN628 Analyzer (Model No: 622-000-000, SN-12357) [35], in accordance with the ASTM D5373-16 standard. A 2-gram representative sample was deposited in a crucible for examination, and the sulfur content was quantified using an LECO S-144DR Sulfur analyzer (Model No: 606-0000-300, SN-477), following the ASTM D4239-11 standard. As oxygen is calculated by subtracting the total percentage of other elements from 100%, errors in the measurement of other elemental constituents are consistently reflected in the predicted oxygen value. The study utilized Eq. (5) to calculate the oxygen concentration.
$\% 0=100-(\% C+\% H+\% N+\% S+a s h)$ (5)
2.2.6 Heating value HHV (Calorific value)
The amount of heat produced from the combustion of coal under defined conditions. It may be further reduced as the thermal or energy content of coal utilized in thermal power plants. Coal is traded internationally according to its calorific value, which is often inversely related to its ash level [36]. The higher heating value (HHV) of the coal ash was ascertained utilizing the Bomb Calorimeter (Model 6100, Parr Instrument Co., Moline, Illinois). The bomb calorimeter was calibrated by combusting a specified mass, m, of standard benzoic acid, which had a recognized heat of combustion of 26.453 kJ/g. The gross heat of combustion was determined using an oxygen bomb calorimeter using the standard approach ASTM D2382-88 [37].
2.3 Scanning electron microscopy
Four coal ash decarbonized at different temperatures were selected for Morphological analysis, the analysis was performed with the Phenom Prox model from PhenomWorld in Eindhoven, the samples were carbon coated to improve conductivity of samples. Block pellets were used for the SEM analysis. The analysis of the SEM images yielded significant insights into the elemental distribution inside the samples. Prior research employing SEM on coal has been crucial in clarifying the spatial distribution and presence of diverse constituents, enhancing comprehension of the coal's composition and characteristics.
2.4 Fourier transform infrared (FTIR) spectroscopy
The Shimadzu Fourier transform infrared spectrophotometer (FTIR) 8400 S was employed for the determination of the functional unit. Samples were weighed at 0.01 g and homogenized with 0.01 g of anhydrous KBr using an agate mortar [38]. The mixtures were compressed using a vacuum hydraulic press (Graseby Specac) at 1.2 psi to produce a transparent pellet. The scanned sample was analyzed using infrared spectroscopy, where its continuous wave was detected and transmitted to a computer, which provided a description of the sample's spectrum. Samples were analyzed in the absorbance range of 600 to 4000 cm-1 [39]. The analysis findings comprised the chemical structure, molecular binding form, and specific functional groups of the examined substances as the basis for the spectrum type.
2.5 X-ray fluorescence
This examination utilized a non-destructive investigation approach to ascertain the elemental composition of significant mineral oxides in the coal samples. The unique benefits of this non-destructive method are directly associated with its capacity to precisely measure the concentration of each element in the sample without inducing any changes or harm. The Nitron 3000 instrument was utilized. The Cu-Zn approach was chosen for this research because of its capacity to detect a broad spectrum of elements, owing to its high intensity [40]. This standardized approach was uniformly used across all samples to determine the proportion of chemical composition in both oxide and elemental forms. Data was obtained in triplicate, and the mean was determined automatically. Calculations for slagging indices were conducted using Eqs. (6)-(8) based on this data.
$\mathrm{S} / \mathrm{A}=\frac{\% \mathrm{SiO} 2}{\% \mathrm{Al} 2 \mathrm{O} 3}$ (6)
$\mathrm{I} / \mathrm{C}=\frac{\% \mathrm{FeO} 3}{\% \mathrm{CaO}}$ (7)
$\mathrm{S}=\frac{\% \mathrm{SiO} 2}{\% \mathrm{SiO} 2+\mathrm{Fe} 2 \mathrm{O} 3+\mathrm{CaO}+\mathrm{MgO}}$ (8)
where, S/A is the silica /alumina ratio. I/C is the iron/calcium ratio, and S is the slagging viscosity index.
2.6 X-ray diffraction
The X-ray diffraction (XRD) Empyrean Malvern Panalytical diffractometer was activated, with the voltage and current configured to 45 kV and 40 mA, respectively. The temperature was established at 2123℃ [41]. The computer system was activated, and the X-ray diffraction (XRD) program, TUMI, was executed by double-clicking. The settings dialogue was accessed, and the necessary power and temperature configurations were verified to align with those of the XRD [42]. The acquired result was further compared with other databases, including NIST and PubChem, to ascertain the chemical structure, nomenclature, and additional physicochemical parameters [43].
2.7 Inductively Coupled Plasma Atomic Emission Spectrometry (ICP OES)
The elemental composition was determined by inductively coupled plasma optical emission spectroscopy. Digestion is necessary in coal to extract elements in their inorganic form utilizing reagents and microwave technology. The solvent extraction procedure was performed utilizing a Soxhlet extractor with commercial ethanol at temperatures of 50, 60, and 70℃ for durations of 2, 3, and 4 hours [44]. The interplay of temperature and time was established in an initial series of experiments. Coal ash was generated in triplicate utilizing the following process. The samples were digested by incorporating 6 ml of 20% hydrochloric acid (HCl) and 2 ml of 20% nitric acid (HNO3) into roughly 0.1 g of solid material. The mixture was subsequently cooked to 220℃ for 35 minutes utilizing a microwave digestion equipment. After cooling the samples, they were diluted to 25 ml with ultrapure deionized water, and calibration standards were prepared. The National Institute of Standards and Technology (NIST) prominent multi-element standard was incorporated into the suite of samples to function as a reference [45].
3.1 Proximate analysis, ultimate analysis and calorific value
The proximate analysis remained extensively accepted as foundation for classification in coal application, the coal quality of the Maiganga deposit was determined following the American standards as earlier highlighted. A summary of the main coal quality parameters of the Maiganga coal is shown in Table 2. The sample reported relatively 41.22% for the volatile matter, 17.93% for ash content, 27.93 MJ/kg for calorific value and 54.55% for fixed carbon content. It also reported low moisture content. The ash yield shows low average values for Maiganga coal. Maiganga coal was compared with other better known Nigerian coal deposits in Table 2. The result presented in this study highlighted that Maiganga coal as a high volatile subbituminous coal as a result of its high gross calorific value (GCV). Other coal includes Orukpa coal which is classified as subbituminous, characterized by low sulfur content, low ash, and a richness in humidity. Furthermore, Odagbo coal is also classified as subbituminous, characterized by medium sulfur content and low ash, abundant in humidity. Ezimo coal is categorized as subbituminous, with low sulfur and high ash content. Inyi coal is also subbituminous, exhibiting low sulfur and high ash, alongside bituminous coal. Amansiodo coal is classified as bituminous, with low sulfur and medium ash content. The ignition temperatures of the coal samples from Orukpa, Odagbo, Ezimo, and Inyi rise as the volatile matter content diminishes, while their calorific values exhibit a significant correlation with fixed carbon, elemental carbon, volatile matter, and hydrogen concentrations in descending order [46]. Maiganga coal will be good as fuel source in the production of activated carbon and metallurgical processes.
Carbon is the predominant element in coal, existing as organic carbon and in combined form within the complex organic compounds of coal [47]. Hydrogen existed in all forms inside coal [48]. Nitrogen is present in the organic matter of coal, originating from plant and animal proteins [49]. Sulphur is an essential ingredient in coal use because of its interaction with the boiler and the production of sulphur dioxide, its content increases with weathering, so sulphur serves as an indicator of the degree of weathering in coal [50]. Oxygen existed in both biological and inorganic forms. Throughout the years, no reliable method has been established to quantify oxygen [51].
Table 2. Proximate, ultimate and calorific analysis of some Nigerian coal
|
Sample ID |
MC (%) |
FC (%) |
VM (%) |
AC (%) |
CV (MJ/kg) |
C (%) |
H (%) |
N (%) |
S (%) |
O (%) |
Ref. |
|
MC |
6.3 |
54.55 |
41.22 |
17.93 |
27.93 |
76.11 |
4.28 |
1.4 |
0.91 |
17.30 |
Present study |
|
OKB |
5.99 |
58.13 |
32.56 |
3.32 |
32.93 |
82.80 |
4.30 |
2.40 |
0.60 |
7.30 |
[52] |
|
OYM |
6.10 |
56.90 |
23.00 |
14.00 |
21.25 |
64.30 |
- |
- |
0.93 |
- |
[52] |
|
EZM |
7.00 |
38.00 |
32.00 |
23.00 |
21.00 |
77.4 |
6.3 |
6.4 |
0.8 |
13.7 |
[52] |
|
AFZ |
1.97 |
21.24 |
45.80 |
30.99 |
30.52 |
72.46 |
6.07 |
1.63 |
1.41 |
18.43 |
[52] |
|
OBG |
6.93 |
54.33 |
30.41 |
8.63 |
32.51 |
78.90 |
4.10 |
1.20 |
0.60 |
6.60 |
[52] |
|
OGB |
14.9 |
41.1 |
38.7 |
5.3 |
22.60 |
62.16 |
5.87 |
1.37 |
1.07 |
9.43 |
[46] |
|
ORK |
11.5 |
46.1 |
39.1 |
3.3 |
26.51 |
67.82 |
5.88 |
1.43 |
0.60 |
9.47 |
[46] |
|
AMD |
5.4 |
47.9 |
38.1 |
8.6 |
27.48 |
66.95 |
5.62 |
1.58 |
0.92 |
10.93 |
[46] |
|
INY |
3.8 |
35.9 |
29.9 |
30.4 |
19.39 |
49.27 |
4.19 |
1.24 |
0.56 |
10.53 |
[46] |
|
*MC- Maiganga coal mines, OKB - Okaba coal mines, OYM- Onyeama coal mines, EZM- Enzimo coal mines, AFZ-Afuze coal mines OBG- Ogboyega coal mines, ODB-odagbo, OWK- orukpa, AMD-amasiodo, INY-inyi. |
|||||||||||
3.2 Fourier transform infrared spectroscopy
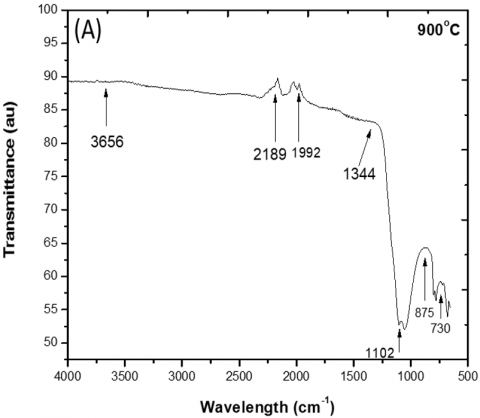
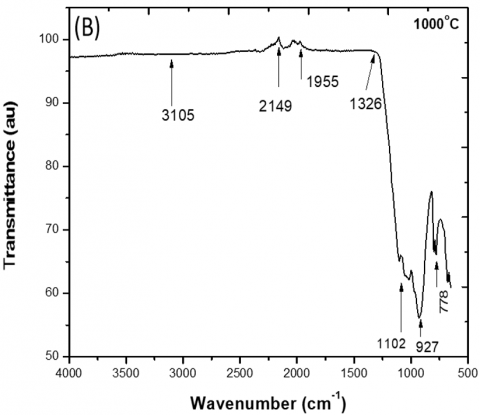
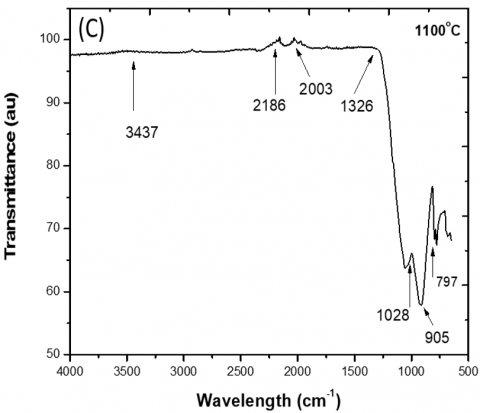
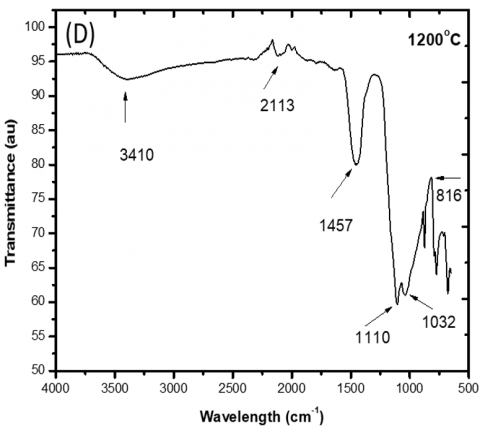
The FTIR spectra for the four coal ash samples are presented in Figure 7, and their corresponding band assignments are summarized in Table 3. The absorption bands at 3656 cm-1, 3105 cm-1, 3437 cm-1, and 3410 cm-1 for Kaolinite, Portlandite, Beryl, and Lepidolite correspond to hydroxyl (OH) stretches, suggesting the presence of hydrated materials, As the temperature rises from 900℃ to 1200℃, the location of the bands shifts somewhat, suggesting alterations in the structural environment or bonding interactions within these minerals due to water loss or modifications in the mineral matrix [53]. The aliphatic CH2 band groups at 2189 cm-1, 2149 cm-1, 2186 cm-1, and 2113 cm-1 indicate the existence of aliphatic hydrocarbons, the reduction in intensity at elevated temperatures may indicate thermal deterioration or the loss of organic components [54]. The bands at 1992 cm-1, 1955 cm-1, 2003 cm-1, and a notable decrease to 1457 cm-1 at 1200 °C indicate changes in the silica structure for Amorphous Silica and Quartz, the significant alteration suggests that the mineral structure is probably experiencing changes with rising temperatures, resulting in a more crystalline configuration or an amorphous transition [55]. The presence of Nitrate, Gypsum, and Anhydrites, with bands at 1344 cm-1 and consistent values at 1326 cm-1, suggests the existence of sulfate or nitrate groups, the reduction in intensity at elevated temperatures may indicate breakdown or the loss of these ions as a result of thermal processes [56]. The bands at around 1102 cm-1, along with consistent bands at 1028 cm-1 and 1032 cm-1, support the identification of Muscovite, Pollucite, and Metakaolinite, the little alterations suggest that certain minerals may exhibit greater stability at higher temperatures than some others mentioned [57]. The bands of Calcite and Kaolinite at 875 cm-1, 927 cm-1, and 907 cm-1, together with a decrease to 816 cm-1 at 1200℃, indicate the presence of carbonates, with calcite presumably being a significant component, a shift and reduction in these bands may signify the disintegration of the carbonate group, often occurring at elevated temperatures [58]. The variations highlight the impact of combustion conditions, with elevated temperatures resulting in significant spectrum changes, especially in the bands of calcite and metakaolinite [59]. studies frequently fail to provide a comprehensive mechanistic explanation of the behavior and distribution of cesium (Cs) inside coal matrix, despite the fact that this phenomenon has attracted scientific attention owing to its environmental and economic ramifications [60]. Research on Cs has mostly focused on its existence rather than identifying the minerals that served as hosts or the geochemical processes that led to their accumulation. The cesium-bearing mineral pollucite (CsAlSi₂O₆·nH₂O) is prominent in geological materials as a host for Cs due to its stability and high concentration. Instead of sedimentary conditions like coal. Coal deposits may include Cs in mineral phases that are similar to them or in minerals that formed during secondary mineralization [61]. In Maiganga coal, Cs frequently occurs in conjunction with minerals like pollucite, calcite, and other portlandite, where it can replace K⁺ in the lattice structure owing to comparable ionic radii. The presence of pollucite in coal beds is uncommon. There is evidence from certain investigations that Cs may be adsorbed onto organic matter or integrated into clay mineral formations, resulting in varying degrees of enrichment [60]. The presence of pollucite in cesium-rich mineral formations is indicative of unique mineralogical conditions that promote Cs mineralization. Pollucite, a main Cs mineral found in great concentration and purity in the Tanco pegmatite in Canada, is one example [61]. Research on coal ash and sediments has shown Cs concentrations varying from negligible amounts to several hundred mg/kg. These concentrations are often associated with clay mineralogy and organic linkages rather than isolated Cs minerals [60].
Figure 7. FTIR spectra of decarbonized coal ash from Maiganga
Table 3. FTIR band assignment of Maiganga coal
|
Band Assignment |
Ashing at 900℃ |
Ashing at 1000℃ |
Ashing at 1100℃ |
Ashing at 1200℃ |
|
Kaolinite, portlandite, beryl, lepidolite |
3656 |
3105 |
3437 |
3410 |
|
Aliphatic CH2 |
2189 |
2149 |
2186 |
2113 |
|
Amorphous Silica, Quartz |
1992 |
1955 |
2003 |
1457 |
|
Nitrate, Gypsum, Anhydrites |
1344 |
1326 |
1326 |
1110 |
|
Muscovite, pollucite, metakaolinite |
1102 |
1102 |
1028 |
1032 |
|
Calcite, kaolinite |
875 |
927 |
907 |
816 |
3.3 Scanning electron microscopy
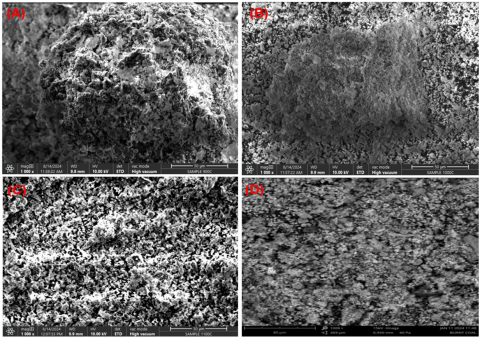
Figure 8 shows micrographs of the coal samples revealing the morphological characteristics and elemental composition of decarbonized coal ash from Maiganga. The elemental composition analysis presented in Table 4 highlights silicon, aluminum, iron, and magnesium as the predominant elements in the ash samples, reflecting the organic and mineral-rich nature of Maiganga coal. The result reflects the organic and mineral rich nature of Maiganga, Kaolinite and chlorite were identified along with glassy structures, amorphous aluminosilicate spheres and iron – rich smooth sphere, smaller ash spheres were physically combined with larger ones, suggesting heterogeneity in particle sizes and structures. The mineralogical and elemental composition suggests potential applications in heating, combustion, and gasification, as the presence of silica, aluminum, and calcium-rich particles likely kaolinite, calcite, and muscovite is evenly distributed across the coal structure [62]. Original ash particles are observed as spherical balls with smooth surfaces [63]. Elemental composition analysis highlights silicon, aluminum, iron, and magnesium as the predominant elements in the ash samples, reflecting the organic and mineral-rich nature of Maiganga coal. The analysis indicates that particle size distribution influences mineral abundance, with silicon and aluminum increasing with coarser particles. A notable finding is the abundance of cesium (97% affinity to silicates, 15.9 ppm), likely linked to the amorphous silica content [60]. Variations in elemental spectra suggest holes within the spherical particles, with mixed spheres showing varying levels of aluminum, silicon, and iron. The presence of cesium, kaolinite minerals, and pollucite-like structures, especially in coal ash samples processed at higher temperatures, reflects the diversity in mineral composition and morphology, which could influence coal’s reactivity during industrial processes. From the appearance of the spheres observed in this study and from three-dimensional images of similar mixed spheres in the literature it is clear that Maiganga coal contain reasonable amount of cesium due to the presence of amorphous silica which is a Kaolinite mineral and glassy structure, crystalline nature, and shiny appearance which describe the mineral pollucite, in all the sample.
Figure 8. SEM image of Maiganga coal ash at (A) 900℃, (B)1000℃, (C) 1100℃, (D) 1200℃
Table 4. Elemental composition of Maiganga coal
|
A |
B |
||||
|
Element |
Atomic Conc. (%) |
Weight Conc. (%) |
Element |
Atomic Conc. (%) |
Weight Conc. (%) |
|
Silicon |
13.56 |
50.00 |
Silicon |
18.61 |
47.80 |
|
Calcium |
8.96 |
16.46 |
Calcium |
13.22 |
23.80 |
|
Iron |
9.77 |
6.44 |
Iron |
10.04 |
6.48 |
|
Aluminium |
9.35 |
12.75 |
Aluminium |
8.56 |
11.44 |
|
Magnesium |
4.26 |
6.77 |
Magnesium |
12.32 |
13.82 |
|
Sulphur |
3.82 |
8.77 |
Sulphur |
2.52 |
5.68 |
|
Titanium |
1.69 |
2.60 |
Titanium |
1.56 |
2.37 |
|
Phosphorus |
1.36 |
0.52 |
Phosphorus |
1.68 |
0.88 |
|
Potassium |
0.61 |
0.57 |
Potassium |
0.36 |
0.32 |
|
Chlorine |
0.70 |
1.45 |
Chlorine |
0.59 |
1.22 |
|
Cesium |
0.34 |
0.001 |
Cesium |
0.03 |
0.01 |
|
C |
D |
||||
|
Element |
Atomic Conc. (%) |
Weight Conc. (%) |
Element |
Atomic Conc. (%) |
Weight Conc. (%) |
|
Silicon |
18.03 |
47.48 |
Silicon |
33.87 |
29.20 |
|
Calcium |
12.61 |
23.28 |
Calcium |
19.15 |
23.56 |
|
Iron |
11.73 |
7.77 |
Iron |
8.15 |
13.97 |
|
Aluminium |
10.20 |
13.98 |
Aluminium |
13.21 |
10.94 |
|
Magnesium |
13.47 |
10.32 |
Magnesium |
11.88 |
8.87 |
|
Sulphur |
0.73 |
1.69 |
Sulphur |
7.32 |
7.20 |
|
Titanium |
1.82 |
2.81 |
Titanium |
2.79 |
1.97 |
|
Phosphorus |
1.82 |
1.43 |
Phosphorus |
1.27 |
1.97 |
|
Potassium |
0.52 |
0.49 |
Potassium |
1.41 |
1.34 |
|
Chlorine |
0.63 |
1.31 |
Chlorine |
0.46 |
0.55 |
|
Cesium |
0.42 |
0.37 |
Cesium |
0.49 |
0.54 |
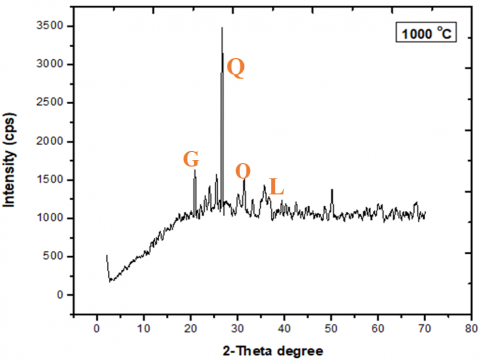
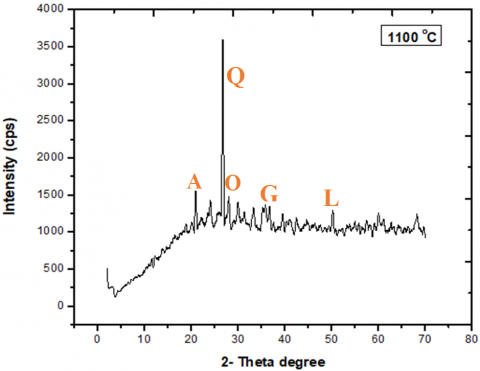
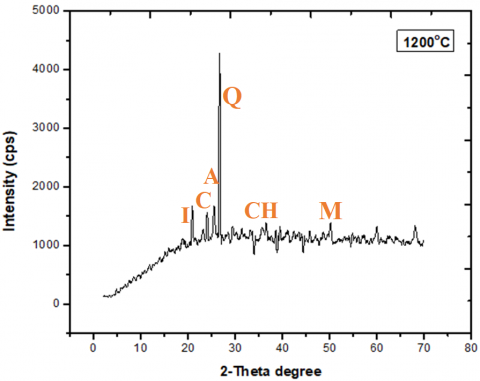
3.4 X-ray diffraction
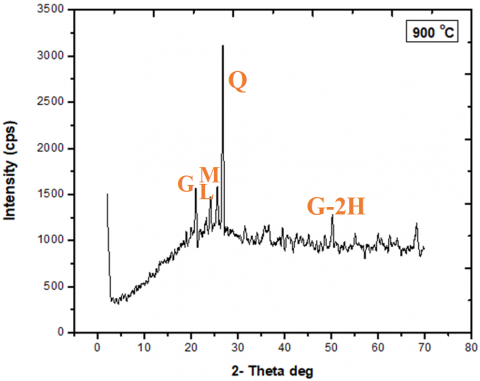
Figure 9 illustrates the XRD spectra of Maiganga coal ash, revealing the mineral composition across different temperatures. Quartz and illite are identified as the dominant minerals, with minor contributions from lime, microcline, muscovite, albite, goethite, orthoclase, calcite, chlorite, and graphite [64]. Muscovite is mostly derived from the source area, which mainly consists of granite and gneiss [65]. Quartz is observed as the predominant oxide mineral, with a marginally higher content due to the proximity of the coal deposit to the source region. Illite, often associated with quartz and kaolinite, is identified as a potential carrier mineral for rare metals such as cesium [66]. The analysis reveals temperature-specific mineral changes. At 900℃, the coal ash primarily contains quartz, lime, goethite, microcline, and graphite 2H. Graphite exists due to the residual presence of carbon, which remains unburned during the Decarbonization process that occurs at 900℃. At 1000℃, quartz, lime, goethite, and orthoclase are dominant, while at 1100℃, quartz, albite, orthoclase, lime, and goethite are the major components. At 1200℃, the ash predominantly comprises quartz, illite, and lime. These variations highlight the thermal stability and structural transformations of the coal's mineral content at elevated temperatures [67]. The coal ash is characterized by aluminosilicate components such as kaolinite, which is significant due to its thermal stability, radiation resistance, and high adsorption capacity. XRD patterns confirmed the presence of various crystalline and amorphous components, including rare metals and rare earth elements in the Maiganga coal [68]. The presence of kaolinite and its association with cesium suggest its potential for cesium extraction [69]. The findings provide a comprehensive understanding of the mineralogical and elemental composition of Maiganga coal, confirming its suitability for industrial applications such as coal beneficiation, material synthesis, and rare metal recovery.
Figure 9. XRD Spectra of Maiganga coal ash
3.5 X-ray fluorescence
Table 5 presents the concentrations (mg/cm³) of various mineral components in Maiganga coal decarbonized at temperatures between 900℃ to 1200℃. The findings highlight distinct temperature-dependent behaviors for different oxides and elements. The concentration of silicon dioxide (SiO₂) decreases slightly from 40.80 mg/cm³ at 900℃ to 38.57 mg/cm³ at 1100℃, then increases to 41.04 mg/cm³ at 1200℃. This suggests potential changes in chemical equilibrium or physical states such as condensation or evaporation. Vanadium oxide (V₂O₅) steadily decreases from 0.140 mg/cm³ at 900℃ to 0.041 mg/cm³ at 1200℃, likely due to volatilization. Chromium oxide (Cr₂O₃) concentrations increase slightly between 900℃ (0.043 mg/cm³) and 1100℃ (0.052 mg/cm³) but drop sharply to 0.011 mg/cm³ at 1200℃, indicating possible phase changes or reduction processes. Manganese oxide (MnO) remains relatively stable across 900℃ to 1100℃ but increases significantly at 1200℃ (0.565 mg/cm³), indicating its stability at higher temperatures. Iron oxide (Fe₂O₃) concentrations rise from 13.98 mg/cm³ at 900℃ to 16.78 mg/cm³ at 1100°C before decreasing to 7.62 mg/cm³ at 1200℃, suggesting reduction or phase transition at elevated temperatures. Calcium oxide (CaO) exhibits a notable increase from 12.53 mg/cm³ at 900℃ to 29.455 mg/cm³ at 1200℃, possibly due to the decomposition of calcium-containing compounds or increased mobility. Sulfur trioxide (SO₃) concentrations decrease significantly from 9.543 mg/cm³ at 900℃ to 1.826 mg/cm³ at 1100℃ but rise again to 10.624 mg/cm³ at 1200℃, reflecting sulfur-related reactions or phase changes. Other components such as NiO and CuO show decreasing concentrations with increasing temperature, which is likely due to volatilization. Aluminum oxide (Al₂O₃) demonstrates significant variations at higher temperatures, possibly due to changes in its crystalline structure or interactions with other components [70]. Cesium oxide (Cs₂O) concentrations increase significantly from 0.034 mg/cm³ at 900℃ to 1.059 mg/cm³ at 1100℃ but decrease to 0.561 mg/cm³ at 1200℃. This trend indicates that cesium oxide forms and accumulates at intermediate temperatures, but volatilizes at higher temperatures [71]. Overall, these results highlight the temperature-induced changes in the formation, reduction, and volatilization of mineral components in Maiganga coal, offering valuable insights for processes such as material synthesis and metal extraction.
The slagging indices presented in Table 6 provide critical insights into the coal ash behavior at different temperatures. Lower ratio (900℃) indicates a higher likelihood for slag formation since acidic components are dominating. This can lead to issues at lower temperatures due to a higher risk of creating solid clinker. Higher ratio (1200℃) indicates a balance or dominance of basic oxides, which may lead to less slag information, suggesting better handling at higher temperatures. The increases in the slagging index with temperature indicate an improved propensity for slag formation as the basic oxides (which are less likely to form slag) become a more significant portion of total oxides at higher temperature. Understanding these indices can help in adjusting operational parameters for different temperature conditions in industrial application.
Table 5. Weight compositions of oxides of elements in the sample of study
|
Component |
Conc. 900℃ mg/cm³ |
Conc. 1000℃ mg/cm³ |
Conc. 1100℃ mg/cm³ |
Conc. 1200℃ mg/cm³ |
|
SiO2 |
40.80 |
39.82 |
38.571 |
41.04 |
|
V2O5 |
0.140 |
0.120 |
0.152 |
0.041 |
|
Cr2O3 |
0.043 |
0.047 |
0.052 |
0.011 |
|
MnO |
0.475 |
0.458 |
0.541 |
0.565 |
|
Fe2O3 |
13.98 |
14.36 |
16.78 |
7.620 |
|
Co3O4 |
0.058 |
0.059 |
0.084 |
0.023 |
|
NiO |
0.024 |
0.020 |
0.020 |
0.013 |
|
CuO |
0.080 |
0.057 |
0.071 |
0.048 |
|
Nb2O3 |
0.020 |
0.016 |
0.022 |
0.062 |
|
MoO3 |
0.000 |
0.000 |
0.003 |
0.000 |
|
WO3 |
0.000 |
0.000 |
0.000 |
0.007 |
|
P2O5 |
0.000 |
0.000 |
0.000 |
0.000 |
|
SO3 |
9.543 |
6.305 |
1.826 |
10.624 |
|
CaO |
12.53 |
18.504 |
17.65 |
29.455 |
|
MgO |
0.000 |
0.000 |
0.000 |
0.000 |
|
K2O |
0.733 |
0.428 |
0.629 |
0.127 |
|
BaO |
0.160 |
0.207 |
0.340 |
0.149 |
|
Al2O3 |
17.67 |
16.17 |
19.281 |
6.793 |
|
Ta2O5 |
0.004 |
0.018 |
0.030 |
0.004 |
|
TiO2 |
2.830 |
2.630 |
3.041 |
2.224 |
|
ZnO |
0.046 |
0.048 |
0.095 |
0.009 |
|
Ag2O |
0.007 |
0.006 |
0.009 |
0.000 |
|
Cl |
0.700 |
0.598 |
0.628 |
1.087 |
|
ZrO2 |
0.107 |
0.095 |
0.117 |
0.093 |
|
SnO2 |
0.000 |
0.000 |
0.000 |
0.000 |
|
Cs2O |
0.034 |
0.981 |
1.059 |
0.561 |
Table 6. Slagging indices of the sample
|
Temperature |
900℃ |
1000℃ |
1100℃ |
1200℃ |
|
Silica -to-alumina ratio |
2.3 |
2.46 |
2.00 |
6.04 |
|
Iron -calcium ratio |
1.12 |
0.78 |
0.95 |
0.26 |
|
Slagging viscosity index |
60.61 |
54.78 |
52.84 |
52.54 |
3.6 Inductively couple plasma optical emission spectroscopy
Table 7 presents the results of the ICP-OES analysis, illustrating the concentrations of rare earth elements, rare metals, and other metals in Maiganga coal at varying temperatures. The table shows a complex interaction between temperature, concentration, and intensity. For most elements, temperature affects both the concentration and the measured intensity, though in different ways depending on the element's properties [72]. Higher values represent a greater concentration of the element in the sample. Elemental concentrations drop as temperature increases. The intensity values represent how strongly the element's emission or absorption lines are detected by the instrument, which is often related to the concentration of the element in the sample, higher intensity can correlate with a higher concentration, but other factors like instrument sensitivity and the physical properties of the elements may influence the results [73]. Elements like Bi, B, and Ti show variations in intensity at different temperatures that do not necessarily correlate directly with concentration, indicating that other factors like excitation efficiency, line strength, or detection capability at various temperatures could be influencing the observed intensities [74]. The concentrations of REEs tend to vary with temperature, but generally exhibit moderate concentrations, with some showing a clear increase or decrease depending on the temperature. Ce shows an increase in concentration from 0.041836 ppm at 900℃ to 0.060246 ppm at 1100℃, suggesting a trend where its concentration increases as temperature rises. Eu shows a low concentration range but increases slightly in intensity with temperature. It remains relatively low compared to other elements in the dataset. Er shows noticeable increases in concentration from 0.254031 ppm at 900℃ to 1.123682 ppm at 1100℃, reflecting a higher presence at higher temperatures. These values reflect the behavior of REEs in the matrix at various temperatures, and their concentrations can influence their role in various materials or processes like catalysis, metallurgy, or electronics [75]. REEs tend to have relatively low but variable concentrations depending on temperature, suggesting they may be more stable or have lower volatility compared to alkali metals [76]. Li shows a concentration range from 0.00064 ppm at 900℃ to 0.004994 ppm at 1100℃, indicating a low concentration that increases slightly with temperature. Na exhibits a significant concentration range, starting at 0.73157 ppm at 900℃ and increasing to 1.044267 ppm at 1100℃. Its intensity rises sharply with temperature as well, suggesting it has a significant role in the material system under study. Cesium shows a peak concentration at 1100℃ (413.607849 ppm), reflecting its significant presence at higher temperatures. metals like sodium, potassium, rubidium, and cesium generally show higher concentrations and more pronounced changes in intensity across the temperatures, indicating they may be more reactive or concentrated in specific phases or conditions [77]. Cesium in Maiganga coal is relatively present in good concentration. The concentration of Cesium at a Decarbonization temperature of 1100℃ suggests the feasibility of isolating Cesium from Maiganga coal as a novel associated deposit. The concentration of Cs ranges from 54.40 ppm at 900℃ to 222.49 ppm at 1000℃, reaching 423.60 ppm at 1100℃, indicating a significant increase with temperature, before decreasing to 245.11 ppm at 1200℃, attributable to the volatility of cesium at elevated temperatures. These trends in concentration and intensity could be important for various industrial applications such as material processing, metallurgy, and the design of catalysts, where the temperature-dependent behavior of elements is critical [78]. The differences in their behaviors showing more stable, gradual changes and significant shifts are tied to their unique chemical properties, such as their ionic sizes and reactivity [79]. The result highlights the behavior of elements with temperature. Some elements may have higher concentrations at lower temperatures, while others peak at higher temperatures, indicating that temperature might influence the element’s emission characteristics or its vaporization into the sample stream. Coal has become a feasible source of rare metals [80]. Cesium shows particular promise for industrial extraction due to its significant concentration at moderate temperatures [81].
Table 7. ICP OES analysis with the concentration of different elements present in Garin Maiganga Coal Nigeria
|
Element Category |
Elements |
900℃ |
1000℃ |
1100℃ |
1200℃ |
|
Alkali/Rare Metals |
Cesium (Cs) |
54.4 |
222.5 |
413.61 |
245.11 |
|
Rubidium (Rb) |
1.75 |
2.17 |
4.41 |
1.42 |
|
|
Lithium (Li) |
0.0006 |
0.0014 |
0.0008 |
0.0007 |
|
|
Sodium (Na) |
0.73 |
0.44 |
0.77 |
0.015 |
|
|
Potassium (K) |
1.53 |
0.35 |
0.77 |
0.019 |
|
|
Precious Metals |
Gold (Au) |
0.015 |
0.017 |
0.016 |
0.008 |
|
Platinum (Pt) |
0.03 |
0.065 |
0.116 |
0.009 |
|
|
Palladium (Pd) |
0.04 |
0.005 |
0.011 |
0.007 |
|
|
Iridium (Ir) |
0.003 |
0.003 |
0.004 |
0.0005 |
|
|
Osmium (Os) |
0.011 |
0.01 |
0.039 |
0.011 |
|
|
Rare Earth Elements |
Cerium (Ce) |
0.042 |
0.045 |
0.06 |
0.003 |
|
Erbium (Er) |
0.254 |
0.466 |
1.124 |
0.007 |
|
|
Lanthanum (La) |
0.032 |
0.064 |
0.08 |
0.0006 |
|
|
Yttrium (Y) |
0.023 |
0.027 |
0.05 |
0.0003 |
|
|
Neodymium (Nd) |
0.031 |
0.016 |
0.025 |
0.0007 |
|
|
Major Elements |
Iron (Fe) |
26.89 |
25.82 |
45.39 |
0.21 |
|
Aluminum (Al) |
32.13 |
20.96 |
42.48 |
0.08 |
|
|
Titanium (Ti) |
0.997 |
1.83 |
3.078 |
0.023 |
|
|
Magnesium (Mg) |
4.27 |
7.72 |
9.31 |
0.031 |
Considering the growing importance of sustainable resource exploitation, it is important to assess the environmental impacts of metal recovery from coal ash, especially the risk of heavy metal contamination of nearby ecosystems. In order to better understand possible environmental dangers, leaching experiments model the release of harmful substances under different environmental circumstances. To reduce the negative effects on the environment, a safe method of disposing was carried out such as stabilization/solidification or encapsulation, based on knowledge of the leaching potential. If the results show that hazardous components are less mobile after thermal stabilization at certain temperatures, then the procedure may be adjusted to continue metal recovery without endangering the environment. Further benefit of conducting thorough leaching assessments is the trust and acceptance from regulators and the public that results from a demonstrated dedication to ecologically acceptable activities.
The main focus of this research is to assess the quality of Maiganga coal utilizing the specified analytical techniques. Proximate, ultimate, and calorific value analyses revealed that Maiganga coal is a high-volatile subbituminous coal. X-ray diffraction (XRD), X-ray fluorescence (XRF), scanning electron microscopy (SEM), and inductively coupled plasma optical emission spectrometry (ICP-OES) were utilized to characterize the decarbonized ash. The primary minerals discovered include quartz, kaolinite, portlandite, pollucite, and muscovite with the oxides being SiO2, Al2O3, and Fe2O3. The findings corresponded with the combustion temperature of coal. The combustion properties of coal are influenced by its calorific value, and incineration at high temperatures signifies the volatilization of certain components. Coal from the Maiganga Coalfield has solely been employed in the Cement Industry; however, it contains rare earth elements including yttrium, scandium, cerium, dysprosium, erbium, europium, holmium, lanthanum, lutetium, neodymium, praseodymium, samarium, terbium, thulium, ytterbium, and gadolinium except for promethium which is undetected and numerous high-value rare metals, including cesium, rubidium, lithium, gold, platinum, osmium, iridium, palladium, ruthenium, rhodium, tellurium, rhenium, indium, tantalum, tungsten, gallium, and cobalt, in Nigeria. This study shows that rare metals and rare earth elements are present in considerable amounts in Maiganga coal, with cesium being particularly enriched at about 1100°C. The temperature indicates ideal for optimizing Cs volatilization, indicating that regulated combustion at or about 1100°C may improve extraction efficacy. Results show that circulating fluidized bed combustion (CFBC) technology, which is well-suited for low-grade fuels, might be a way to increase the value of Maiganga coal beyond its conventional application in the cement industry. Investigating the stability of materials under operating conditions, creating economically viable methods for extracting cesium and other rare metals at this temperature, and determining the potential for large-scale applications to help Nigeria make better use of its resources should be the goals of future research.
However, this research has certain limitations, notably the exclusion of an economic feasibility analysis for the extraction and commercialization of cesium and other rare metals, and the lack of comprehensive evaluation of the practicality of scaling up extraction processes. Future research should focus on pilot-scale testing to validate laboratory findings and optimize extraction strategies for cesium and other precious metals from Maiganga coal ash. These studies should evaluate material stability, process kinetics, and operational parameters under real-world conditions, with emphasis on developing ecologically friendly and cost-effective extraction techniques involving sophisticated hydrometallurgical or pyrometallurgical processes. In-depth techno-economic evaluations are required to determine the commercial viability of large-scale resource recovery and to identify potential incentives and obstacles in transforming the untapped mineral resources of Maiganga coal into practical, sustainable applications.
Table A. ICP OES analysis with the concentration of different elements present in Garin Maiganga Coal Nigeria
|
Elements (E) |
Conc. at 900℃ (ppm) |
Conc. at 1000℃ (ppm) |
Conc. at 1100℃ (ppm) |
Conc. at 1200℃ (ppm) |
Intensity at 900℃ (au) |
Intensity at 1000℃ (au) |
Intensity at 1100℃ (au) |
Intensity at 1200℃ (au) |
|
Ag 328.068 |
0.0005 |
0.0010 |
0.0004 |
0.0012 |
7.2511 |
14.1067 |
5.1134 |
84.6370 |
|
Ag 338.289 |
0.0084 |
0.0019 |
0.0146 |
0.0025 |
9.7341 |
2.2079 |
16.9122 |
14.8407 |
|
Al 167.019 |
0.0011 |
0.0018 |
0.0018 |
0.0007 |
1.3763 |
2.1920 |
2.2035 |
4.0640 |
|
Al 396.152 |
32.1316 |
20.9646 |
42.4829 |
0.0752 |
237666.0495 |
155067.4941 |
314230.9344 |
3861.5393 |
|
As 188.980 |
0.0069 |
0.0123 |
0.0336 |
0.0018 |
2.3149 |
4.1177 |
11.2267 |
3.0282 |
|
As 193.696 |
0.0399 |
0.0153 |
0.0355 |
0.0100 |
8.0632 |
3.0954 |
7.1745 |
9.9438 |
|
Au 242.794 |
0.0153 |
0.0169 |
0.0164 |
0.0080 |
16.3891 |
18.0880 |
17.5073 |
47.3432 |
|
Au 267.594 |
0.0129 |
0.0160 |
0.0331 |
0.0121 |
22.9821 |
28.5129 |
58.9627 |
111.8493 |
|
B 249.678 |
0.0292 |
0.0649 |
0.0748 |
0.0011 |
195.0997 |
434.0532 |
500.3410 |
27.7071 |
|
B 249.772 |
0.0449 |
0.0887 |
0.1094 |
0.0021 |
506.9646 |
1000.8468 |
1234.6968 |
87.5805 |
|
Ba 233.527 |
0.3731 |
0.5798 |
0.7418 |
0.0100 |
3954.8765 |
6146.3185 |
7864.4796 |
1077.2110 |
|
Ba 455.403 |
0.8305 |
1.6250 |
2.5838 |
0.3553 |
456197.2176 |
892628.6390 |
1419305.4160 |
1328770.3420 |
|
Be 234.861 |
0.0033 |
0.0034 |
0.0054 |
0.0002 |
237.3400 |
244.3523 |
386.4916 |
50.1993 |
|
Be 313.042 |
0.0060 |
0.0058 |
0.0086 |
0.0001 |
3358.6543 |
3240.5174 |
4812.4683 |
166.8184 |
|
Bi 222.821 |
0.0526 |
0.0495 |
0.1458 |
0.0203 |
8.5906 |
8.0961 |
23.8357 |
23.2926 |
|
Bi 223.061 |
0.0131 |
0.0199 |
0.0211 |
0.0026 |
6.6717 |
10.1368 |
10.7919 |
9.0051 |
|
Ca 393.366 |
18.6035 |
- |
- |
- |
14083937.3300 |
- |
- |
- |
|
Ca 396.847 |
- |
- |
- |
- |
- |
- |
- |
- |
|
Cd 214.439 |
0.0006 |
0.0023 |
0.0022 |
0.0001 |
3.4593 |
12.3707 |
12.0038 |
3.4987 |
|
Cd 226.502 |
0.0016 |
0.0010 |
0.0042 |
0.0001 |
11.3415 |
7.2039 |
29.1313 |
5.6575 |
|
Ce 418.659 |
0.0418 |
0.0449 |
0.0602 |
0.0032 |
281.8626 |
302.6932 |
405.8946 |
145.7841 |
|
Ce 446.021 |
0.0735 |
0.0438 |
0.0769 |
0.0020 |
547.5996 |
326.0523 |
572.5161 |
91.4502 |
|
Co 228.615 |
0.0229 |
0.0237 |
0.0287 |
0.0017 |
47.6465 |
49.1485 |
59.6481 |
28.0074 |
|
Co 238.892 |
0.0108 |
0.0045 |
0.0106 |
0.0106 |
27.8103 |
11.5450 |
27.3130 |
207.0522 |
|
Cr 205.560 |
0.0568 |
0.0441 |
0.0912 |
0.0014 |
129.5257 |
100.7361 |
208.1110 |
23.1538 |
|
Cr 267.716 |
0.0855 |
0.0708 |
0.1331 |
0.0017 |
503.1448 |
416.6419 |
782.8186 |
75.4738 |
|
Cs 459.311 |
54.4011 |
222.4960 |
413.6078 |
245.1100 |
169.9196 |
694.9569 |
1291.8866 |
258.1215 |
|
Cs 697.327 |
4.9821 |
3.0963 |
1.5598 |
0.3360 |
59.8353 |
37.1870 |
18.7333 |
26.0429 |
|
Cu 324.754 |
0.1289 |
0.0815 |
0.3576 |
0.0016 |
1330.5259 |
841.3096 |
3692.5852 |
78.9067 |
|
Cu 327.395 |
0.0588 |
0.0317 |
0.1359 |
0.0010 |
621.0965 |
334.2463 |
1435.1275 |
48.3293 |
|
Dy 340.780 |
0.0013 |
0.0043 |
0.0041 |
0.0003 |
8.6071 |
28.5578 |
27.4624 |
11.0007 |
|
Dy 353.171 |
0.0049 |
0.0049 |
0.0031 |
0.0003 |
59.5523 |
59.7287 |
37.3615 |
17.7180 |
|
Er 337.275 |
0.2540 |
0.4660 |
1.1237 |
0.0073 |
1561.7621 |
2864.8233 |
6908.3123 |
244.6268 |
|
Er 349.910 |
0.0134 |
0.0192 |
0.0414 |
0.0006 |
194.1890 |
277.9928 |
601.3569 |
47.7753 |
|
Eu 381.967 |
0.0002 |
0.0005 |
0.0007 |
0.0001 |
4.3869 |
11.4520 |
14.5434 |
7.1465 |
|
Eu 420.504 |
0.0003 |
0.0005 |
0.0007 |
0.0003 |
28.0056 |
46.5360 |
75.1209 |
197.3336 |
|
Fe 238.204 |
26.8864 |
25.8244 |
45.3925 |
0.2070 |
179509.9395 |
172419.5910 |
303068.1454 |
10716.6608 |
|
Fe 259.940 |
31.2053 |
37.0297 |
54.8198 |
0.1974 |
104260.3655 |
123720.3799 |
183159.1211 |
4525.5152 |
|
Ga 294.363 |
0.0134 |
0.0128 |
0.0374 |
0.0040 |
23.0631 |
22.1125 |
64.6044 |
42.6114 |
|
Ga 417.204 |
0.2790 |
0.4867 |
0.7982 |
0.0297 |
785.9691 |
1371.1627 |
2248.5085 |
657.8454 |
|
Gd 335.048 |
0.0147 |
0.0009 |
0.0177 |
0.0018 |
97.3593 |
5.8178 |
117.5779 |
75.5161 |
|
Gd 342.246 |
0.0009 |
0.0038 |
0.0033 |
0.0002 |
13.6486 |
59.1491 |
52.6071 |
16.8895 |
|
Ge 209.426 |
0.0637 |
0.0163 |
0.0310 |
0.0035 |
12.5172 |
3.2066 |
6.0869 |
4.2586 |
|
Ge 265.117 |
0.0616 |
0.0918 |
0.1669 |
0.0682 |
27.4037 |
40.8250 |
74.2515 |
201.8095 |
|
Hf 263.872 |
0.0013 |
0.0006 |
0.0035 |
0.0005 |
4.2125 |
1.8743 |
11.6774 |
10.1070 |
|
Hf 264.141 |
0.0013 |
0.0013 |
0.0003 |
0.0020 |
2.6862 |
2.7807 |
0.6342 |
34.4935 |
|
Hg 184.887 |
0.0059 |
0.0020 |
0.0018 |
0.0013 |
2.9445 |
1.0170 |
0.9261 |
4.5051 |
|
Hg 194.164 |
0.0035 |
0.0053 |
0.0003 |
0.0019 |
1.9372 |
2.9528 |
0.1822 |
6.6537 |
|
Ho 339.895 |
0.0010 |
0.0033 |
0.0024 |
0.0001 |
7.4433 |
25.0771 |
18.5591 |
3.7600 |
|
Ho 345.600 |
0.0097 |
0.0089 |
0.0113 |
0.0003 |
68.9084 |
63.4136 |
80.9418 |
13.1448 |
|
In 230.606 |
0.0683 |
0.0365 |
0.0789 |
0.0099 |
13.0018 |
6.9488 |
15.0211 |
15.5292 |
|
In 325.609 |
0.0701 |
0.0647 |
0.1160 |
0.0032 |
59.7258 |
55.0785 |
98.7649 |
19.2661 |
|
Ir 212.681 |
0.0031 |
0.0025 |
0.0043 |
0.0005 |
2.3559 |
1.8923 |
3.2882 |
2.8211 |
|
Ir 224.268 |
0.0380 |
0.0306 |
0.0756 |
0.0018 |
26.3057 |
21.1658 |
52.2878 |
8.0601 |
|
K 766.491 |
1.5326 |
0.3492 |
0.7748 |
0.0188 |
3032.2948 |
690.8572 |
1533.0006 |
1765.2377 |
|
K 769.897 |
0.6969 |
0.0810 |
0.6828 |
0.0114 |
1297.4705 |
150.7534 |
1271.2799 |
815.4721 |
|
La 333.749 |
0.0316 |
0.0639 |
0.0800 |
0.0006 |
379.4134 |
767.4521 |
961.1249 |
53.4414 |
|
La 379.477 |
0.0226 |
0.0207 |
0.0284 |
0.0004 |
478.6280 |
438.4373 |
601.8347 |
50.3341 |
|
Li 610.365 |
0.0006 |
0.0014 |
0.0008 |
0.0007 |
12.8270 |
27.0496 |
16.6108 |
114.0472 |
|
Li 670.783 |
0.0076 |
0.0015 |
0.0050 |
0.0001 |
1051.4837 |
206.5580 |
694.8127 |
248.7006 |
|
Lu 261.541 |
0.0016 |
0.0014 |
0.0027 |
0.0001 |
63.1150 |
53.7304 |
104.9623 |
14.3316 |
|
Lu 291.139 |
0.0008 |
0.0252 |
0.0296 |
0.0012 |
1.6739 |
51.9736 |
61.0498 |
18.3217 |
|
Mg 279.553 |
4.2661 |
7.7229 |
9.3088 |
0.0314 |
744796.8558 |
1348309.3640 |
1625172.4410 |
36703.1892 |
|
Mg 280.270 |
3.5031 |
7.2654 |
9.4939 |
0.0146 |
160573.9358 |
333029.6656 |
435178.5808 |
4395.9717 |
|
Mn 257.610 |
0.6933 |
0.6487 |
0.9837 |
0.0053 |
28600.4250 |
26761.2488 |
40579.9356 |
1527.8759 |
|
Mn 259.372 |
1.1997 |
1.2604 |
1.9622 |
0.0139 |
26161.0811 |
27485.2411 |
42787.8957 |
2056.9166 |
|
Mo 202.032 |
0.0046 |
0.0034 |
0.0126 |
0.0004 |
5.6779 |
4.1790 |
15.4365 |
3.8520 |
|
Mo 204.598 |
0.0080 |
0.0032 |
0.0030 |
0.0002 |
9.3746 |
3.7810 |
3.4987 |
1.9631 |
|
Na 588.995 |
0.7316 |
0.4405 |
0.7692 |
0.0147 |
21135.6984 |
12726.5822 |
22223.6732 |
9911.8743 |
|
Na 589.592 |
0.5414 |
0.4761 |
1.0443 |
0.0180 |
9039.9108 |
7949.5179 |
17435.9717 |
6348.8679 |
|
Nb 309.417 |
0.0061 |
0.0153 |
0.0176 |
0.0040 |
13.1207 |
32.9185 |
37.8475 |
53.2501 |
|
Nb 313.078 |
0.0435 |
0.0909 |
0.1563 |
0.0007 |
411.7492 |
860.6808 |
1479.7323 |
41.1505 |
|
Nd 401.224 |
0.0312 |
0.0158 |
0.0252 |
0.0007 |
105.7192 |
53.6176 |
85.3714 |
13.3801 |
|
Nd 406.108 |
0.0314 |
0.0342 |
0.0554 |
0.0015 |
200.0176 |
217.4584 |
352.2382 |
57.6991 |
|
Ni 216.555 |
0.0372 |
0.0401 |
0.0395 |
0.0008 |
40.5304 |
43.6795 |
43.0447 |
7.4843 |
|
Ni 231.604 |
0.1009 |
0.0870 |
0.1005 |
0.0025 |
81.7617 |
70.5367 |
81.4190 |
16.9353 |
|
Os 225.585 |
0.0108 |
0.0095 |
0.0392 |
0.0114 |
10.2024 |
9.0102 |
37.0440 |
73.5246 |
|
Os 228.228 |
0.0110 |
0.0417 |
0.0070 |
0.0021 |
3.1827 |
12.1168 |
2.0425 |
3.8825 |
|
P 177.434 |
0.0104 |
0.0039 |
0.0025 |
0.0045 |
2.5504 |
0.9649 |
0.6058 |
4.3098 |
|
P 213.618 |
0.3939 |
0.2231 |
0.7326 |
0.0117 |
160.3663 |
90.8179 |
298.2661 |
24.5294 |
|
Pb 182.143 |
0.0108 |
0.0289 |
0.0411 |
0.0066 |
1.1082 |
2.9735 |
4.2249 |
5.1965 |
|
Pb 220.353 |
0.0885 |
0.0507 |
0.1096 |
0.0043 |
22.9213 |
13.1243 |
28.4004 |
12.7234 |
|
Pd 229.651 |
0.0401 |
0.0050 |
0.0109 |
0.0072 |
10.0622 |
1.2450 |
2.7236 |
14.3913 |
|
Pd 340.458 |
0.0010 |
0.0010 |
0.0082 |
0.0020 |
3.9353 |
4.1484 |
33.9611 |
50.3102 |
|
Pr 390.843 |
0.0432 |
0.0596 |
0.0652 |
0.0039 |
111.6734 |
153.9575 |
168.4460 |
59.2000 |
|
Pr 417.939 |
0.0100 |
0.0084 |
0.0243 |
0.0044 |
60.6574 |
50.8985 |
147.7786 |
163.9316 |
|
Pt 203.646 |
0.0304 |
0.0646 |
0.1159 |
0.0087 |
6.6742 |
14.1814 |
25.4298 |
12.9995 |
|
Pt 214.424 |
0.0280 |
0.0265 |
0.0268 |
0.0029 |
13.9281 |
13.2070 |
13.3213 |
10.1853 |
|
Rb 420.179 |
1.7498 |
2.1748 |
4.4139 |
1.4167 |
36.7166 |
45.6361 |
92.6199 |
161.0153 |
|
Rb 780.026 |
0.1827 |
0.3805 |
0.1254 |
0.0025 |
119.6680 |
249.1459 |
82.1268 |
61.8032 |
|
Re 221.427 |
0.0395 |
0.0222 |
0.0314 |
0.0055 |
18.6804 |
10.5180 |
14.8694 |
17.3339 |
|
Re 227.525 |
0.0096 |
0.0087 |
0.0243 |
0.0029 |
9.1310 |
8.2464 |
22.9999 |
18.2348 |
|
Rh 343.488 |
0.0143 |
0.0031 |
0.0135 |
0.0025 |
35.8581 |
7.8290 |
33.7020 |
37.3323 |
|
Rh 369.236 |
0.0020 |
0.0067 |
0.0139 |
0.0025 |
3.5309 |
11.7432 |
24.1417 |
25.9967 |
|
Ru 245.657 |
0.0181 |
0.0089 |
0.0187 |
0.0025 |
15.2764 |
7.5628 |
15.8201 |
18.7698 |
|
Ru 267.876 |
0.0138 |
0.0179 |
0.0527 |
0.0150 |
19.5836 |
25.3216 |
74.5989 |
163.6962 |
|
S 180.669 |
0.0171 |
0.0393 |
0.0216 |
0.0150 |
1.7878 |
4.0969 |
2.2486 |
5.9051 |
|
S 181.972 |
0.0237 |
0.0120 |
0.0137 |
0.0105 |
4.9654 |
2.5082 |
2.8739 |
7.8519 |
|
Sb 206.834 |
0.0141 |
0.0113 |
0.0151 |
0.0042 |
3.7249 |
2.9871 |
3.9918 |
6.8336 |
|
Sb 217.582 |
0.0525 |
0.0424 |
0.0234 |
0.0056 |
13.2144 |
10.6773 |
5.8744 |
9.3150 |
|
Sc 335.372 |
0.0027 |
0.0083 |
0.0158 |
0.0001 |
118.1200 |
359.1332 |
682.3579 |
26.9057 |
|
Sc 361.383 |
0.0034 |
0.0078 |
0.0134 |
0.0001 |
240.4777 |
549.9881 |
941.8502 |
55.8301 |
|
Se 196.026 |
0.0066 |
0.0249 |
0.0205 |
0.0038 |
1.6888 |
6.3377 |
5.2172 |
5.0130 |
|
Se 203.985 |
0.0400 |
0.0656 |
0.0157 |
0.0126 |
5.4977 |
9.0103 |
2.1596 |
9.0607 |
|
Si 251.611 |
0.3124 |
0.3731 |
4.9531 |
0.0401 |
264.5823 |
315.9383 |
4194.7414 |
201.0204 |
|
Si 288.158 |
0.4076 |
0.5180 |
5.9428 |
0.0376 |
664.7491 |
844.7023 |
9691.3959 |
347.5327 |
|
Sm 359.259 |
0.0032 |
0.0055 |
0.0012 |
0.0001 |
17.5098 |
30.3301 |
6.6717 |
4.2188 |
|
Sm 360.949 |
0.0054 |
0.0063 |
0.0653 |
0.0045 |
19.7507 |
23.0203 |
237.0062 |
95.6295 |
|
Sn 189.925 |
0.0136 |
0.0057 |
0.0202 |
0.0040 |
3.3283 |
1.3851 |
4.9405 |
9.5206 |
|
Sn 283.998 |
0.0890 |
0.1024 |
0.0977 |
0.0013 |
30.5133 |
35.1025 |
33.4880 |
3.5746 |
|
Sr 407.771 |
0.1397 |
0.2513 |
0.4638 |
0.0045 |
221167.2535 |
397888.3732 |
734284.9638 |
44843.5041 |
|
Sr 421.552 |
0.1758 |
0.2890 |
0.6184 |
0.0077 |
138721.3443 |
228088.1569 |
488066.2058 |
36674.2714 |
|
Ta 263.558 |
0.0032 |
0.0063 |
0.0075 |
0.0011 |
3.5856 |
7.0035 |
8.3338 |
7.0556 |
|
Ta 263.558 |
0.0027 |
0.0062 |
0.0076 |
0.0013 |
2.9967 |
6.9387 |
8.5094 |
8.5357 |
|
Tb 350.914 |
0.0035 |
0.0017 |
0.0064 |
0.0014 |
33.2110 |
15.8190 |
60.6271 |
76.8732 |
|
Tb 367.636 |
0.0021 |
0.0011 |
0.0035 |
0.0014 |
9.7308 |
5.0614 |
16.2328 |
36.3174 |
|
Te 182.153 |
0.0375 |
0.0277 |
0.1096 |
0.0137 |
1.8854 |
1.3965 |
5.5173 |
4.1770 |
|
Te 214.282 |
0.0091 |
0.0060 |
0.0165 |
0.0021 |
3.0513 |
2.0328 |
5.5560 |
4.5845 |
|
Th 269.242 |
0.0599 |
0.2015 |
0.5166 |
0.0539 |
18.6883 |
62.9183 |
161.2846 |
115.5451 |
|
Th 283.730 |
0.0177 |
0.0273 |
0.0269 |
0.0028 |
28.3262 |
43.6678 |
43.0130 |
32.4839 |
|
Ti 336.122 |
0.9974 |
1.8302 |
3.0775 |
0.0226 |
26372.0066 |
48389.5774 |
81368.4455 |
3300.2094 |
|
Ti 337.280 |
0.7777 |
1.4681 |
2.6997 |
0.0240 |
7897.7026 |
14908.4916 |
27415.4006 |
1359.6803 |
|
Tl 190.794 |
0.0120 |
0.0204 |
0.0033 |
0.0032 |
1.7678 |
3.0051 |
0.4908 |
5.1605 |
|
Tl 276.789 |
0.0057 |
0.0712 |
0.0706 |
0.0047 |
1.4816 |
18.3410 |
18.2025 |
8.9416 |
|
Tm 313.125 |
0.0066 |
0.0048 |
0.0009 |
0.0003 |
131.1602 |
96.5687 |
18.6139 |
40.2984 |
|
Tm 342.508 |
0.0082 |
0.0055 |
0.0070 |
0.0004 |
131.3861 |
88.7739 |
111.7559 |
39.0246 |
|
U 367.007 |
0.0614 |
0.0752 |
0.4926 |
0.0440 |
57.0296 |
69.8741 |
457.7508 |
226.4701 |
|
U 385.957 |
0.0133 |
0.0399 |
0.0289 |
0.0040 |
19.9115 |
59.8929 |
43.4231 |
35.7374 |
|
V 292.401 |
0.0899 |
0.1192 |
0.2498 |
0.0001 |
821.3361 |
1089.1250 |
2281.8594 |
6.6611 |
|
V 309.310 |
0.0603 |
0.1170 |
0.3243 |
0.0089 |
388.6803 |
754.6210 |
2090.7034 |
343.6542 |
|
W 207.912 |
0.0168 |
0.0145 |
0.0120 |
0.0088 |
8.1317 |
7.0413 |
5.7967 |
34.5289 |
|
W 209.475 |
0.0460 |
0.0081 |
0.0087 |
0.0091 |
11.3717 |
2.0011 |
2.1475 |
16.3685 |
|
Y 360.074 |
0.0234 |
0.0271 |
0.0502 |
0.0003 |
1150.9807 |
1334.0305 |
2471.7063 |
74.0612 |
|
Y 371.029 |
0.0110 |
0.0130 |
0.0261 |
0.0001 |
429.5625 |
505.1578 |
1016.8082 |
12.6171 |
|
Yb 328.937 |
0.0016 |
0.0019 |
0.0039 |
0.0000 |
140.6810 |
169.1226 |
338.4066 |
20.5042 |
|
Yb 369.419 |
0.0013 |
0.0024 |
0.0041 |
0.0000 |
117.0969 |
205.9137 |
358.1829 |
8.1182 |
|
Zn 202.548 |
0.3422 |
0.1527 |
0.6856 |
0.0015 |
943.6386 |
421.2358 |
1890.7646 |
41.8014 |
|
Zn 213.857 |
0.1470 |
0.0726 |
0.2912 |
0.0000 |
1526.4375 |
754.3112 |
3024.1064 |
2.3642 |
|
Zr 339.198 |
0.0177 |
0.0159 |
0.0695 |
0.0041 |
292.9917 |
264.4139 |
1152.5764 |
424.4674 |
|
Zr 343.823 |
0.0062 |
0.0056 |
0.0291 |
0.0014 |
141.3780 |
126.3804 |
662.0639 |
186.9591 |
[1] Niu, H.Y., Sun, Q.Q., Bu, Y.C., Chen, H.Y., Yang, Y.X., Li, S.P., Sun, S.W., Mao, Z.H., Tao, M. (2022). Study of the microstructure and oxidation characteristics of residual coal in deep mines. Journal of Cleaner Production, 373: 133923. https://doi.org/10.1016/j.jclepro.2022.133923
[2] Oberschelp, C., Pfister, S., Raptis, C.E., Hellweg, S. (2019). Global emission hotspots of coal power generation. Nature Sustainability, 2(2): 113-121. https://doi.org/10.1038/s41893-019-0221-6
[3] Tchapda, A.H., Pisupati, S.V. (2014). A review of thermal co-conversion of coal and biomass/waste. Energies, 7(3): 1098-1148. https://doi.org/10.3390/en7031098
[4] Jiang, J.Y., Zhang, S., Longhurst, P., Yang, W.H., Zheng, S.J. (2021). Molecular structure characterization of bituminous coal in Northern China via XRD, Raman and FTIR spectroscopy. Spectrochimica Acta Part A: Molecular and Biomolecular Spectroscopy, 255: 119724. https://doi.org/10.1016/j.saa.2021.119724
[5] Miller, B.G. (2010). Clean Coal Engineering Technology. Elsevier.
[6] Naibbi, A.I., Healey, R.G. (2013). Northern Nigeria's dependence on fuelwood: Insights from nationwide cooking fuel distribution data. International Journal of Humanities and Social Science, 3(17): 160-173.
[7] Heidrich, C., Feuerborn, H.J., Weir, A. (2013). Coal combustion products: A global perspective. In World of Coal Ash Conference, 22: 25.
[8] Raza, M.A., Karim, A., Aman, M.M., Al-Khasawneh, M.A., Faheem, M. (2025). Global progress towards the Coal: Tracking coal reserves, coal prices, electricity from coal, carbon emissions and coal phase-out. Gondwana Research, 139: 43-72. https://doi.org/10.1016/j.gr.2024.11.007
[9] Rahman, M., Pudasainee, D., Gupta, R. (2017). Review on chemical composition, properties and applications of coal types. Fuel Processing Technology, 158: 35-49. https://doi.org/10.1016/j.fuproc.2016.12.010
[10] Qu, Y.W., Chen, F., Ma, L.L., Jiang, P.W., Li, B., Ren, J.G., Lv, R.S., Liu, G.F., Song, Z.M., Chang, P., Barakos, G. (2025). Fractal characterization of a multi-scale pore structure in ultra-deep coal seams. Fractal and Fractional, 9(4): 250. https://doi.org/10.3390/fractalfract9040250
[11] Baruya, P., Kessels, J. (2013). Coal prospects in Botswana, Mozambique, Zambia, Zimbabwe and Namibia. IEA Clean Coal Centre. https://doi.org/10.13140/RG.2.2.36546.48325
[12] Eberhard, A. (2011). The future of South African coal: Market, investment and policy challenges. Program on Energy and Sustainable Development, 100: 1-44.
[13] Hassan, A.S. (2023). Coal mining and environmental sustainability in South Africa: Do institutions matter? Environmental Science and Pollution Research, 30(8): 20431-20449. https://doi.org/10.1007/s11356-022-23585-6
[14] Patrick, S.M., Shirinde, J., Kgarosi, K., Makinthisa, T., Euripidou, R., Munnik, V. (2025). Just energy transition from coal in South Africa: A scoping review. Environmental Science & Policy, 167: 104044. https://doi.org/10.1016/j.envsci.2025.104044
[15] Nalule, V., Acheampong, T. (2021). Energy transition indicators in African countries: Managing the possible decline of fossil fuels and tackling energy access challenges. Journal of Sustainable Development Law and Policy (The), 12(1): 1-48. https://doi.org/10.4314/jsdlp.v12i1.2
[16] Onifade, M. (2022). Countermeasures against coal spontaneous combustion: A review. International Journal of Coal Preparation and Utilization, 42(10): 2953-2975. https://doi.org/10.1080/19392699.2021.1920933
[17] Sachs, J.D., Toledano, P., Dietrich Brauch, M., Mebratu-Tsegaye, T., Uwaifo, E., Sherrill, B.M. (2022). Roadmap to zero-carbon electrification of Africa by 2050: The green energy transition and the role of the natural resource sector (minerals, fossil fuels, and land). https://papers.ssrn.com/sol3/papers.cfm?abstract_id=4042193.
[18] Riti, J.S., Riti, M.K.J., Oji-Okoro, I. (2022). Renewable energy consumption in sub-Saharan Africa (SSA): Implications on economic and environmental sustainability. Current Research in Environmental Sustainability, 4: 100129. https://doi.org/10.1016/j.crsust.2022.100129
[19] Cielo, A., Margiaria, P., Lazzeroni, P., Mariuzzo, I., Repetto, M. (2021). Renewable Energy Communities business models under the 2020 Italian regulation. Journal of Cleaner Production, 316: 128217. https://doi.org/10.1016/j.jclepro.2021.128217
[20] Bhatt, A., Priyadarshini, S., Mohanakrishnan, A.A., Abri, A., Sattler, M., Techapaphawit, S. (2019). Physical, chemical, and geotechnical properties of coal fly ash: A global review. Case Studies in Construction Materials, 11: e00263. https://doi.org/10.1016/j.cscm.2019.e00263
[21] Benedict, J.N., Nasir, M.M., Ndikilar, C.E., Moses, G.W., Gaima, D.K., Dankawu, M.U. (2022). Characterization of some Nigerian coal for effective power generation and industrial utility. DUJOPAS, 8(1b): 117-126. https://doi.org/10.4314/dujopas.v8i1b
[22] Ikwuagwu, C.S., Uzoegbu, M.U. (2017). The Maiganga coal deposit: Bituminous, sub-bituminous or lignite. IOSR Journal of Applied Geology and Geophysics, 5(1): 67-74. https://doi.org/10.9790/0990-0501016774
[23] Mangs, A., Wagner, N., Moroeng, O., Lar, U. (2022). Petrographic composition of coal within the Benue Trough, Nigeria and a consideration of the paleodepositional setting. International Journal of Coal Science & Technology, 9(1): 35. https://doi.org/10.1007/s40789-022-00500-5
[24] Ukpai, S., Ojobor, R.G., Okogbue, C.O., Nnabo, P.N., Oha, A.I., Ekwe, A.C., Nweke, M.O. (2021). Socio-economic influence of hydrogeology in regions adjoining coal bearing formation: Water policy in Anambra Basin. Water Policy, 23(3): 654-683. https://doi.org/10.2166/wp.2021.275
[25] Olade, M. (2019). Solid mineral deposits and mining in Nigeria: A sector in transitional change. Achievers Journal of Scientific Research, 2(1): 1-16.
[26] Oboirien, B., North, B., Obayopo, S., Odusote, J., Sadiku, E. (2018). Analysis of clean coal technology in Nigeria for energy generation. Energy Strategy Reviews, 20: 64-70. https://doi.org/10.1016/j.esr.2018.01.002
[27] Fatoye, F., Gideon, Y. (2014). Coal deposits in Nigeria–a review. Africa Geoscience Review, 20(1): 35-42.
[28] Liu, J., Yu, Q., Chen, Y., Liu, J. (2022). The impact of digital technology development on carbon emissions: A spatial effect analysis for China. Resources, Conservation and Recycling, 185: 106445. https://doi.org/10.1016/j.resconrec.2022.106445
[29] Huang, W., Sun, J. (2009). A NGSA-II based parameter calibration algorithm for traffic microsimulation model. In 2009 International Conference on Measuring Technology and Mechatronics Automation, Zhangjiajie, China, pp. 436-439. https://doi.org/10.1109/ICMTMA.2009.437
[30] Pradhan, S., Mohanta, S. (2020). A method to perform float-and-sink test for separation of coal samples of various densities and determination of 'Probable Error' and 'Imperfection'. IOP SciNotes, 1(2): 024403. https://doi.org/10.1088/2633-1357/abaf36
[31] Ward, C.R. (2016). Analysis, origin and significance of mineral matter in coal: An updated review. International Journal of Coal Geology, 165: 1-27. https://doi.org/10.1016/j.coal.2016.07.014
[32] Ali, B.F., Ibraheem, F.H., Jassim, A.M., Jassim, H.M. (2020). The proximate analysis method for the composition determination of different coal types. In 2020 6th International Engineering Conference Sustainable Technology and Development (IEC), Erbil, Iraq, pp. 91-96. https://doi.org/10.1109/IEC49899.2020.9122917
[33] Ruiz, I.S., Ward, C.R. (2008). Coal combustion. In Applied Coal Petrology, pp. 85-117. http://doi.org/10.1016/B978-0-08-045051-3.00004-X
[34] Borah, R.C., Ghosh, P., Rao, P.G. (2011). A review on devolatilization of coal in fluidized bed. International Journal of Energy Research, 35(11): 929-963. https://doi.org/10.1002/er.1833
[35] Abdalla, A.N., Tao, H., Bagaber, S.A., Ali, O.M., Kamil, M., Ma, X., Awad, O.I. (2019). Prediction of emissions and performance of a gasoline engine running with fusel oil–gasoline blends using response surface methodology. Fuel, 253: 1-14. https://doi.org/10.1016/j.fuel.2019.04.085
[36] Speight, J.G. (2013). Coal-Fired Power Generation Handbook. John Wiley & Sons, Laramie, Wyoming.
[37] Walters, R.N., Hackett, S.M., Lyon, R.E. (2000). Heats of combustion of high temperature polymers. Fire and Materials, 24(5): 245-252. https://doi.org/10.1002/1099-1018(200009/10)24:5<245::AID-FAM744>3.0.CO;2-7
[38] Victor, U.O., Japhet, G.J., Kagoro, M.L.A.P., Gurumyen, K.K., Lohdip, Y., Sase, T.J. (2020). Green synthesis and spectroscopic characterization of iron (III) complex of urea from human urine and iron rust. Journal of Chemical Society of Nigeria, 45(5). https://doi.org/10.46602/jcsn.v45i5.527
[39] Song, Y.J., Cong, Y.H., Wang, B., Zhang, N. (2020). Applications of Fourier transform infrared spectroscopy to pharmaceutical preparations. Expert Opinion on Drug Delivery, 17(4): 551-571. https://doi.org/10.1080/17425247.2020.1737671
[40] Aginam, C., Onodagu, P., Obi, O. (2023). Effects of percentage composition of essential chemicals in Portland limestone cement on the strength and workability of concrete. Journal of Engineering and Applied Sciences, 2(3): 368-375.
[41] Lapiro, I., Mezhov, A., Kovler, K. (2022). Performance of corrosion inhibitors in reinforced concrete elements under electrical voltage. Construction and Building Materials, 342: 127656. https://doi.org/10.1016/j.conbuildmat.2022.127656
[42] Erinne, N.J. (2022). Chemical engineering, Nigeria and the changing society. Journal of the Nigerian Society of Chemical Engineers, 37(3): 1-8. https://doi.org/10.51975/22370301.som
[43] Igwilo, K.C., Oguamah, I., George, S.C., Uwaezuoke, N., Obubike, U. (2023). Evaluation of the suitability of Pleurotus as a fluid loss control agent using the chemical structural properties approach. Scientific African, 19: e01468. https://doi.org/10.1016/j.sciaf.2022.e01468
[44] Zuma, M.C., Nomngongo, P.N., Mketo, N. (2021). Simultaneous determination of REEs in coal samples using the combination of microwave-assisted ashing and ultrasound-assisted extraction methods followed by ICP-OES analysis. Minerals, 11(10): 1103. https://doi.org/10.3390/min11101103
[45] Douvris, C., Vaughan, T., Bussan, D., Bartzas, G., Thomas, R. (2023). How ICP-OES changed the face of trace element analysis: Review of the global application landscape. Science of the Total Environment, 905: 167242. https://doi.org/10.1016/j.scitotenv.2023.167242
[46] Chukwu, M., Folayan, C.O., Pam, G.Y., Obada, D.O. (2016). Characterization of some Nigerian coals for power generation. Journal of Combustion, 2016(1): 9728278. https://doi.org/10.1155/2016/9728278
[47] Dai, S., Hower, J.C., Finkelman, R.B., Graham, I.T., French, D., Ward, C.R., Zhao, L. Organic associations of non-mineral elements in coal: A review. International Journal of Coal Geology, 218: 103347. https://doi.org/10.1016/j.coal.2019.103347
[48] Boruah, A., Phukan, A., Singh, S. (2024). Utilization of coal for hydrogen generation. International Journal of Coal Preparation and Utilization, 45(7): 1412-1433. https://doi.org/10.1080/19392699.2024.2387651
[49] Nádudvari, A., Fabiańska, M.J., Marynowski, L., Kozielska, B., Konieczyński, J., Smołka-Danielowska, D., Ćmiel, S. (2018). Distribution of coal and coal combustion related organic pollutants in the environment of the Upper Silesian Industrial Region. Science of the Total Environment, 628-629: 1462-1488. https://doi.org/10.1016/j.scitotenv.2018.02.092
[50] Kamble, A.D., Mendhe, V.A., Chavan, P.D., Saxena, V.K. (2022). Insights of mineral catalytic effects of high ash coal on carbon conversion in fluidized bed Co-gasification through FTIR, XRD, XRF and FE-SEM. Renewable Energy, 183: 729-751. https://doi.org/10.1016/j.renene.2021.11.022
[51] Dai, S.F., Finkelman, R.B., Hower, J.C., French, D., Graham, I.T., Zhao, L. (2023). Inorganic Geochemistry of Coal. Elsevier.
[52] Adeleke, A.A., Odusote, J.K., Lasode, O.A., Ikubanni, P.P., Malathi, M., Paswan, D. (2019). Densification of coal fines and mildly torrefied biomass into composite fuel using different organic binders. Heliyon, 5(7): e02160. https://doi.org/10.1016/j.heliyon.2019.e02160
[53] Gasparini, E., Tarantino, S.C., Ghigna, P., Pia Riccardi, M., Cedillo-González, E.I., Siligardi, C., Zema, M. (2013). Thermal dehydroxylation of kaolinite under isothermal conditions. Applied Clay Science, 80-81: 417-425. https://doi.org/10.1016/j.clay.2013.07.017
[54] Fan, C., Yan, J.W., Huang, Y.R., Han, X.X., Jiang, X.M. (2015). XRD and TG-FTIR study of the effect of mineral matrix on the pyrolysis and combustion of organic matter in shale char. Fuel, 139: 502-510. https://doi.org/10.1016/j.fuel.2014.09.021
[55] Yusuf, M.O. (2023). Bond characterization in cementitious material binders using Fourier-transform infrared spectroscopy. Applied Sciences, 13(5): 3353. https://doi.org/10.3390/app13053353
[56] Yin, Y.Y., Yin, H.X., Wu, Z.H., Qi, C.W., Tian, H., Zhang, W., Hu, Z.M., Feng, L.H. (2019). Characterization of coals and coal ashes with high Si content using combined second-derivative infrared spectroscopy and Raman spectroscopy. Crystals, 9(10): 513. https://doi.org/10.3390/cryst9100513
[57] Omar, M.F., Akil, H.M., Rasyid, M.F.A., Sharif, J.M. (2015). Thermal properties of polypropylene/muscovite layered silicate composites: Effects of organic modifications and compatibilisers. Journal of Composite Materials, 49(10): 1195-1209. https://doi.org/10.1177/0021998314531311
[58] Zunino, F., Boehm-Courjault, E., Scrivener, K. (2020). The impact of calcite impurities in clays containing kaolinite on their reactivity in cement after calcination. Materials and Structures, 53: 44. https://doi.org/10.1617/s11527-020-01478-9
[59] Belver, C., Breen, C., Clegg, F., Fernandes, C.E., Vicente, M.A. (2005). A variable-temperature diffuse reflectance infrared Fourier transform spectroscopy study of the binding of water and pyridine to the surface of acid-activated metakaolinite. Langmuir, 21(6): 2129-2136. https://doi.org/10.1021/la048323m
[60] Zhao, C.L., Liu, B.J., Ma, J.G., Liu, S.M., Blokhin, M.G. (2017). Occurrence of rubidium and cesium in Iqe coal, Qinghai-Tibet Plateau: Evidence from sequential chemical extraction experiment. Energy Exploration & Exploitation, 35(3): 376-387. https://doi.org/10.1177/0144598717690
[61] Yu, J.H., Cai, Y.F., Sun, T., Jiang, W., Zhang, R.Q., Griffin, W.L., Mao, Z.Q., Xia, L. (2023). Distribution and enrichment of rare metal elements in the basement rocks of South China: Controls on rare-metal mineralization. Ore Geology Reviews, 163: 105797. https://doi.org/10.1016/j.oregeorev.2023.105797
[62] Montross, S.N., Verba, C.A., Collins, K. (2017). Characterization of rare earth element minerals in coal utilization byproducts. National Energy Technology Laboratory (NETL), Pittsburgh, PA, Morgantown, WV (United States), No. NETL-TRS-20972.
[63] Paul, K.T., Satpathy, S.K., Manna, I., Chakraborty, K.K., Nando, G.B. (2007). Preparation and characterization of nano structured materials from fly ash: A waste from thermal power stations, by high energy ball milling. Nanoscale Research Letters, 2: 397-404. https://doi.org/10.1007/s11671-007-9074-4
[64] Manju, C.S. (2002). Mineralogical, morphological and geochemical studies on Kundara and Madayi kaolins, Kerala. Doctoral dissertation, Clays and Clay Minerals Unit Regional Research Laboratory (CSIR), Thiruvananthapuram.
[65] Hassan, S.F., Mahmoud, M.A., Abd El-Rahman, M.A. (2016). Effect of radioactive minerals potentiality and primordial nuclei distribution on radiation exposure levels within muscovite granite, Wadi Nugrus, Southeastern Desert, Egypt. Journal of Geoscience and Environment Protection, 4(3): 62-78. https://doi.org/10.4236/gep.2016.43006
[66] Dai, S.F., Ward, C.R., Graham, I.T., French, D., Hower, J.C., Zhao, L., Wang, X.B. (2017). Altered volcanic ashes in coal and coal-bearing sequences: A review of their nature and significance. Earth-Science Reviews, 175: 44-74. https://doi.org/10.1016/j.earscirev.2017.10.005
[67] Zhou, C.C., Liu, G.J., Yan, Z.C., Fang, T., Wang, R.W. (2012). Transformation behavior of mineral composition and trace elements during coal gangue combustion. Fuel, 97: 644-650. https://doi.org/10.1016/j.fuel.2012.02.027
[68] Maurya, R.S., Laha, T. (2015). Effect of rare earth and transition metal elements on the glass forming ability of mechanical alloyed Al–TM–RE based amorphous alloys. Journal of Materials Science & Technology, 31(11): 1118-1124. https://doi.org/10.1016/j.jmst.2015.09.007
[69] Durrant, C.B., Begg, J.D., Kersting, A.B., Zavarin, M. (2018). Cesium sorption reversibility and kinetics on illite, montmorillonite, and kaolinite. Science of the Total Environment, 610-611: 511-520. https://doi.org/10.1016/j.scitotenv.2017.08.122
[70] Tsybulya, S.V., Kryukova, G.N. (2006). Nanocrystalline transition aluminas: Nanostructure and features of X-ray powder diffraction patterns of low-temperature Al2O3 polymorphs. Physical Review B, 77(2): 024112. https://doi.org/10.1103/PhysRevB.77.024112
[71] Kim, J., Lee, K., Seo, B.K., Hyun, J.H. (2020). Effective removal of radioactive cesium from contaminated water by synthesized composite adsorbent and its thermal treatment for enhanced storage stability. Environmental Research, 191: 110099. https://doi.org/10.1016/j.envres.2020.110099
[72] Whelton, A.J., Dietrich, A.M. (2004). Relationship between intensity, concentration, and temperature for drinking water odorants. Water Research, 38(6): 1604-1614. https://doi.org/10.1016/j.watres.2003.11.036
[73] Soltanpour, P.N., Jones Jr, J.B., Workman, S.M. (1982). Optical emission spectrometry. Methods of Soil Analysis: Part 2 Chemical and Microbiological Properties, 9: 29-65. https://doi.org/10.2134/agronmonogr9.2.2ed.c3
[74] George, L., Cook, N.J., Cristiana, L.C., Wade, B.P. (2015). Trace and minor elements in galena: A reconnaissance LA-ICP-MS study. American Mineralogist, 100(2-3): 548-569. https://doi.org/10.2138/am-2015-4862
[75] Binnemans, K., Jones, P.T., Blanpain, B., Van Gerven, T., Yang, Y., Walton, A., Buchert, M. (2013). Recycling of rare earths: A critical review. Journal of Cleaner Production, 51: 1-22. https://doi.org/10.1016/j.jclepro.2012.12.037
[76] Hulsbosch, N., Hertogen, J., Dewaele, S., André, L., Muchez, P. (2014). Alkali metal and rare earth element evolution of rock-forming minerals from the Gatumba area pegmatites (Rwanda): Quantitative assessment of crystal-melt fractionation in the regional zonation of pegmatite groups. Geochimica et Cosmochimica Acta, 132: 349-374. https://doi.org/10.1016/j.gca.2014.02.006
[77] Ashraf, M.A., Akib, S., Maah, M.J., Yusoff, I., Balkhair, K.S. (2014). Cesium-137: Radio-chemistry, fate, and transport, remediation, and future concerns. Critical Reviews in Environmental Science and Technology, 44(15): 1740-1793. https://doi.org/10.1080/10643389.2013.790753
[78] Guillon, O., Gonzalez‐Julian, J., Dargatz, B., Kessel, T., Schierning, G., Räthel, J., Herrmann, M. (2014). Field‐assisted sintering technology/spark plasma sintering: Mechanisms, materials, and technology developments. Advanced Engineering Materials, 16(7): 830-849. https://doi.org/10.1002/adem.201300409
[79] Xu, L., Liang, H.W., Yang, Y., Yu, S.H. (2018). Stability and reactivity: Positive and negative aspects for nanoparticle processing. Chemical Reviews, 118(7): 3209-3250. https://doi.org/10.1021/acs.chemrev.7b00208
[80] Saleh, R.A., Gimba, A., Adekunle, A., Olosho, A., Sammonu, T., Nzerem, P., Odimba, C.R. (2023). A review on extraction of rare earth elements (REEs) from coal using acid leaching. In 2023 2nd International Conference on Multidisciplinary Engineering and Applied Science (ICMEAS), pp. 1-6. https://doi.org/10.1109/ICMEAS58693.2023.10429850
[81] Sun, X.Q., Luo, H.M., Dai, S. (2012). Ionic liquids-based extraction: A promising strategy for the advanced nuclear fuel cycle. Chemical Reviews, 112(4): 2100-2128. https://doi.org/10.1021/cr200193x