Qusai Adnan Mahdi | Mahmoud A. Mashkour* | Ibtihal A. Mhmood
© 2022 IIETA. This article is published by IIETA and is licensed under the CC BY 4.0 license (http://creativecommons.org/licenses/by/4.0/).
OPEN ACCESS
The combined impact of the MFC and EGR methods on the performance of the C.I. engine is investigated experimentally in this study. The work focused on biodiesel fuel under the effect of different EGR rates 10-30% with the optimal value of fuel polarization. At first, the magnetic intensity optimization was done with other engine design parameters by using diesel fuel alone. The study covered a wide range of engine parameters to select the optimal valves. Using the Taguchi approach and orthogonal array L16 to solve the five factors, such as: CR (15,16,17, and 18), IP (175,200,225, and 250 bar), MFC (4000,6000,8000, and 12000 Gauss), load (25,50,75, and 100%), and TI (19, 21, 23, and 27 degree b TDC). The results showed that the diesel engine's optimum parameters were CR=18, IP=200bar, MFC=8000 Gauss, load 100%, and TI=23° b TDC. The results indicated that the coefficient of determination has an excellent level (i.e.), R2 =97.05% Peak fisher valve F=8.37, with normally distributed and significant coefficients in the model, was utilized to test the model capability. The outcome shows that the 10WCO+10% EGR+8000G has higher cylinder pressure and the BTE increased by 12.5% if compared with DF, and lower brake specific fuel consumption.
diesel engine, magnetic fuel conditioner, ignition delay, brake power, biodiesel, Taguchi approach, heat release rate, injection pressure
The internal combustion engine began to improve around the 19th century, followed by high growth rates, then the later hundred years started with decreased improvement Zheng et al. [1]. Nowadays, numerous investigation programs are conducted to develop the operation of the diesel engine and reduce the emissions. Some programs deal with changing the combustion chamber design and other engine design parameters, such as timing of injection, injection pressure, compression ratio and engine speed. Despite trials by researchers, the diesel engine suffers from a lack of thermal efficiency and pollutants. A large amount of fuel energy goes with exhausted gases, and the other dissipated in engine cooling water. To solve this problem, the authors make several trials on engine auxiliary devices, such as subjected the fuel line to magnetic fields or set up a suitable design such as exhausted gas recirculation. At the same time, the other merger was between these devices. Magnetic fields affect fluids having polar contents in general, since polar molecules are electrically charged by definition, and behave like polar material that is affected by magnetic flux. Diesel liquid is really a complex mixture of thousands of distinct components. When fuel flows through a strong permanent magnet, hydrocarbons shift orientation and go from para to ortho. The ortho state reduces intermolecular forces and increases hydrogen space hydrogen actively interlocks with oxygen. In which Lorentz Force is definite as:
F=qv x B
where, (q) is the charge on a particle, (v) is its velocity, and (B) is the magnetic field, has a positive effect on all reactions that occurs at the moment of combustion due to the improvement of fuel quality and thus reducing the rate of fuel consumption Kumar and Raju [2]. The viscosity of conventional diesel fuel is decreasing when electrorheology is applied to the fuel Du et al. [3]. Also the electromagnetic flux makes important modifications in the cetane number of diesel fuel Elamin et al. [4]. One of the important solutions is blended alternative fuel or gas liquids. To enhance the combustion characteristics. Hassan et al. [5] mixing fuel help to achieve the fuel-burning by improving the fuel injection parameters Wang et al. [6]. Exhaust Gas Recirculation (EGR) is an eco-friendly alternative to lesser NOx and particulate matter emission. The use of EGR in C.I. engines depresses the attentiveness of oxygen mixture and temperature of the flame Abd-Alla [7]. It employs EGR, Magnetic Fuel polarization and blended Bio-diesel fuel. This leads to enhanced mechanical efficiency in addition to less consumption of fuel. Govindasamy and Dhandapani [8] studied the impacts of EGR engine system and magnetic fuel process system on emission with bio-diesel fuel. A report entitled, with EGR, the mechanical efficiency was found to rise by 13%. On the other hand, the results proved no significant modification in the value of the BMEP still, the ratio of 50% was closer after compared to extra blends. When examined influence caused by the magnetic flux with a reduction in nitroxide percentage inside the bio-diesel engine with the EGR engine system, the important conclusion was when the intensity of magnetic field was increased, engine BTE is improved about 5%, and the percentage of HC, and CO are reduced.
2.1 Magnetic and engine set up
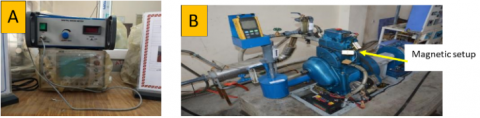
Application of magnetic fields to the diesel fuel line is one approach to improving engine efficiency and lowering fuel consumption. A magnetic field can be employed to modify the orientation of hydrocarbons and molecules as mentioned above. Many types of magnetic fields, are available in a wide range of shapes, sizes and grades. However, there are three types of magnetic fields used for this goal such as Aluminum Nickel Cobalt (AlNiCo), Neodymium Iron Boron (NdFeB), and Ferrit (Fe). The second type is considered as a strong permanent magnet with high magnetic properties compared to other magnets. Hence, it is employed in the current work, for measuring the intensity of magnetic fields, a standard digital Gauss meter is utilized as shown in Figure 1A. Figure 1B shows the installation of a magnetic field on the fuel line.
Figure 1. A-Gauss meter B- Magnetic fields setup
2.2 Surge tank design for intercooler
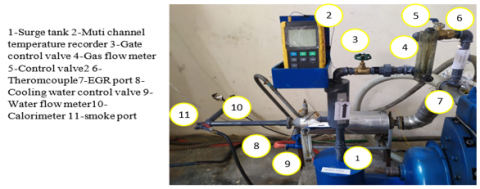
Figure 2 depicts the surge tank's schematic. It has a copper pipe that circulates hot exhaust gas and a steel pipe that cools retuned gases, all specifications of was listed in Table 1. After exiting the copper pipe, the exhaust gases are routed to an aluminum surge tank, where the larger surface area helps smooth out the exhaust gas composition. The rota meter will be used to alter the amount of exhaust gas emitted. The surge tank exhaust gas temperature was found to be between 31 and 33 degrees Celsius, showing a significant reduction. The setup operated in this paper is shown in Figure 3 [9]. By inserting these values into Eq. (1), the following heat transfer coefficient is obtained:
$\mathrm{Q}=\mathrm{m}_{\mathrm{h}} \mathrm{Cp},_{\mathrm{h}}\left(\mathrm{T}_{\mathrm{hi}}-\mathrm{T}_{\mathrm{ho}}\right)=\mathrm{m}_{\mathrm{c}} \mathrm{Cp},_{ \mathrm{c}}\left(\mathrm{T}_{\mathrm{co}}-\mathrm{T}_{\mathrm{ci}}\right)$ (1)
Figure 2. Diesel engine cooler EGR system parts
Table 1. Dimensions of intercooler
|
no |
EGR components |
Dimensions |
|
1 |
Length of pipe |
0.295 m |
|
2 |
Inner radius of copper rod |
0.034 m |
|
3 |
Outer radius of copper rod |
0.036 m |
|
4 |
Inner radius of aluminum rod |
0.056 |
|
5 |
Outer radius of aluminum rod |
0.058m |
|
6 |
Thermal conductivity of copper |
401 W/m ℃ |
|
7 |
Thermal conductivity of aluminum |
250 W/m ℃ |
2.3 Biodiesel production
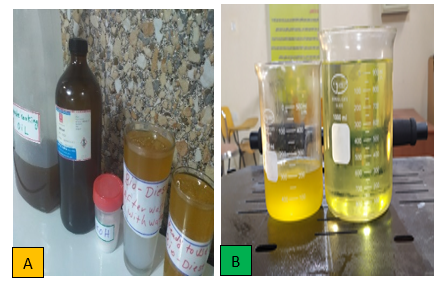
Waste cooking oil, which is collected from meals and used as a source. But using a chemical practice known as transesterification, waste cooking oils and fats are transformed from large, branching triglyceride molecules into smaller, straight-chain molecules that are nearly exactly the same size as those in conventional diesel. Methanol in the cooking oil reacts with a catalyst to produce the reaction. Acid-catalyzed transesterification is commonly agreed upon since waste vegetable oils possess extremely high levels of free fatty acids (FFA). As a consequence of the reduced FFA of the feedstock utilized in this study, the waste cooking oil was converted into an ester using the alkali catalyzed transesterification method. To dilute and eliminate humidity, the used cooking oil was heated to 75℃. Potassium methoxide was made by dissolving potassium hydroxide in methanol 25 percent, v/v oil 6:1 molar ratio and 1.5 percent, m/m oil KOH. The mixing mechanism kept the reaction at 60℃. The alcohol fraction was tweaked to get the best yield at the optimized KOH concentration. With preheated waste oil, methoxide was combined with a reaction temperature of 55℃ and a nominal stirring speed of a mechanized stirrer. The reaction took two hours to complete. Chemical reactions occur when methanol reacts with the unprocessed WCO raw material. The reaction was completed by draining and transferring the mixture to the separation funnel. It was discovered that the phase separation was split into two distinct layers in the funnel. Biodiesel made up the top layer, with glycerin at the bottom. The surplus water and methanol were finally removed by heating the methyl ester to 110℃ after it had been rinsed many times with distilled water. Sodium sulfate (Na2SO4) was used to further dry it. Finally, a high-quality filter paper was employed to remove the impurities. Figure 4 shows the collected WCO and ready-to-use biodiesel fuel. The end product was a bright yellow color. All the fuel products properties are listed in Table 3.
Figure 3. Diesel engine cooler EGR system setup
Figure 4. A-biodiesel production B-WCO biodiesel
2.4 (FTIR) spectroscopy
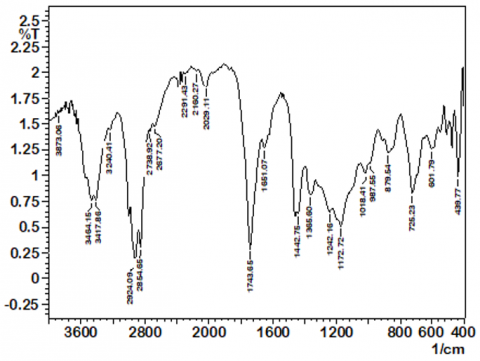
Because it is a simple and quick method of detection, FTIR is also employed to determine biofuel production. The infrared area absorbs raw oils and methyl esters very well Karthickeyan et al. [10]. As shown in Figure 5, a sample of oil and waste cooking oil methyl ester was generated and examined using FTIR. The frequency and bond type of any test are significantly associated with one another. A gain in bonding leads to an increase in the equivalent frequency. Its distinctive band includes frequency (positions) as well as vibration phase, which are provided by the functional group. The resulting spectra represents the numerous functional groups found in the material. The findings of an FTIR study of waste cooking cooling methyl ester is shown in Table 2. Its existence of an alkane group with a C-H bond type and stretch vibration is indicated by the peaks at 2924.09 and 2854.65cm-1. The presence of a carbonyl group with a C = O bond type and stretched vibration is shown by the band at 1743.65 cm-1. The peak at 1442.75 cm-1 indicates the existence of an alkane group with bending vibration in the biodiesel sample. An alkane group with bending vibration is shown by the band at 1365.60 cm-1. The existence of an alkane group with stretch vibration is indicated by the peak at 1172.72cm-1. The presence of an ester in the biodiesel sample is indicated by the band at 1018.41 cm-1. Stretching of the C-H bonds of WCOME was found using FTIR analysis.
Figure 5. FTIR spectrum of waste cooking oil methyl ester
Table 2. FTIR analysis for waste cooking oil methyl ester
|
|
Frequency range (cm-1) |
Bond type |
Type of vibration |
|
1 |
2924.09 |
C-H |
Stretch |
|
2 |
2854.65 |
C-H |
Stretch |
|
3 |
1743.65 |
C = O |
Stretch |
|
4 |
1442.75 |
-C-H |
Bending |
|
5 |
1365.60 |
-C-H |
Bending |
|
6 |
1172.72 |
C-H |
Stretch |
|
7 |
1018.41 |
C-O |
Stretch |
3.1 Diesel engine testing
The test was carried out using a variable compression ratio engine (VCR=12-18) manufactured by Kirloskar (TV1) one cylinder, 4 strokes the engine displacement volume was(661cc); bore(87.5mm), stroke(110mm) and running at constant speed 1500 rpm. Figure 6 shows the diesel engine testing that is used in current work. The rig has an eddy current dynamometer and calorimeter type pipe in pipe. A K-type thermocouple to measure engine temperature during operation, a piezoelectric transducer to measure combustion chamber gas pressure, and a data acquisition system (DAQ) to capture data from the crank angle encoder. The crank angle encoder creates values that correspond to the angle and position of the top dead center TDC during the engine cycle. Additional working characteristics, such as cooled flow of water 250 L per hour, are carried out in compliance with the design instructions. The test was carried out at 23° bTDC, 200 bar, 27℃, and 1500 rpm When carrying out the experiment, the engine is driven at idle for approximately 20 minutes to ensure stability. Figure 7 illustrates a picture of the engine arrangement. Many researchers believe installing strong magnets or magnetic conditioners in the fuel system of an ICE boosts engine performance, which helps to minimize pollutants Abdul-Wahhab et al. [11] Chen et al. [12]. One of the most common approaches would be to place magnets in the fuel pipes, directly at the front of the injectors in internal combustion engines Karthik et al. [13]. Raut et al. [14] achieved better fuel efficiency and an improvement in combustion thermal performance by using this procedure in a four-stroke and a single-cylinder diesel engine. The experimental engine's exhaust gases were permitted to enter the EGR system. The temperature of the exhaust is decreased to ambient temperature by feeding it through a cooling system and then into the suction manifold. A control valve is used to introduce a regulated rate of flow of engine exhaust and fresh air into the intake port. Eq. (2) is used to compute the percent EGR Shan et al. [15].
$\% E G R=\left[\frac{\text { volume of air without EGR - volume of air with EGR }\quad\quad}{\text { volume of air without EGR }}\right] \times 100$ (2)
3.1.1 Measurement of brake torque
The eddy dynamometer was used to measure the brake torque of (C.I. engine). The eddy current model (AG-10) make by (SAJ Test Plant Pvt. Ltd), with Air gap0.77/0.63 and applied torque 20 (N.m). A strain gauge load cell was used to evaluate the load.
Table 3. The marketing specifications of fuel
|
No |
Fuel type |
KV@40℃ Cst |
Density(kg/m3) @40℃ |
Flash point (℃) |
CN |
LCV (kj/kg) |
|
1 |
Diesel |
2.57 |
832 |
70 |
51.2 |
42.35 |
|
2 |
B10 |
3.2 |
845 |
72 |
51.8 |
41.20 |
|
3 |
B20 |
2.92 |
843 |
70 |
52.8 |
40.81 |
|
4 |
B30 |
3.21 |
848 |
72 |
53.3 |
39.85 |
|
5 |
B40 |
3.35 |
855 |
78 |
54.1 |
39.27 |
|
6 |
B100 |
4.84 |
888 |
130 |
56.2 |
37.44 |
Figure 6. Front view of the experimental set up
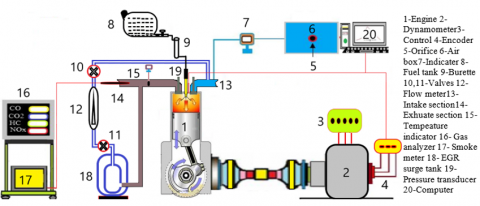
Figure 7. Schematic of the experimental setup
3.1.2 Fuel consumption
The fuel measurement system for the fuel consumption rate included a fuel tank, a differential pressure transmitter with a range of 0-500 mm WC, a fuel pipe, and a fuel glass tube. Evaluation of fuel consumption and the time it takes to consume a particular weight of fuel was calculated by the employment of the gravimetric method.
3.1.3 Air consumption
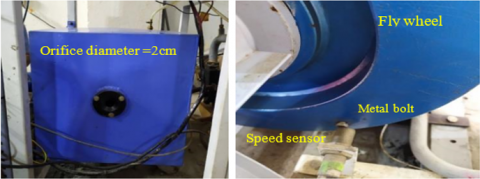
An air box was used to measure the amount of air flowing into the engine. The air box with dimensions (35x35x35cm) has an orifice with 20 mm diameter and is connected to water manometer to measure the difference in the pressure across the orifice see left image of Figure 8.
Figure 8. (left) air box and (right) engine speed sensor setup
3.1.4 Measurement of engine speed (rpm)
An inductive pick-up sensor, in conjunction with a digital rpm indicator, detects and displays the engine speed. The sensor had a 15 V DC power source and a sensing distance of 4-12 mm. It was situated near the engine flywheel, which allowed for a precise frequency response. A tiny metallic deflector was installed at the TDC location. Figure 8 on right shows an image of the photoelectric/inductive proximity pickup with a speed indicator marker and a metallic deflector.
3.1.5 Gas analyzer
The exhaust gas analyzer type EGMA (CG-450, Korea) was used to analyze the emissions of exhaust. The analyzer detects the CO-CO2-HC and NOx contents.
3.2 Data analysis
The following equations were used in calculating engine performance parameters:
1- Brake power
$\mathrm{BP}=\frac{2 \pi N T}{60 * 1000} \mathrm{~kW}$ (3)
2- Brake thermal efficiency is defined as in Eq.
$\mathrm{BTE} \%=\frac{\mathrm{BP}}{\dot{\mathrm{mf}} * \mathrm{LCV}}$ (4)
3- The brake specific fuel consumption
$\mathrm{BSFC}=\frac{\dot{\mathrm{mf}}}{\mathrm{BP}} * 3600 \frac{\mathrm{kg}}{\mathrm{kW} \cdot \mathrm{hr}}$ (5)
4- Air mass flow rate
Actual volume of air $=$ Cd. Aorf. $\sqrt{2 g \Delta h}$ (6)
The mathematical methodology, based from the first law of thermodynamics, has been used to calculate the rate of heat release at each crank angle.
$\dot{Q}=\frac{\lambda}{\lambda-1} P \frac{d V}{d \theta}+\frac{1}{\lambda-1} V \frac{d P}{d \theta}+Q_w$ (7)
3.2.1 Uncertainty analysis
Errors and uncertainty in the investigations are caused by the apparatus choice, conditions, calibration, configuration, observations, measurement, and standardized testing. Errors can slip into any study, irrespective matter how precisely it is conducted. Estimation is required to confirm the accuracy of the tests. From the main measures, the result is determined in an experiment. The following is the general formula for calculating uncertainty:
$\frac{U_y}{y}=\left[\sum_{i=1}^n\left(\frac{1}{y} \frac{\partial y}{\partial x i} U_{x i}\right)^2\right]^{1 / 2}$
Overall uncertainty of the experiment=$\left\{\mathrm{BP}^2+\mathrm{BTE}^2+\mathrm{BSFC}^2+\mathrm{CO}^2+\mathrm{CO}_2^2+\right.$ $\left.\mathrm{O}_2^2+\mathrm{UHC}^2+\mathrm{NO}_{\mathrm{X}}^2\right\}^{1 / 2}=\left\{0.1^2+0.1^2+0.1^2+0.01^2+0.1^2+0.01^2+1^2+1^2\right\}^2=\pm 1.428$.
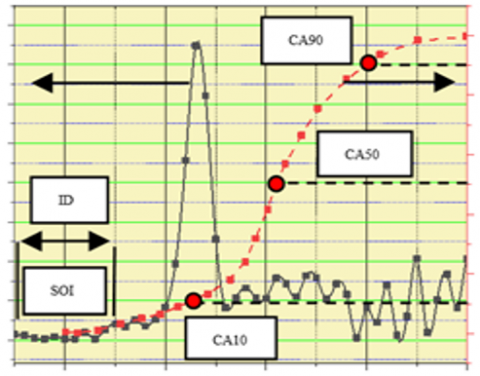
Figure 9 defines the ignition delay ID and normalized cumulative heat release versus crank angle. The determination of combustion phasing is essential while combustion is analyzed. As seen in Figure 9, ID period shows the time interval between the start of injection (SOI) that original injection timing of the test engine and start of combustion (SOC). SOC is determined versus crank angle where the heat release reaches to the positive value. When cumulative heat release is normalized between 0 and 1, it gives information about the combustion stages. CA10, CA50 and CA90 refer the crank angle where 10%, 50% and 90% of charge mixture completed to burn. At this point, CA10, CA50 and CA90 can be determined using normalized cumulative heat release. Combustion duration was assumed the time interval between CA10 and CA90 in this study. Cumulative heat release is obtained with the sum of consecutive heat release rate values versus crank angle. Cumulative heat release shows the combustion stages of charge mixture.
Figure 9. Definition of ID and normalized cumulative heat release versus crank angle
Through the use of the Taguchi technique of optimization, this study will determine the key factors which can impact BTE and the ideal fuel magnetizer settings in diesel engine. The Taguchi technique is a straightforward method for reducing the number of trials required to optimize model parameters. The number of tests necessary for the experiment is determined by the number of parameters included in the experiment. The number of parameters increased, resulting in more trials and a longer time to finish the experiment. This approach uses an orthogonal array to examine the full parameter space George et al. [16]. Table 4 shows the parameters of the L16 in a row (1, 2, 3, 4, and 5) as demonstrated in compression ratio, injection pressure bar, magnetic intensity Gauss, engine load %, and injection timing degree bTDC. The Figure 10 explains the selected design parameters and the limitation of variance values.
Figure 10. Selected design parameters A-VCR B-IP changing C-M range D-TI setting
Table 4. Practical variables and their levels
|
Parameters |
L1 |
L2 |
L3 |
L4 |
|
CR |
15 |
16 |
17 |
18 |
|
IP |
175 |
200 |
225 |
250 |
|
M |
4000 |
6000 |
8000 |
12000 |
|
L% |
25 |
50 |
75 |
100 |
|
TI |
19 |
21 |
23 |
27 |
6.1 Optimization of diesel fuel magnetizer
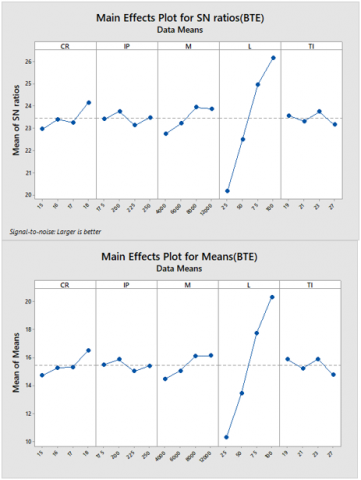
The brake thermal efficiency was analyzed and used as a response variable during experiments. S/N is a critical metric for evaluating product quality. Figure 11 demonstrates how the best signal-to-noise ratio was used in this research investigation. Table 5 shows the findings of the analysis of the engine's performance.
6.2 Model summary
The predicted mathematical models for the dependent variable BTE as a function of compression ratio, injection pressure, magnetic field, load, and injection timing were developed using linear regression analysis in the Minitab 18.0 software package. Eq. (3) for BTE shows the prediction equation derived from the regression analysis.
Table 5. S/N ratios of brake thermal efficiency
|
CR |
IP |
M |
L |
TI |
BTE Experimental |
S/N(BTE) |
Predicted |
RESI |
|
15 |
175 |
4000 |
25 |
19 |
9.010 |
19.0945 |
9.2508 |
-0.24077 |
|
15 |
200 |
6000 |
50 |
21 |
12.510 |
21.9451 |
12.8021 |
-0.29207 |
|
15 |
225 |
8000 |
75 |
23 |
17.720 |
24.9693 |
16.3534 |
1.36664 |
|
15 |
250 |
12000 |
100 |
27 |
19.597 |
25.8438 |
20.1105 |
-0.51350 |
|
16 |
175 |
6000 |
75 |
27 |
16.542 |
24.3718 |
16.2375 |
0.30450 |
|
16 |
200 |
4000 |
100 |
23 |
20.040 |
26.0380 |
19.6007 |
0.43933 |
|
16 |
225 |
12000 |
25 |
21 |
10.120 |
20.1036 |
11.0610 |
-0.94101 |
|
16 |
250 |
8000 |
50 |
19 |
14.300 |
23.1067 |
13.7712 |
0.52879 |
|
17 |
175 |
8000 |
100 |
21 |
20.690 |
26.3152 |
21.3326 |
-0.64260 |
|
17 |
200 |
12000 |
75 |
19 |
19.170 |
25.6524 |
18.8473 |
0.32272 |
|
17 |
225 |
4000 |
50 |
27 |
11.230 |
21.0076 |
12.6677 |
-1.43769 |
|
17 |
250 |
6000 |
25 |
23 |
10.110 |
20.0950 |
9.9765 |
0.13347 |
|
18 |
175 |
12000 |
50 |
23 |
15.660 |
23.8958 |
15.5931 |
0.06688 |
|
18 |
200 |
8000 |
25 |
27 |
11.750 |
21.4008 |
10.7195 |
1.03052 |
|
18 |
225 |
6000 |
100 |
19 |
20.990 |
26.4402 |
21.4429 |
-0.45293 |
|
18 |
250 |
4000 |
75 |
21 |
17.550 |
24.8855 |
17.2223 |
0.32774 |
Figure 11. Response graph for orthogonal experiments
BTE=-0.24 + 0.538 CR - 0.00444 IP + 0.000215 M + 0.13826 L - 0.1118 TI (8)
$\mathrm{R}^2=97.05 \%$
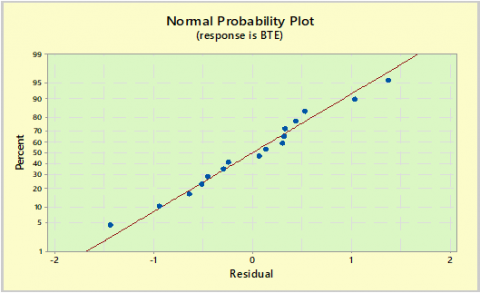
The R2 coefficient of determination was used to test the capabilities of the created models. The value of the coefficient of determination ranges from zero to one. If it's near to one, it suggests that the dependent and independent variables are well-matched. All the constructed regression models for BTE in this investigation had excellent R2 values, at 97.05%, and $\mathrm{R}^2($ adj $)=95.57 \%$. The coefficients in the projected model were checked for significance using the graph. Whereas if the residual plot is a straight line, the model's residual errors are normally distributed as well as the coefficients remain significant. Figure 12 depicts the residual plots derived for BTE. It has been shown that the residuals BTE is close to the straight line, implying that the produced model coefficient approaches are significant. In statistics, an F-test, called after Fisher, is used to determine the significance of variation on the output characteristic Yang and Tarng [17]. With F>3.41, it typically indicates that changing a design parameter has a considerable impact on the output characteristic. The calculated F value was compared to the critical value, and it was discovered that magnetic field intensity had a considerable impact on BTE, F=8.37>>3.41. The optimum factors gained from the response diagram is recorded in Table 6.
Table 6. Optimum points for BTE
|
Parameters |
Value |
|
Compression ratio |
18 |
|
Injection pressure |
200 bar |
|
Magnetic field |
8000 Gauss |
|
Engine load |
100% |
|
Timing of injection |
23° b TDC |
Figure 12. Normal probability plot of the residuals for BTE
7.1 Ignition delay period (ID)
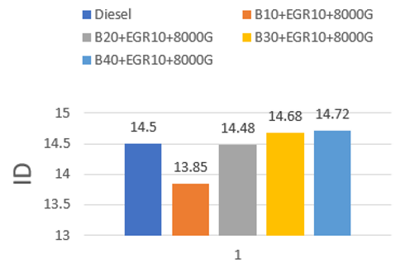
The ignition timing of a diesel engine is primarily determined by the fuel type, the mixture quantity, as well as the related temperature and pressure conditions. The study found that prolonging the initiation of combustion and lengthening the ignition delay period with EGR application could be caused by heat and dilution effects associated with slower chemical reactions. As illustrated in Figure 13 the durations of the ID periods were longer, particularly at B40, with the effect of EGR application becoming more obvious as engine load increased. The compositions of EGR, primarily CO2 and H2O, were raised concurrently with the engine load, and thermal effects were detected in addition to the drop in O2 concentration. Additionally, the EGR was introduced, lowering the air-to-fuel ratio and oxygen concentration of mixes while increasing the inert gas level, potentially increasing the ignition delay. The ignition delay period for B10, B20, DF, B30, B40 percent BTDC was 13.85o, 14.48o, 14.5o, 14.55o, and 14.72o for B10, B20, DF, B30, and B40 percent bTDC. The ignition delay period is shortest for B10+EGR10+8000 Gauss blended fuel, whereas the largest delay is seen for high viscosity, density, and low heating value fuel mixtures (i.e. B40+EGR10+8000Gauss). Mei et al. [18] obtained similar findings, indicating that even without EGR, mixture ignition would occur fairly late.
Figure 13. Effect of biodiesel blends ratio EGR 10% with 8000Gauss on ignition delay period
7.2 Mass fraction
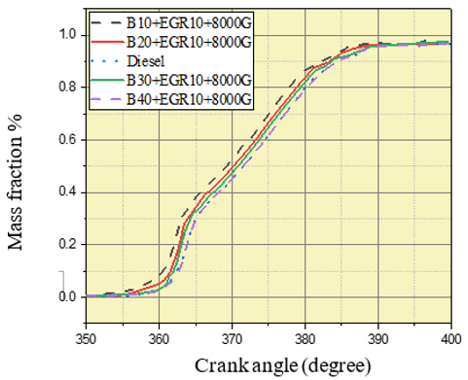
The addition of biofuel to the blended fuels B10, and B20 indicates a shortening of the ignition delay and pushing combustion to an earlier stage. The dual effect of the EGR rate and polarization on the biofuel mixture leads to a higher burning rate. As can be seen in Figures 14 and 15, the general combustion period increases from CA10 to CA90 for both B30, and B40 blended due to the higher droplets sizes that result in poorer combustion. Grech et al. [19] found that the Sauter mean diameter of sprays with biodiesel blended-fuel is rises. Values for volume mean diameter and arithmetic mean diameter increase as well with the blending ratio. As the biodiesel mix ratio rises, the kinematic viscosity and surface tension rise with it, the more difficult it is for a droplet to vaporize. On other hand, burning durations for fuel mass fractions of 0–10% and 0–50% are reduced when B10 and B20 due to rapid burning throughout the premixed phase of combustion until the crank angle of the 50% burn level is reached. The burn period of fuel mass fraction CA50 a TDC was 9.6° in the case of B10+EGR10+8000Gauss and 11.5° in the case of B40+EGR10+8000Gauss. In other words, at the very same angle, the engine consumed approximately 50% of fuel in the case of B10 and approximately 40% in the case of B40 at the same EGR rate and dipole condition density. Increased the WCO biofuel percentage, thus longer combustion period predicted due to lower evaporation related to higher viscosity biodiesel fuels, but also because of the reduced oxygen content in the cylinder and slowdown of combustion reactions caused by the EGR implementation. As previously stated, the rise in EGR rates results in a delay in the beginning of combustion of biodiesel fuel blends, a pattern observed by Horn et al. [20] Li et al. [21], and Ladommatos et al. [22].
Figure 14. Effect of biodiesel blends ratio, EGR 10% and 8000Gauss
7.3 Heat released rate (J/℃ A)
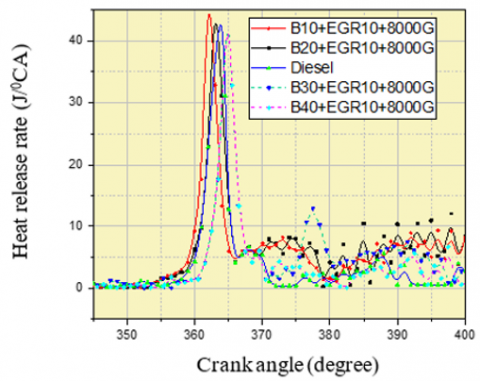
The net heat release rate data of 100 consecutive cycles are recorded and averaged for each intensity of magnetic fields under the combined impact of magnetization pattern and EGR plotted with comparison to the baseline diesel engine heat release data. The comparison of net heat release rate characteristics of combustion under biodiesel blends for an engine speed of 1500 rpm is shown in Figure 16. It can be observed that the heat release rate initially decreases until the start of combustion from which it increases until the point where maximum combustion is achieved and then further decreases. As the biodiesel ratio is increased in stages, the heat release also decreases slightly under combined influenced of EGR and fuel opalization. The maximum magnitude of heat release is observed under B10+EGR10+8000 Gauss field where the fuel is under optimum polarized the maximum value of biodiesel heat release rate (44.9, 42.9, 42, 41.4 and 39.9 J/℃A). While the corresponding $\theta\, \mathrm{HRR}_{\max}\, 2.85^{\circ}, 3.68^{\circ}, 3.9^{\circ}, 4.17^{\circ}$, and 5.01° a TDC for B10, B20, DF, B30, and B40 respectively.
Figure 15. Effect of biodiesel blends ratio with different EGR rate at 8000Gauss
Figure 16. Effect of biodiesel blends ratio and EGR10% with 8000Gauss on maximum heat release rate (J/℃A)
7.4 Engine cylinder pressure P-θ diagram
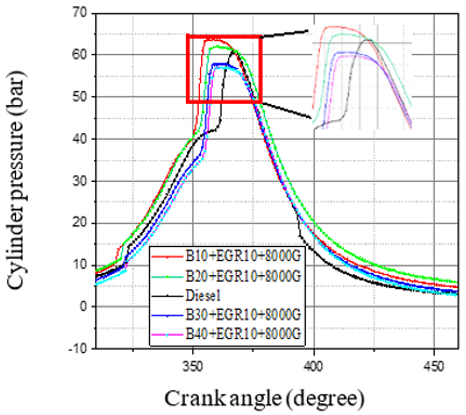
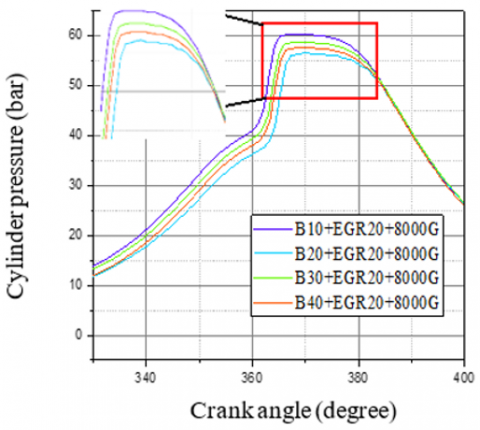
Figures 17 and 18 illustrate how the pressure inside the cylinders changes when the engine is running at maximum power with diesel and B10, B20, B30, and B40. Combustion characteristics can be precisely determined via in-cylinder pressure analysis. This data is estimated and shown as a relationship between crank angle positions in order to find the average value of the pressure data across 100 consecutive cycles. During the magnetic polarity combustion at 8000 Gauss magnetic flux, the average pressure is shown and compared to the base diesel engine measured data for a more meaningful estimation. The following graph compares the in-cylinder pressures at 1500 rpm, B10 and B20 are preferable since they have higher oxygen content and therefore have a higher cetane index if compared with diesel fuel. Thus, appropriate atomization, vaporization, and complete combustion are all achieved. The maximum Pmax value for diesel fuel is 58.224 bar and the angle corresponding to Pmax is 2.650 a TDC, while 63.232 and 61.0859 and 57.89 and 56.82 bar for B10 and B20 and B30 and B40, respectively. Can et al. [23] found that by using a soybean biodiesel fuel blend (B20) with an exhaust gas radiator EGR improved in-cylinder pressure. It was discovered by Uyumaz [24] that using a mustard oil biodiesel blend M20, M30with a modest engine load led to greater in-cylinder pressure and heat release. Panneerselvam et al. [25] found that Pine oil biodiesel increased peak pressure compared to diesel. Increasing the amount of bio diesel with acceptable range also boosts mechanical efficiency, according to Govindasamy and Dhandapani [26]. Mechanical efficiency increased by 13% when using EGR. Increasing the percentage of biodiesel to diesel at full load reduced in-cylinder pressure and the EGR rate because the density of the fuel was higher and there was more mass injected. As a result, vegetable oil typically contains components with higher boiling temperatures than diesel, Murayama et al. [27] and Ryan and Bagby [28] found that as molecular mass increases, so does the heating value of a fuel, becoming lower. When bio diesel fuel mixes are 30 and 40 and EGR is increased to 20%, the delay period of combustion is clearly shown in Figure 18 becomes longer, due to the flame temperature decreasing, and thus the temperature inside the combustion chamber decreasing. As a result of the high mix ratio, fuel burns at a slower rate. Decreased in-cylinder pressure results in decreased indicated power and engine thermal efficiency, in the case of the B30 and B40 Tziourtzioumis and Stamatelos [29].
Figure 17. Effect of biodiesel blends ratio, EGR10% with 8000Gauss on engine cylinder pressure (bar) P-θ diagram
Figure 18. Effect of biodiesel blends ratio, EGR20% with 8000Gauss on engine cylinder pressure(bar) P-θ diagram
Figure 19 demonstrates the connection between cylinder pressure and biofuel content, the results collected while the engine was under dual impact EGR, and the optimum value of magnetic flux was 8000 Gauss under full load condition. As the flame imitates and continues to grow and extend throughout the cylinder chamber, the cylinder pressure raises more in cases B10 than for diesel or other waste cooking oil biodiesel. The maximum cylinder pressure typically occurs a TDC, and after it begins to degrade as the cylinder volume continues to expand during the adiabatic expansion. For mixtures containing more than 10% EGR, the cylinder pressure changes as a result of the change in combustion velocity, which results in a deterioration in cylinder pressure.
Figure 19. Effect of biodiesel blends ratio with different EGR rate at 8000Gauss
7.5 Pressure-volume P-V diagram
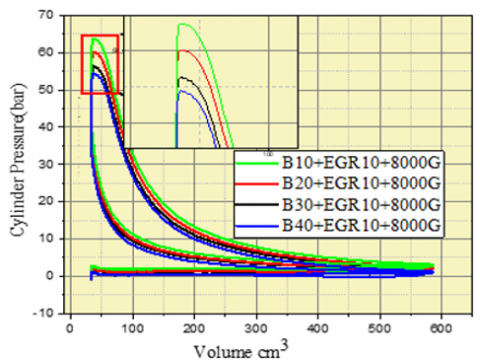
Figure 20. Effect of biodiesel blends ratio, EGR rate 10% with 8000Gauss on P-V diagram
Figure 20 shows the effect of biodiesel blends ratio, 10% EGR rate with 8000Gauss on P-V diagram by looking at how biofuel impacts in-cylinder pressure and heat release rate in various operating modes, this study hopes to learn more about how it works. In addition, the values of different parameters optimum of magnetic field flux, EGR rate, and fuel type were evaluated and recorded to help explain the reported patterns. Also Figure 20 shows a comparison of the P–V graphs for B10, B20, B30, and 40% at an EGR rate of 10% and 8000Gauss. In comparison to B20, 30 and 40%, B10 has a higher pressure difference. These discrepancies show that B10+EGR10+8000Gauss has sufficient thermal energy to generate high cylinder pressure. This is due to the fact that more fuel blends' energy is transported out of the system as work throughout top isentropic processes than other blended fuels. Yasin et al. [30] identified those criteria to describe the various fuel combustion characteristics during the combustion phase. As a result, it's safe to say that the various fuel qualities tested produce a wide range of diverse combustion outcomes Akasyah et al. [31].
7.6 Brake thermal efficiency (BTE%)
Figure 21. Effect of biodiesel blends ratio EGR 10%with 8000Gauss on BTE%
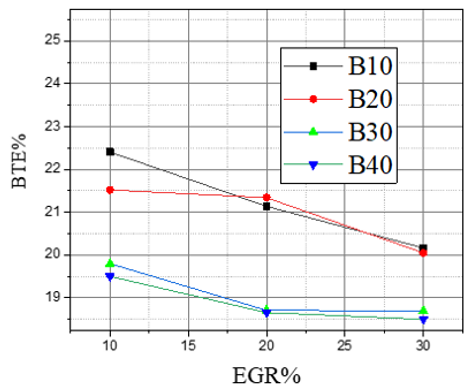
Figure 22. Effect of biodiesel blends ratio EGR rate % and 8000Gauss on BTE
The Figure 21 illustrates the influence of biofuel blend ratio on BTE, at constant EGR rate of 10% while; the magnetic flux is kept at 8000 Gauss. The results suggest that B10 and B20 percent blended have a higher BTE over fossil diesel, and that the maximum inhibition efficiency for blending and fuel base engines (i.e.) B10+EGR10 percent +8000 Gauss, B20+EGR10% +8000 Gauss, and DF are 23.63, 22.058, and 21.01, respectively. According to Özener et al. [32], bio diesel has a high cetane number if compared to diesel fuel, according to Özener et al. [32] Gürü et al. [33] and Gomaa et al. [34] reported the same results in a short delay period, which results in a good fuel–air mixture buildup, less immediate combustion and therefore a higher BTE. Additionally, the optimum magnetic treatment fractures the hydrocarbon chains, lowering their surface tension and density, fine fuel droplets are injected during the combustion chamber's injection period. The aforementioned features result in improved air-fuel mixing and oxidation in the engine combustion chamber. By incorporating these features, the ignition delay period is reduced, the fuel is entirely consumed, and the engine output is smoother. The engine is equipped with an EGR system, which aids in increasing the in-cylinder charge mass, resulting in complete combustion at greater loads. Additionally, EGR is at a slightly higher pressure than atmospheric, which may have resulted in lower pumping losses and an increase in BTE. Gomaa et al. [34] found that at 10-15% EGR, Jatropha 20 improved BTE by 4.6 percent when compared to diesel engines. Gumus [35] proved that the BTE of all test fuels improved with mild EGR. Ramadhas et al. [36] Jumaa and Mashkour et al. [37] and Bedar et al. [38] all indicated that utilizing 20% waste cooking oil biodiesel increases the engine's braking thermal efficiency by 12.75 percent. When compared to the standard engine, BTE was increased by 12.5 percent in this work. When the EGR rate exceeded 20%, the BTE began to decline linearly. That phenomenon becomes conceivable because the incoming charge is diluted with engine exhaust elements, resulting in a reduced flame velocity and incomplete burning of the fuel. At 30% EGR, the BTE of B30 and B40 was reduced by 9% and 10%, correspondingly, when compared to the diesel fuel value. The reduction in BTE with increasing the EGR rate is summarized in Figure 22.
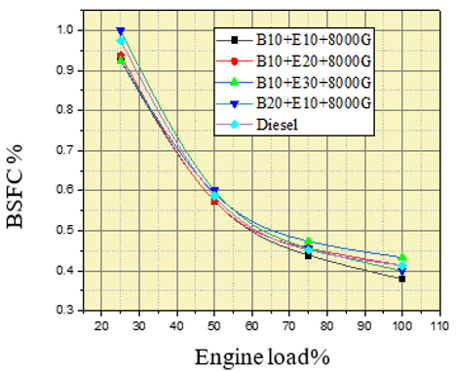
7.7 Brake specific fuel consumption
Figure 23 depicts a comparison of brake specific fuel consumption with variations in diesel engine brake power. Both diesel and biofuel were exposed to the same dipole strength of 8000 Gauss. The graph illustrates that when the combined impact of EGR rate and magnetic conditioning was used, the BSFC of blended fuel was lower than unconditioned diesel at various brake powers, as expected. When the EGR rate is set to 10%, the brake specific fuel consumption is reduced by approximately 12.9% when compared to the base engine. According to Jumaa and Mashkour [37] BSFC for DF+20 percent waste cooking oil is reduced by 8.1 percent, according to Gumus [35] According to Sunil Naik and Balakrishna [39], BSFC decreased with biofuel blending of B10 and B20 and an EGR rate of 10-20%. When compared to traditional diesel fuel, biofuel has a lower BSFC.
7.8 Volumetric efficiency
Figure 23. Effect of biodiesel blends ration BSFC
Figure 24 shows the variation in volumetric efficiency with biodiesel percent at constant EGR rate of 10%, and 8000 Gauss on the left and engine load on the right. The volumetric efficiency declines as the biodiesel vol/vol) percentage and engine load rise. The amount of air replenished by cooled exhaust gas recirculation decreases the amount of air flowing into the inlet manifold, the diesel engine has a high volumetric efficiency when compared to all biofuels. As the ratio of biofuels increases, the amount of fuel injected into the combustion chamber increases, resulting in a lower air–fuel ratio for WCO Yu et al. [40]. Is similar to those reported by Hira et al. [9] when a 20% blend of Karanja biodiesel and diesel is used.
Figure 24. Effect of biodiesel blends ratio on volumetric efficiency
It is determined that now the employment of EGR with biodiesel fuels as well as the magnetic fuel treatment system for diesel is more successful in producing enhanced engine characteristics. The following conclusions were made from the test findings:
Taguchi method determined optimal BTE conditions for obtaining the highest diesel engine design parameters compression ratio, injection pressure, magnetic conditioner intensity, load, and timing injection, also fisher value proved that the BTE significantly affected by the magnetic field.
The engine's brake thermal efficiency is higher when using bio fuel than when using ordinary diesel fuel, when the percentage of bio diesel rises, until it reaches 20%. When EGR (10-20%) was used, BTE increased by 12.5%. A significant increase in the value of the peak pressure value when WCO operate under combined impact of EGR and optimal polarization intensity.
There had been a drop in BSFC when EGR was used, with various bio diesel (10-20%) mixes. A magnetic field could be used to boost the internal energy of the fuel, causing precise modifications at the molecular level. Increasing internal energy results in easier burning. The molecules fly apart more easily, connect to oxygen more easily, and burn more readily. The conditioned fuel that results is magnetic to burn more thoroughly, resulting in increased engine output, better gas mileage, more power, and, most crucially.
|
a TDC |
After top dead center |
|
B10,20,30,40 |
Biodiesel 10, 20, 30, and 40 |
|
BSFC |
Brake specific fuel consumptions |
|
b TDC |
Before top dead center |
|
BTE |
Brake thermal efficiency |
|
MFC |
Magnetic fuel conditioner |
|
CR |
Compression ratio |
|
DF |
Diesel fuel |
|
EGR |
Exhausted gas recirculation |
|
FTIR |
Fourier Transform Infrared spectroscopy |
|
ID |
Ignition delay |
|
IP |
Injection pressure |
|
TI |
Timing of injection |
|
NdFeB |
Neodymium Iron Boron Magnets |
|
y |
certain parameter that is dependent (xi) factor |
|
Uy |
Uncertainties in y |
|
VCR |
Variable compression ration |
|
WCO |
Waste cooking oil |
|
Greek symbols |
|
|
$\eta_m$ |
engine mechanical efficiency |
|
$\theta$ |
Crank angle (degree) |
|
Subscripts |
|
|
C |
cold |
|
h |
hot |
[1] Zheng, M., Reader, G.T., Hawley, J.G. (2004). Diesel engine exhaust gas recirculation-a review on advanced and novel concepts. Energy Conversion and Management, 45(6): 883-900. https://doi.org/10.1016/S0196-8904(03)00194-8
[2] Kumar, A.R., Raju, G.J. (2021). Experimental Investigation of a magnetic fuel ionization method in a DI Diesel Engine to Improve the Performance and Emissions. In Journal of Physics: Conference Series, 1817(1): 012028. https://doi.org/10.1088/1742-6596/1817/1/012028
[3] Du, E., Tang, H., Huang, K., Tao, R. (2011). Reducing the viscosity of diesel fuel with electrorheological effect. Journal of Intelligent Material Systems and Structures, 22(15): 1713-1716. https://doi.org/10.1177/1045389X11421819
[4] Elamin, A.A., Ezeldin, M., Masaad, A.M., Suleman, N.M. (2015). Effect of magnetic field on some physical characteristics and cetane number of diesel fuel. American Journal of Applied Chemistry, 3(6): 212-216.
[5] Hassan, M.K., Aris, I., Mahmod, S., Sidek, R. (2009). An experimental result of exhaust emission concentration relative to various injection timing of CNG fuelled direct injection engine. European Journal of Scientific Research, 25(3): 405-416.
[6] Wang, S.W., Yu, D.L., Gomm, J.B., Page, G.F., Douglas, S.S. (2006). Adaptive neural network model based predictive control for air-fuel ratio of SI engines. Engineering Applications of Artificial Intelligence, 19(2): 189-200. https://doi.org/10.1016/j.engappai.2005.08.005
[7] Abd-Alla, G.H. (2002). Using exhaust gas recirculation in internal combustion engines: a review. Energy Conversion and Management, 43(8): 1027-1042. https://doi.org/10.1016/S0196-8904(01)00091-7
[8] Govindasamy, P., Dhandapani, S. (2007). Combustion enhancement and emission reduction of bio-diesel uses EGR and magnetic fuel. Erode, Tamilnadu: Kongu Engineering College 2007; 638052.
[9] Hira, J., Sharma, R., Kamboj, K., Kumar, V., Sharma, P. (2019). NOx emission reduction in diesel engine through developed cooled EGR setup. In Advances in Interdisciplinary Engineering, Singapore, pp. 1-13. https://doi.org/10.1007/978-981-13-6577-5_1
[10] Karthickeyan, V., Balamurugan, P., Ramalingam, S. (2016). Studies on orange oil methyl ester in diesel engine with hemispherical and toroidal combustion chamber. Thermal Science, 20(4): 981-989.
[11] Abdul-Wahhab, H.A., Al-Kayiem, H.H., Aziz, A.R.A., Nasif, M.S. (2017). Survey of invest fuel magnetization in developing internal combustion engine characteristics. Renewable and Sustainable Energy Reviews, 79: 1392-1399. https://doi.org/10.1016/j.rser.2017.05.121
[12] Chen, C.Y., Lee, W.J., Mwangi, J.K., Wang, L.C., Lu, J.H. (2017). Impact of magnetic tube on pollutant emissions from the diesel engine. Aerosol and Air Quality Research, 17(4): 1097-1104. https://doi.org/10.4209/aaqr.2016.11.0478
[13] Karthik, N., Xavier, X.G., Rajasekar, R., Bairavan, P.G., Dhanseelan, S. (2017). Experimental investigation of performance and emission characteristics of various nano particles with bio-diesel blend on di diesel engine. In IOP Conference Series: Materials Science and Engineering, 197(1): 012014. https://doi.org/10.1088/1757-899X/197/1/012014
[14] Raut, M.S., Uparwat, S.S., Nagarale, C. (2017). Experimental inspection by using the effect of magnetic field on the performance of diesel engine. International Research Journal of Engineering and Technology (IRJET), 4(3): 2191-2194.
[15] Shan, X., Qian, Y., Zhu, L., Lu, X. (2016). Effects of EGR rate and hydrogen/carbon monoxide ratio on combustion and emission characteristics of biogas/diesel dual fuel combustion engine. Fuel, 181: 1050-1057. https://doi.org/10.1016/j.fuel.2016.04.132
[16] George, P.M., Pillai, N., Shah, N. (2004). Optimization of shot peening parameters using Taguchi technique. Journal of Materials Processing Technology, 153: 925-930. https://doi.org/10.1016/j.jmatprotec.2004.04.159
[17] Yang, W.P., Tarng, Y.S. (1998). Design optimization of cutting parameters for turning operations based on the Taguchi method. Journal of Materials Processing Technology, 84(1-3): 122-129. https://doi.org/10.1016/S0924-0136(98)00079-X
[18] Mei, D., Qian, J., Sun, P., Miao, Y., Zhang, S., Cai, Y. (2012). Study on the combustion process and emissions of a turbocharged diesel engine with EGR. Journal of Combustion, 932724. https://doi.org/10.1155/2012/932724
[19] Grech, N., Mehdi, A., Zachos, P.K., Pachidis, V., Singh, R. (2012). Effect of combustor geometry on performance of Airblast atomizer under sub-atmospheric conditions. Engineering Applications of Computational Fluid Mechanics, 6(2): 203-213. https://doi.org/10.1080/19942060.2012.11015415
[20] Horn, U., Egnell, R., Johansson, B., Andersson, Ö. (2007). Detailed heat release analyses with regard to combustion of RME and oxygenated fuels in an HSDI diesel engine. SAE Transactions, 464-482.
[21] Li, X., Xu, Z., Guan, C., Huang, Z. (2014). Impact of exhaust gas recirculation (EGR) on soot reactivity from a diesel engine operating at high load. Applied Thermal Engineering, 68(1-2): 100-106. https://doi.org/10.1016/j.applthermaleng.2014.04.029
[22] Ladommatos, N., Abdelhalim, S., Zhao, H. (1998). Control of oxides of nitrogen from diesel engines using diluents while minimising the impact on particulate pollutants. Applied Thermal Engineering, 18(11): 963-980. https://doi.org/10.1016/S1359-4311(98)00031-3
[23] Can, Ö., Öztürk, E., Solmaz, H., Aksoy, F., Çinar, C., Yücesu, H.S. (2016). Combined effects of soybean biodiesel fuel addition and EGR application on the combustion and exhaust emissions in a diesel engine. Applied Thermal Engineering, 95: 115-124. https://doi.org/10.1016/j.applthermaleng.2015.11.056
[24] Uyumaz, A. (2018). Combustion, performance and emission characteristics of a DI diesel engine fueled with mustard oil biodiesel fuel blends at different engine loads. Fuel, 212: 256-267. https://doi.org/10.1016/j.fuel.2017.09.005
[25] Panneerselvam, N., Ramesh, M., Murugesan, A., Vijayakumar, C., Subramaniam, D., Kumaravel, A. (2016). Effect on direct injection naturally aspirated diesel engine characteristics fuelled by pine oil, Ceiba pentandra methyl ester compared with diesel. Transportation Research Part D: Transport and Environment, 48: 225-234. https://doi.org/10.1016/j.trd.2016.08.023
[26] Govindasamy, P., Dhandapani, S. (2009). Effects of EGR & magnetic fuel treatment system on engine emission characteristics in a bio fuel engine. In Proceedings of the International Conference on Mechanical Engineering. Bangladesh, pp. 26-28.
[27] Murayama, T., Fujiwara, Y., Noto, T. (2000). Evaluating waste vegetable oils as a diesel fuel. Proceedings of the Institution of Mechanical Engineers, Part D: Journal of Automobile Engineering, 214(2): 141-148. https://doi.org/10.1177/095440700021400203
[28] Ryan III, T.W., Bagby, M.O. (1993). Identification of chemical changes occurring during the transient injection of selected vegetable oils. SAE Transactions, 102(3): 1440-1449.
[29] Tziourtzioumis, D.N., Stamatelos, A.M. (2017). Experimental investigation of the effect of biodiesel blends on a DI diesel engine’s injection and combustion. Energies, 10(7): 970. https://doi.org/10.3390/en10070970
[30] Yasin, M.M., Yusaf, T., Mamat, R., Yusop, A.F. (2014). Characterization of a diesel engine operating with a small proportion of methanol as a fuel additive in biodiesel blend. Applied Energy, 114: 865-873. https://doi.org/10.1016/j.apenergy.2013.06.012
[31] Akasyah, M.K., Mamat, R., Abdullah, A., Aziz, A., Yassin, H.M. (2015). Effect of ambient temperature on diesel-engine combustion characteristics operating with alcohol fuel. International Journal of Automotive & Mechanical Engineering, 11: 2373-2382. http://dx.doi.org/10.15282/ijame.11.2015.18.0199
[32] Özener, O., Yüksek, L., Ergenç, A.T., Özkan, M. (2014). Effects of soybean biodiesel on a DI diesel engine performance, emission and combustion characteristics. Fuel, 115: 875-883. https://doi.org/10.1016/j.fuel.2012.10.081
[33] Gürü, M., Koca, A., Can, Ö., Çınar, C., Şahin, F. (2010). Biodiesel production from waste chicken fat based sources and evaluation with Mg based additive in a diesel engine. Renewable Energy, 35(3): 637-643. https://doi.org/10.1016/j.renene.2009.08.011
[34] Gomaa, M., Alimin, A.J., Kamarudin, K.A. (2011). The effect of EGR rates on NOX and smoke emissions of an IDI diesel engine fuelled with Jatropha biodiesel blends. International Journal of Energy and Enviroment, 2(3): 477-490.
[35] Gumus, M. (2008). Evaluation of hazelnut kernel oil of Turkish origin as alternative fuel in diesel engines. Renewable Energy, 33(11): 2448-2457. https://doi.org/10.1016/j.renene.2008.02.005
[36] Ramadhas, A.S., Jayaraj, S., Muraleedharan, C. (2010). Performance and emission studies on biodiesel-liquefied petroleum gas dual fuel engine with exhaust gas recirculation. Journal of Renewable and Sustainable Energy, 2(1): 013109. https://doi.org/10.1063/1.3302019
[37] Jumaa, H., Mashkour, M.A. (2021). The effect of variable engine parameters on performance and emissions of DI diesel engine running on diesel-biodiesel blended with nano additives. In IOP Conference Series: Materials Science and Engineering, 1094(1): 012122. https://doi.org/10.1088/1757-899X/1094/1/012122
[38] Bedar, P., Pandey, J.K., Kumar, G.N. (2016). Effect of exhaust gas recirculation (EGR) on diesel engine using Simarouba glauca biodiesel blends. International Energy Journal, 15(2): 73-82.
[39] Sunil Naik, N., Balakrishna, B. (2018). Effects of EGR on performance and emissions of a diesel engine fuelled with balanites aegyptiaca/diesel blends. International Journal of Sustainable Engineering, 11(3): 150-158. https://doi.org/10.1080/19397038.2017.1386246
[40] Yu, C.W., Bari, S., Ameen, A. (2002). A comparison of combustion characteristics of waste cooking oil with diesel as fuel in a direct injection diesel engine. Proceedings of the Institution of Mechanical Engineers, Part D: Journal of Automobile Engineering, 216(3): 237-243. https://doi.org/10.1243/0954407021529066