Sherin Sam Jose* | Ramesh Kumar Chidambaram
© 2021 IIETA. This article is published by IIETA and is licensed under the CC BY 4.0 license (http://creativecommons.org/licenses/by/4.0/).
OPEN ACCESS
In automobiles, the demand for HVAC has been rising for decades and the key variables that affect the thermal comfort in a car were identified as air velocity, temperature, radiant temperature, and relative humidity. Thermal comfort estimation in a vehicle depends on the transient behavior of the cabin space and boundaries. The predicted mean vote (PMV) and predicted percentage of dissatisfied (PPD) are the available methods to describe and optimize thermal comfort in cabin space. In this paper, the cabin thermal comfort of a minivan was analyzed for reduction of energy consumption with the help of experimental and numerical simulation. Using CFD simulation and validation with experimental data, the flow dynamics inside a vehicle cabin is evaluated based on air velocity, temperature, and comfort indices. With some error for the extreme planes, a strong agreement was reached between the experimental values and the CFD model. With the reduction in the air velocity from 2.3 m/s to 1.3 m/s, the average power required to run the blower can be reduced by 43%, providing an advantage of reducing the capacity of the compressor. The higher PPD values were observed on the walls of the cabin and at the outlet of the AC vents.
thermal comfort, optimisation, electric vehicle, CFD simulation, PMV, PPD
The global automotive sector witnessed a major shift from IC engine technology to electric vehicle technology to tackle global warming, vehicle exhaust emission, and depleting fossil fuel reserves. Electric vehicles were identified to be 75 to 80% efficient when compared with conventional IC engines which are around 25 to 30% efficient. A major investment in research had been diverted to EV-based research in the automobile industry. The majority of the research in the electric vehicle domain focuses on energy storage (Battery) and powertrain technology (Motors and Drive Electronics) for improving the performance of EVs. Passengers give predominant importance to comfort and safety which require additional electrical accessories [1]. Thermal comfort is observed to be playing a major role in the comfort of passengers. In conventional IC engine-powered vehicles, the required energy for heating or cooling of the passenger cabin is provided by the engine, whereas in EV, battery power is being used for heating and cooling, which consumes 30 to 50% of battery power [2-6]. It was observed that heating consumes more power when compared to cooling. There is a noticeable drop in the range of the EV due to consumption energy by the HVAC system. Therefore, electric and hybrid vehicles require an energy-efficient approach in the design of air conditioning systems [7]. Current systems control the temperature of the vehicle cabin alone, while thermal comfort depends on other factors such as radiant heat and airflow [8-10].
Thermal comfort is the condition of the mind that expresses satisfaction with the surrounding environmental conditions [8, 11, 12]. Thermal comfort in an EV can be achieved by optimizing the heating, ventilation, and air conditioning (HVAC) components. Thermal load reduction and the design of climate control will create a positive impact on occupant comfort [13]. The main factors affecting thermal comfort are ambient temperature, air velocity, relative humidity, and radiant temperature. The relative humidity is directly connected to the air temperature, which is one of the key factors influencing thermal comfort. Comfort can be ensured by the proper control of relative humidity within a stipulated range. Relative humidity in the cabin space is the major contributing factor for heat loss from the human body. The comfortable range of relative humidity for a passenger was observed as 30-70%. At high temperatures, if the relative humidity is more than 70%, the condition creates sweat evaporation in the body, decreasing the comfort level. If the relative humidity falls below 30%, it leads to a dry sensation on the skin, which badly affects mucous membranes [11]. Currently, the thermal comfort in vehicles is evaluated based on EN ISO 14505 [11, 14, 15] specification which is classified into three parts:
Three internal indicators were recommended in the standard to assess the thermal comfort:
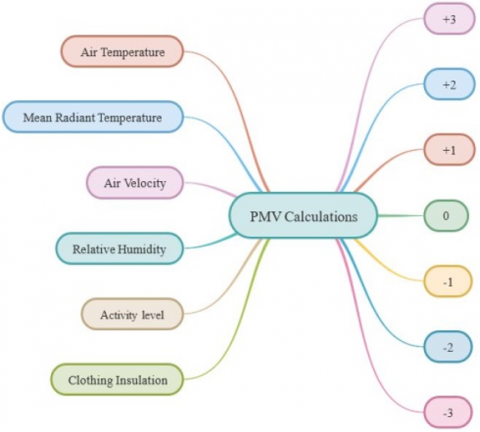
The initial part of EN ISO 14505 was linked with EN ISO 7730 which introduces the use of PMV and PPD. The PMV index provides a value that indicates the ASHRAE thermal sensation scale and gives the average thermal sensation felt by a group of people [16, 17]. It was measured at a scale of 7 with -3 indicating being cold to +3 being hot [9, 10] as shown in Figure 1. This scale is effective for indoor conditions since the steady-state condition of airflow will be prevailing. The PMV has been proposed and implemented only for steady-state conditions but an unsteady state of airflow was identified in the cabin of an automobile [8].
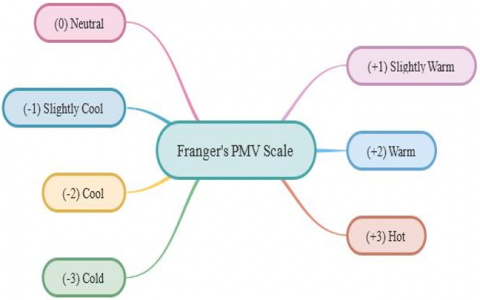
The thermal comfort of the passengers was influenced by internal airflow, cabin temperature distribution, solar heat flux, and radiative heat flux from interior parts of the cabin [18]. The cabin atmosphere of the vehicle is controlled by intermittent thermal conditions, unlike the in-door air conditioning systems. Heat conduction, convection, and radiation have major effects on the thermal comfort of passengers. Effect of thermal soak, when passengers were exposed to environmental conditions may create instant thermal impact or thermal blow [10]. Fanger [19] noted that the values of PMV is not sufficient to define the level of discomfort. Hence the concept of Predicted Percentage of Dissatisfied (PPD) was added by Fanger to estimate PMV which is depicted in Figure 2. The PPD predicts the number of thermally uncomfortable persons. The value of 10% of the PPD index corresponds to the scale between -0.5 and + 0.5 for PMV on the Fanger scale. If the value of PMV is zero, around 5% of the occupants are in discomfort.
Another major concern for the design of the AC system includes the psychological and physiological variations between passengers. Figure 3 shows various thermal comfort contributors for humans.
Figure 1. PMV calculations scale
Figure 2. Various thermal comfort contributors
Figure 3. Fanger’s PMV scale
Experimental studies show that there were major differences between the thermal state expressed by real passengers and the expected comfort offered by the indices proposed by standards. A large number of experiments are required to test the relationship between the response and the independent design variables. On the other side, empirical investigations carried out by Computational Fluid Dynamics (CFD) have gained enormous prominence in the automotive industry in recent decades [20, 21].
Lim et al. [22] used the hybrid air-conditioning system to evaluate the performance of airflow inside the office cabin using CFD analysis. The work conducted a study on openings for the ventilation, velocity, wind direction, and outside temperature on the inside of the air distribution. Thermal displacement ventilation (TDV), presented evidence for mechanical components, air velocity, and position of airflow needs to be considered. They used the 3-D model CFD analysis to evaluate thermal comfort. Results proved that a good flow of air inside the room except for the identification of discomfort in the feet/ankle region [23]. Huang et al. [24], conducted a similar CFD-based study satisfying continuity equations and efficient flow of air by providing different contours at different areas of study. The work concluded that the combined system consisting of ceiling cooling and evaporative cooling systems consumes less energy and occupies less space when compared to a conventional system. Chow et al. [25] discovered a method to tackle the problem of heat rejection by optimizing the spacing between condensing units through simulation. Research works in EV air-conditioning have been concentrating on reducing the heat absorption for lowering heat load and enhancing the cooling system’s performance [26]. The electric compressor was carefully chosen to provide adequate cabin cooling [27]. The thermal load comes from different sources, which includes,
Studies show that 10℃ cabin temperature reduction can lead to the reduction of up to 45% of the range in an EV. A positive temperature coefficient (PTC) heater is a common method used for providing heat inside the EV cabin which converts electricity into direct heat. The cabin heating can be directly related to the positive temperature coefficient (PTC). The increased PTC contributes to the reduction in the range of EV [28, 29]. A unified thermal management system that satisfies diverse thermal and design needs of the auxiliary loads in EV's needs to be evolved. Recently automotive industries were experimenting with different exposure conditions of the vehicle with air, coolant or refrigerant cooled batteries and heat pump for recycling the waste heat. Researchers have been concentrating on new technologies to increase efficiency and to reduces the cost and complexity of implementation. Cabin air-conditional loop, Battery heating/cooling loop, power electronics, and electric motor (PEEM) cooling loop, Unitary Thermal Energy Management for Propulsion Range Augmentation (UTEMPRA)are a few examples for waste energy harvesting and thermal energy distribution.
The heat balance method and Weighting Factor Method (WFM) popularly known as HBM have been used for calculating thermal load. The benefit of HBM method is that the thermal calculations can integrate several fundamental models and this method is preferred to the WFM. Alexandrov et al. [30] used numerical solutions and CFD simulations to estimate the accurate thermal load by considering airflow, temperature, and humidity. Figure 4 replicates different thermal load conditions experienced by an electric vehicle cabin.
Figure 4. Heat balance cycle
Despite the rapid development of battery technology and recharging infrastructure, the growth of electric vehicles (EVs) in road transport continues to be challenged by their limited driving range. Most of the research works have been concentrating on battery technology. The range of the EV can be enhanced using optimization of the energy by evaluating temperature and velocity at various locations of the vehicle which will enhance the thermal comfort of the passengers.
The experimental setup consists of a Maruti Omni car with a roof-mounted air conditioning system, with all major components placed at the top of the vehicle, as shown in Figure 5. Initially, the evaporator was placed parallel to the passenger seating, and the parameters like pressure, velocity, and temperature were manually determined by using the hotwire anemometer and temperature sensors respectively. Table 1 gives the details of the instrument used in this study. The entire passenger space was divided into a virtual grid of 50*50 mm and at each node point, the above-mentioned parameters were evaluated.
Table 1. Tools used for measurement, range, and precision
|
Equipment |
Parameter |
Measurement Range |
Precision |
|
LUTRON AM 4204 Hotwire Anemometer |
Flow Velocity |
0.2 - 20.0 m/s |
±(5%+1d) Reading |
|
Temperature |
0 to 50℃ |
±0.8℃ |
Figure 5. Experimental setup built inside the vehicle
3.1 Geometry and Simulation conditions
The vehicle was modeled with seats, whereas interior components like dashboard consoles and other equipment were neglected for the simplification of the analysis. The wheelbase was taken as X-axis, track as Z-axis, and height as Y-axis. The numerical grid presented in Figure 8 has 0.49 million numbered elements. The elements in the grid consist of hybrid mesh with tetrahedral and hexahedral elements. The boundary conditions were assigned to the CAD model. Figure 8 shows the meshed model of the selected vehicle. The inlet condition given to the model was of velocity type and the output was of pressure type. For analyzing the flow characteristics were finalized ignoring the temperature. The turbulence model used for simulation was RNG k-ε, which was suited for indoor environmental modeling. The second-order upwind momentum equation was selected and the SIMPLE algorithm was used for pressure velocity type coupling. For the flow simulation, the internal volume of the whole cabin was considered. The materials like metal and glass are considered for the simulation neglecting the radiation heat flow. The simulations were carried out by considering the outdoor conditions with ambient temperatures as 30℃, 40℃, 45℃.
Initially, the parameters obtained from the experiment were used to simulate the flow inside the cabin. Then both the data were compared. First, the evaporator is placed such that the outlet is right above the passenger seat as shown in Figure 6 and Figure 7 shows the areas of the vehicle, which is exposed to sunlight. As per the standards, the operating limit of the velocity inside the vehicles should not exceed 5 m/s for the roof mount AC unit. The air velocity was set to 2.3 m/s, which is approximately half of the standard limit, and the temperature was 23℃. The position of the AC unit is moved in the x-direction towards the rear of the vehicle. The positions were categorized into three cases viz 150 mm, 300 mm, and 450 mm from the initial position as shown in Figure 8, and Table 2.
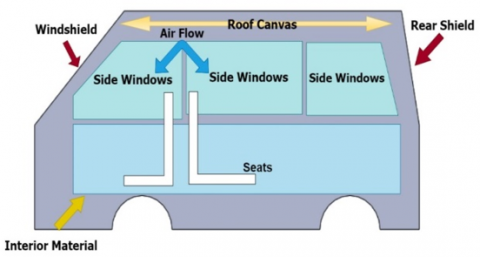
Figure 6. External surfaces-2D sketch
The experimental results were tabulated into a matrix through which contours were constructed for determining the actual flow of the air. In this case, the boundary conditions used in the model and the data were obtained through measurements that relate to the discharge and volumetric flow of air.
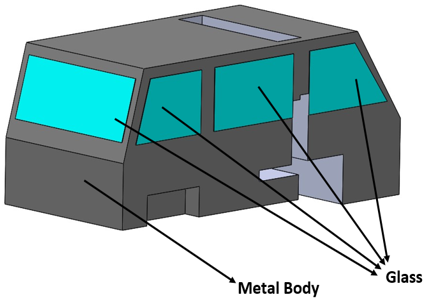
Figure 7. External surfaces-3D sketch
Figure 8. CAD models- case- 1, 2, 3 and mesh model
Table 2. Categorization of the position of AC units
|
Different Cases |
Distance (mm) from the actual position |
|
Case 1 |
150 |
|
Case 2 |
300 |
|
Case 3 |
450 |
3.2 Thermal comfort simulation
The boundary conditions for simulating thermal comfort indices are similar to that of experimental flow analysis, and overall cabin temperature was included as an additional boundary condition. The observed temperature of 23℃ was applied to the boundary condition and thermal comfort indices were calculated by the Thermal Comfort plugin in Ansys Fluent. The parameters, assessing for comfort indices are listed in the Table 3.
The velocity and temperature of air were directly taken from the experiment. The PMV and PPD values are calculated at the two extreme planes (left & right) and central plane in the Z - direction.
Table 3. Thermal comfort indices
|
Parameter |
Value |
|
Humidity |
35% |
|
Metabolism |
2 MET |
|
Clothing factor |
0.8 |
4.1 Comparison of velocity data of Experiment and Simulation
All data were collected from indoor space and results of simulation conducted in the CFD package were compared. The velocity profiles, temperature distribution, and comfort indices were extracted from the simulation in the planes at right, left, and at the center plane of the car cabin. These data were compared with the experimental values. To avoid confusion and complexity, the data on the other planes were not considered.
4.2 Left plane
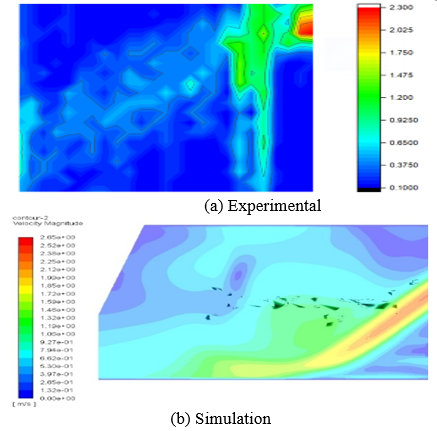
Figure 9(a) shows the velocity profile on the left plane of the vehicle. The image was plotted using the experimental data, which reveals the distribution of the air velocity in the extreme left plane of the vehicle cabin. The velocity ranges from 0 m/s to 0.35 m/s. The flow of air from the blower is mainly directed to the front side. The velocity plot shows the zero value at some positions, it is due to the intricate and non-uniform geometry of the cabin wall. The left end of the blower is 250 mm away from the cabin wall.
In Figure 9(b) the velocity contours were plotted based on the experimental values. The uniform velocity of 0.7 m/s is observed on the other regions of the plane. The velocity contours were compared in both simulation and experimental values. The maximum velocity obtained in the simulation was 0.8 m/s, whereas the maximum flow rate obtained in the experimental evaluation was 0.79 m/s.
Figure 9. Distribution of velocity magnitude in left plane
Figure 10. Distribution of temperature in the left plane
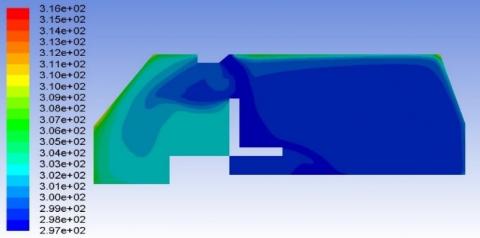
Figure 10 depicts the temperature distribution in the left plane. The lowest temperature of 297 K was observed around the passenger seating zone and driver head position, whereas temperature at the other regions was in the range of 308 K. The bouncing effect of air can be observed from the temperature plot at the rear bottom part of the vehicle. This temperature difference was mainly due to the interactions between the surroundings through the metal surface of 1.45 m2 and glass surface of 0.58 m2 at this plane.
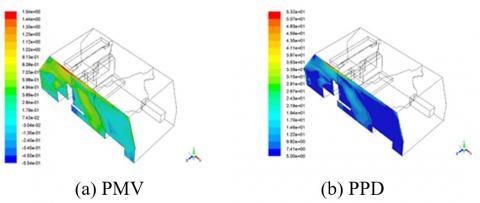
Figure 11(a) shows the PMV plot on the left plane of the vehicle. PMV of 0.5 in the passenger area and -0.7 in the major portions of the cabin is observed. Even after keeping the equal temperature in the plane, passenger clothing factor and MET assumptions were the reasons for the variation of PMV. Figure 11(b) represents the dissatisfaction percentage (PPD), where 19% dissatisfaction was observed in the passenger seating area. The remaining part of the cabin was having only 5%. The reason for this abrupt change in the values was due to the direct impact of flow on the passenger body as the position of the evaporator unit is directly above the passenger's head.
Figure 11. Comfort indices in the left plane
4.3 Central plane
Figure 12(a) reveals the equal distribution of the air velocity in the central plane of the vehicle cabin plotted using experimental data. The flow with a velocity of 2.3 m/s can be observed near the outlet of the AC unit and it gradually reduced as it reaches the far end of the cabin.
Figure 12. The distribution of velocity magnitude in the central plane
The plotted velocity ranges from 0 m/s to 1.475 m/s. There is no much drop in the velocity was observed in the central plane as of the left plane.
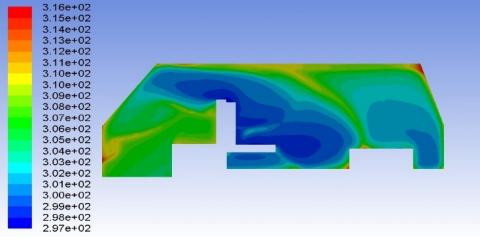
Figure 13 shows the temperature distribution in the central plane of the vehicle. The temperature of the passenger cabin area is observed to be at 297 K. This is due to the proper recirculation of the air, which can be observed from the simulated velocity data. The comfort indices in the central plane of the vehicle cabin are shown in Figure 14, where PMV of 0.7 was obtained in the passenger area and 0.06 in the other portions of the cabin. Figure 14(b) represents the dissatisfaction percentage (PPD). 11% dissatisfaction in the passenger seating area was obtained, due to the arrangement of a seat at the flow path of air. The remaining part of the cabin was at 5%.
Figure 13. Distribution of temperature in the central plane
Figure 14. Comfort indices in the central plane
4.4 Right plane
The equivalent distribution of air velocity in the extreme right plane of the vehicle cabin is shown in Figure 15(a), which was plotted with the experimental data. The velocity flow pattern in this plane is similar to the left plane. Velocity values in most of the cabin space were observed to be 0.66 m/s. The flow was negligible in the region due to the walls, irregularities of the cabin, distance between the wall and blower, and size of the AC unit. Most of the areas like the vehicle rear end and area under the evaporator outlet have the velocity of range 0 m/s – 0.2 m/s. There is no much air circulation observed in this plane.
Figure 15. Distribution of velocity magnitude in the right plane
Figure 16. Distribution of temperature in the right plane
Figure 17. Comfort indices in the right plane
The temperature distribution in the right plane is shown in Figure 16 and it is clear that temperature is not uniformly distributed. This plane is not in the reach of the AC vent, which leads to the non-uniform temperature distribution. Only the passenger area was cooled, whereas other areas are at the temperature of 308 K. As in the left plane thermal interaction between the surroundings through the metal and glass surfaces affected the temperature distribution. Figure 17 represents PMV and PPD values respectively on the right plane. The higher PPD values around. 21.5% was observed just like in the left plane as the phenomena are the same because of extreme planes and PMV value observed at the passenger area was close to 0.8 but outside the passenger area, a value of -0.03 was observed which indicates the much coolness as compared.
In all the reference planes higher PPD values were observed at the suction inlet and blower outlet of the evaporator unit. This indicates that not only temperature, the higher velocities also contribute to discomfort levels.
Moreover, if we observe from the above results, the evaluation parameters like velocity, temperature, and comfort indices are slightly deviating from the actual requirement. Hence the optimization is required to achieve the comfort zone by altering the position of the evaporator vent and change in the operating parameters. The position of the evaporator unit is changed and only thermal indices are evaluated but not velocity and temperature. This is only to avoid complexity and from the above results, it is observed that these indices are dependent on velocity and temperature.
The PMV and PPD values are simulated and tabulated for right, left, and central planes. For the optimization of the thermal comfort indices based on the position of the AC unit, we considered the entire cabin with maximum PMV and PPD values for three different cases. The comfort indices at an air velocity of 2.3 m/s and the original position of the AC outlet were obtained through simulation are tabulated in Table 4. The comfort indices at an air velocity of 2.3 m/s and evaporator outlet positions based on Table 2 were obtained through simulation and the results were tabulated in Table 5.
Table 4. Consolidated PMV and PPD values of right, left, and central planes
|
Plane |
Parameter |
Minimum |
Maximum |
|
Left |
PMV |
-0.5 |
1.5 |
|
PPD |
5 |
53 |
|
|
Centre |
PMV |
-0.57 |
1.27 |
|
PPD |
5 |
38 |
|
|
Right |
PMV |
-0.54 |
1.52 |
|
PPD |
5 |
52 |
Table 5. Comfort indices at the velocity of 2.3 m/s
|
Case |
Minimum PMV |
Maximum PMV |
Minimum PPD |
Maximum PPD |
|
1 (150 mm) |
-3.00 |
-2.99 |
94.99 |
95.00 |
|
2 (300 mm) |
-1.5 |
-0.64 |
13.73 |
50.98 |
|
3 (450 mm) |
-2.1 |
-0.88 |
21.5 |
84.5 |
From Table 5, the level of comfort indices was directed slightly towards the discomfort zone, which is not preferable as per ASHRAE standards. Even when the blower is working to deliver the quantity of air at considered velocity, it consumes battery power which leads to the reduction of range and other operations of the vehicle. So, the velocity was reduced by 43% i.e., 1.3 m/s, and analysis was carried out to observe the comfort indices inside the cabin. For reduced air velocity of 1.3 m/s with different ambient conditions, comfort indices were mentioned in Table 6.
From Table 6, the PMV values are well within the range of the ASHRAE requirements i.e. -1 to +1, for the case 3 conditions. The PPD values were comparatively low to other cases. This may be due to the arrangement of the AC unit far from the original configuration, which resulted in the uniform distribution of the temperature in the entire cabin rather than the concentration of cooling effect at a particular position. This can be observed from the PMV values for case 1 and case 2, where the temperatures were very low.
Table 6. Comfort indices at the velocity of 1.3 m/s
|
Case |
Ambient Temperature (℃) |
Minimum PMV |
Maximum PMV |
Mini-mum PPD |
Maximum PPD |
|
1 (150 mm) |
30 |
-1.17 |
-0.15 |
5.46 |
34.16 |
|
40 |
-1.17 |
0.515 |
5 |
34.11 |
|
|
45 |
-1.17 |
0.94 |
5 |
34.11 |
|
|
2 (300 mm) |
30 |
-1.63 |
-0.72 |
16 |
58 |
|
40 |
-0.42 |
-0.148 |
5.45 |
8.81 |
|
|
45 |
0.4 |
0.6 |
8.48 |
13.1 |
|
|
3 (450 mm) |
30 |
-0.414 |
0.649 |
5 |
13.8 |
|
40 |
-0.78 |
0.66 |
5 |
18 |
|
|
45 |
-0.38 |
0.76 |
5 |
44.76 |
Based on the calculations, the average work done by the compressor to condition the space can be reduced by 43%, in case III compared to its original position. The refrigerating effect was calculated based on the following data:
Velocity at the original position - 2.3 m/s.
Velocity at case 1, 2 and 3 - 1.3 m/s.
Area of the outlet duct - 0.09 m2.
Air outlet temperature (evaporator) - 292 K.
Evaporator inlet temperature – Table 7.
Table 7. Input temperature to the evaporator in K
|
Ambient Temperature (K) |
303 |
313 |
318 |
|
Position |
|
||
|
Original |
300 |
300.8 |
302.7 |
|
150 |
300 |
300.8 |
302.7 |
|
300 |
300.6 |
301.5 |
303 |
|
450 |
301 |
301 |
302.5 |
In case III better comfort was produced with 41% reduced (2.2 m/s to 1.3 m/s) air flow-rate through the blower, which reduces the power consumption. In case III heat load has been reduced due to reduced aging of conditioned air. The suitable downsizing of compressor is possible for the reduced heat load, which will be reflected through considerable savings of total power consumption (blower + compressor power) from battery.
This paper has presented a simple method of calibrating and validating a CFD model that replicates the dynamic flow inside a vehicle cabin. The CAD model was designed to assess various cabin ventilation techniques from a thermal comfort perspective. The simulation results were compared with the experimental data on air velocities. A good agreement was observed between the calculated experimental values and the CFD model with some errors at the extreme planes. The errors can be attributed to the various profiles and the presence of window glass, which disturbs the flow during the experiment. The higher PPD values were observed on the walls of the cabin and at the outlet of the AC vents. The observed values are in the range of the ASHRAE standards i.e. neutral range of PMV scale (+1 and -1) at the central plane.
For the different positions of the AC unit for optimizing the position, the indices were tabulated initially with a velocity of 2.3 m/s. The comfort parameters were identified to be reduced with the increase in the distance of the AC unit from its actual position, but the indices were not satisfying the standards. With the reduction of velocity to 1.3 m/s from 2.3 m/s, the indices were identified to be within the range of ASHRAE Standards (-1 to +1) at different ambient conditions. The PPD values were observed to be lowest for the outlet position of 450 mm from the actual position. The comfort indices for the position of 450 mm were within range compared to other cases. With the reduction in the air velocity from 2.3 m/s to 1.3 m/s, the average power required to run the blower can be reduced by 43%. Therefore, a smaller compressor can be employed, improving the range of the vehicle.
|
2D |
Two dimensional |
|
3D |
Three dimensional |
|
AC |
Air conditioning |
|
ASHRAE |
American Society of Heating, Refrigerating and Air-Conditioning Engineers |
|
BEV |
Battery electric vehicles |
|
CAD |
Computer-aided design |
|
CFC |
Chlorofluorocarbon |
|
CFD |
Computational fluid dynamics |
|
EV |
Electric vehicle |
|
HCFC |
Hydro chlorofluorocarbon |
|
HFC |
hydrofluorocarbon |
|
HVAC |
Heat ventilation and air-conditioning |
|
COP |
Coefficient of Performance |
|
IC |
Internal Combustion |
|
K |
Kelvin |
|
kW |
Kilowatt |
|
MET |
Metabolic equivalent |
|
CFD |
Computational fluid dynamics |
|
mm |
Millimeter |
|
m/s |
Meter per second |
|
m2 |
Meter square |
|
kg/s |
Kilogram per second |
|
kJ/kg K |
Kilojoule per kilogram Kelvin |
|
PEEM |
Power electronics and electric motor |
|
PMV |
Predicted mean vote |
|
PPD |
Predicted percentage of dissatisfied |
|
PTC |
Positive temperature coefficient |
|
TSV |
Thermal Sensation Vote |
|
UTEMPRA |
Unitary Thermal Energy Management for Propulsion Range Augmentation |
|
WFM |
Weighting Factor Method |
|
℃ |
Degree Celsius |
|
% |
Percentage |
[1] Leighton, D. (2015). Combined fluid loop thermal management for electric drive vehicle range improvement. SAE Int. J. Passeng. Cars - Mech. Syst., 8(2): 7711-720. https://doi.org/10.4271/2015-01-1709
[2] Śmierciew, K., Gagan, J., Butrymowicz, D., Karwacki, J. (2014). Experimental investigations of solar driven ejector air-conditioning system. Energy and Buildings, 80: 260-267. https://doi.org/10.1016/j.enbuild.2014.05.033
[3] Heating, Ventilation and Air Conditioning. https://www.carbontrust.com/es/node/663, accessed on 7 May 2021.
[4] International Energy Agency. (2011). Energy-efficient Buildings: Heating and Cooling Equipment. OECD Publishing.
[5] Lahlou, A., Ossart, F., Boudard, E., Roy, F., Bakhouya, M. (2020). A real-time approach for thermal comfort management in electric vehicles. Energies, 13(15): 4006. https://doi.org/10.3390/en13154006
[6] Broglia, L., Autefage, G., Ponchant, M. (2012). Impact of passenger thermal comfort and electric devices temperature on range: A system simulation approach. World Electric Vehicle Journal, 5(4): 1082-1089. https://doi.org/10.3390/wevj5041082
[7] Brusey, J., Hintea, D., Gaura, E., Beloe, N. (2018). Reinforcement learning-based thermal comfort control for vehicle cabins. Mechatronics, 50: 413-421. https://doi.org/10.1016/j.mechatronics.2017.04.010
[8] Walls, W., Parker, N., Walliss, J. (2015). Designing with thermal comfort indices in outdoor sites. Living and Learning: Research for a Better Built Environment: 49th International Conference of the Architectural Science Association, pp. 1117-1128.
[9] Hintea, D., Kemp, J., Brusey, J., Gaura, E., Beloe, N. (2014). Applicability of thermal comfort models to car cabin environments. In 2014 11th International Conference on Informatics in Control, Automation and Robotics (ICINCO), 1: 769-776. https://doi.org/10.5220/0005101707690776
[10] Qi, C., Helian, Y., Liu, J., Zhang, L. (2017). Experiment study on the thermal comfort inside a car passenger compartment. Procedia Engineering, 205: 3607-3614. https://doi.org/10.1016/j.proeng.2017.10.211
[11] Danca, P., Vartires, A., Dogeanu, A. (2016). An overview of current methods for thermal comfort assessment in vehicle cabin. Energy Procedia, 85: 162-169. https://doi.org/10.1016/j.egypro.2015.12.322
[12] Musat, R., Helerea, E. (2009). Parameters and models of the vehicle thermal comfort. Acta Universitatis Sapientiae Electrical and Mechanical Engineering, 1: 215-226.
[13] Kreutzer, C.J., Rugh, J., Tomerlin, J. (2017). Thermal load reduction system development in a Hyundai Sonata PHEV. SAE Technical Paper 2017-01-0186. https://doi.org/10.4271/2017-01-0186
[14] Ferreira, M.A., Tribess, A. (2009). User's perception of thermal comfort in ventilated automotive seats. SAE Technical Paper 2009-36-0043. https://doi.org/10.4271/2009-36-0043
[15] Oi, H., Ozeki, Y., Suzuki, S., Ichikawa, Y., Matsumoto, A., Takeo, F. (2019). Evaluation of equivalent temperature in a vehicle cabin with a numerical thermal manikin (part 1): Measurement of equivalent temperature in a vehicle cabin and development of a numerical thermal manikin. SAE Technical Paper 2019-01-0697. https://doi.org/10.4271/2019-01-0697
[16] Ji, H., Kim, Y., Yang, J., Kim, K. (2014). Study of thermal phenomena in the cabin of a passenger vehicle using finite element analysis: human comfort and system performance. Proceedings of the Institution of Mechanical Engineers, Part D: Journal of Automobile Engineering, 228(12): 1468-1479. https://doi.org/10.1177%2F0954407014532805
[17] Simion, M., Socaciu, L., Unguresan, P. (2016). Factors which influence the thermal comfort inside of vehicles. Energy Procedia, 85: 472-480. https://doi.org/10.1016/j.egypro.2015.12.229
[18] Khatoon, S., Kim, M.H. (2017). Human thermal comfort and heat removal efficiency for ventilation variants in passenger cars. Energies, 10(11): 1710. https://doi.org/10.3390/en10111710
[19] Fanger, P.O. (1973). Assessment of man's thermal comfort in practice. Occupational and Environmental Medicine, 30(4): 313-324. http://dx.doi.org/10.1136/oem.30.4.313
[20] Ghosh, D., Wang, M., Wolfe, E., Chen, K.H., Kaushik, S., Han, T. (2012). Energy efficient HVAC system with spot cooling in an automobile-design and CFD analysis. SAE International Journal of Passenger Cars-Mechanical Systems, 5(2): 885-903. https://doi.org/10.4271/2012-01-0641
[21] Danca, P., Bode, F., Nastase, I., Meslem, A. (2017). On the possibility of CFD modeling of the indoor environment in a vehicle. Energy Procedia, 112: 656-663. https://doi.org/10.1016/j.egypro.2017.03.1133
[22] Lim, E., Sagara, K., Yamanaka, T., Kotani, H., Mishima, N., Horikawa, S., Ushio, T. (2007). CFD analysis of airflow characteristics in office room with task air-conditioning and natural ventilation. Proceedings of Indoor Air Quality. Ventilation & Energy Conservation in Buildings (IAQVEC), 2: 508-515.
[23] Pillai, S., Bhand, S., Shinde, V., Pawar, S., Katare, P. (2016). A review on CFD analysis in air-conditioning system. International Journal of Current Engineering and Technology, (Sp6): 12-14.
[24] Huang, X., Li, Y., Wu, J. (2006). CFD simulation and analysis of the combined evaporative cooling and radiant ceiling air-conditioning system. HVAC Technologies for Energy Efficiency, 4(3).
[25] Chow, T.T., Lin, Z., Wang, Q.W., Lu, J.W.Z. (2011). Studying thermal performance of split-type air-conditioners at building re-entrant via computer simulation. IBPSA 2019, Conference Proceedings, 31(2).
[26] Marshall, G.J., Mahony, C.P., Rhodes, M.J., Daniewicz, S.R., Tsolas, N., Thompson, S.M. (2019). Thermal management of vehicle cabins, external surfaces, and onboard electronics: An overview. Engineering, 5(5): 954-969. https://doi.org/10.1016/j.eng.2019.02.009
[27] Lin, P.H. (2010). Performance evaluation and analysis of EV air-conditioning system. World Electric Vehicle Journal, 4(1): 197-201. https://doi.org/10.3390/wevj4010197
[28] Chowdhury, S., Leitzel, L., Zima, M., Santacesaria, M., Titov, G., Lustbader, J., Govindarajalu, M. (2018). Total Thermal management of battery electric vehicles (BEVs). SAE Technical Paper 2018-37-0026. https://doi.org/10.4271/2018-37-0026
[29] Kang, B.H., Lee, H.J. (2017). A review of recent research on automotive HVAC systems for EVs. International Journal of Air-Conditioning and Refrigeration, 25(4): 1730003. https://doi.org/10.1142/S2010132517300038
[30] Alexandrov, A., Kudriavtsev, V., Reggio, M. (2001). Analysis of flow patterns and heat transfer in generic passenger car mini-environment. 9th Annual Conference of the CFD Society of Canada, Kitchener, Ontario.