OPEN ACCESS
The melting temperature-pressure phase diagram [Tm\(P)-P] for semiconductor, molecular crystals and oxide are predicted through the Clapeyron equation where the pressure-dependent volume difference is modeled by introducing the effect of surface stress induced pressure. Semiconductor, molecular crystals and oxide have been employed to test the reliability of the model, because of its important role. For Si and Ge, the stable state under normal pressure is the diamond structure (Si-I and Ge-I). Through pressure, this change in the diamond structure for beta -Sn structure (Si-II and Ge-II), and with the increase of temperature, phase I and II are going to be melting into a liquid (L). For the CO2 crystal (commonly known as dry ice), it is a molecular solid with a structure of Pa3 at low temperature and low pressure (CO2-I), and can be widely used for cooling. Al2O3 has been extensively investigated because of its widely ranging industrial applications. This includes applications as a refractory material both of high hardness and stability up to high temperatures, as a support matrix in catalysis. MgO is a material of key importance to earth sciences and solid-state physics: it is one of the most abundant minerals in the Earth and a prototype material for a large group of ionic oxides.
Phase transitions, Pressure-dependent, Temperature, Oxides.
High pressure research is a powerful tool to explore key and electronic states of nature in solids. Due to high pressure often produce a lot of new structure in the elements or compounds, so it has become a significant change in a way of atomic distance and coordination number. With the development of high pressure research unceasingly thorough, the temperature pressure phase diagram (T/P) caused by theoretical and experimental home interest. In recent years, the generation and measurement of simultaneous high pressures and high temperatures has undergone rapid development with the diamond anvil cell (DAC) technique [1-4]. We choose Si, Ge, CO2, Al2O3 and MgO to verify the reliability of the model, because, although the T-P phase diagram of this substances have been obtained through the experiments is established, but the measurement accuracy under high temperature and pressure is not high, so most of the phase diagram are experimental, or is the schematic, the existing data has not been confirmed theoretically. Therefore, more in-depth theoretical work is necessary.
For Si and Ge, as everyone knows, the steady state under normal pressure is the diamond structure (Si-I and Ge-I). Through pressure, this change in the diamond structure for beta -Sn structure (Si-II and Ge-II), and with the increase of temperature, phase I and II will melt, into a liquid (L). For the CO2 crystal (commonly known as dry ice), it is a molecular solid with a structure of Pa3 at low temperature and low pressure (CO2-I), and can be widely used for cooling. As the pressure increases, several high pressure phases appeared, including the P42/mnm symmetric structure (CO2-II), Cmca orthorhombic structure (CO2-III), the structure of Pbcn (CO2-IV) and polymerization of the quartz structure (CO2-V) etc. However, for this high pressure phase is still uncertain, especially have yet to determine precisely their stable field. Al2O3 and MgO have been employed to test the reliability of the model, because of its important role. Al2O3 has been extensively investigated because of its widely ranging industrial applications. This includes applications as a refractory material both of high hardness and stability up to high temperatures, as a support matrix in catalysis, as well as a variety of fundamental interests [5-8]. MgO is a material of key importance to earth sciences and solid-state physics: it is one of the most abundant minerals in the Earth (especially its lower mantle) and a prototype material for a large group of ionic oxides. The classic Clapeyron equation governing all first-order phase transitions of pure substances may be useful to determine the Tm (P)-P curve theoretically in the following form [9],
$d p=\frac{\Delta H\left(T_{m}, P\right)}{\Delta V\left(T_{m}, P\right) T_{m}} d T_{m}$ (1)
where H (Tm,P) show the gram-atom melting enthalpy and V(Tm,P) is gram-atom volume change during the melting with Δ denoting the change. Eq. (1) can describe the joint rate of change dP/dTm along the phase equilibrium lines and estimate the derived properties of DH and DV. To utilize Eq. (1) for determination of phase diagram, a Tm(P) function or an integration of Eq. (1) is needed. Since both DH(Tm,P) and DV(Tm,P) are functions of temperature and pressure, and the necessary separation of variables cannot be accomplished in any direct and known manner, the integration of Eq. (1) has been carried out through approximate methods ever since the equation was first established in the 19th century [9]. Although when DP = P–P0 and DT = Tm–Tm0 are small, DH(Tm,P) » DH(Tm0,P0) and DV(Tm,P) » DV(Tm0,P0) have minor error where the subscript 0 denotes the initial points and D denotes the difference [6], as DP and DT increase, exact functions of DH(Tm,P) and DV(Tm,P) must be known [9]. Thus, a successful application of Clapeyron equation for Tm(P)-P phase diagram depends on establishing accurate ΔH(Tm, P) and ΔV(Tm, P) functions.
Recently, a general equation without any free parameter for surface stress f has been established as follows [10],
f (Tm0) = (h/2)[3DSvibDHm0/(kSVSR)]1/2 (2)
where h is atomic diameter, DSvib is the vibrational part of the overall melting entropy DSm, Sm=Sel+Spos+Svib, Sel is negligibly small, and Spos=-R[xAln(xA)+ xvln(xv)], where xA= 1/(1+ΔVm) and xv=ΔVm /(1+ΔVm) are the molar fractions of the host material and vacancies, respectively [11], for oxides DSvib » DSm-DSpos, k = -DV/(VP) is compressibility of the crystal, VS is gram-atom volume of crystals, R shows the ideal gas constant and DHm0 is bulk melting enthalpy at Tm0.
The predicted f values of various materials in terms of Eq. (2) are in agreement with the known experimental and theoretical results obtained from the first principle and the classic mechanics calculations [10]. Since the measured thermodynamic amounts in Eq. (2) has reflected usually unknown surface states of materials [10], Eq. (2) supplies an easy way to establish a relationship between the surface stress induced internal pressure Pi for small particles and Tm, which brings out a possibility to determine DV (Tm, P) function.
DHm(Tm) function can be determined by Helmholtz function, DHm(Tm) = DGm(Tm)-TmdDGm(Tm)/dTm, where DGm(Tm) denotes the temperature dependent solid-liquid Gibbs free energy difference. For oxides, DGm(Tm) = DHm0Tm(Tm0-Tm)/Tm02 where DHm0 is the melting enthalpy at the melting temperature Tm0 [12]. This function was modeled by treating DHm(Tm) to be a linear function where the heat capacity difference ΔCp between crystal and liquid to be a constant. Using a mathematic approximation that the quantity ln (Tm0/Tm) is approximately equal to 2(Tm0-Tm)/(Tm0+Tm) with neglecting of higher order terms. Thus,
DHm(Tm) = DHm(Tm/Tm0)2. (3)
In this contribution, through assuming that DV(Tm,P) and DH(Tm,P) functions may be determined by Eqs. (2) and (3), Tm(P) curves are obtained with an integration of Clapeyron equation when suitable original points for each integration are selected. It is found that the model prediction of the Tm(P)-P phase diagram of corundum is consistent with the experimental results and other theoretical predictions [16-18].
To find a solution of Clapeyron equation, as a first order approximation, DHm(Tm,P) » DHm(T) and DVm(Tm,P) » DVm(P) are assumed [9], which lead to a simplification of Eq. (1),
$d P=\frac{\Delta H_{m}\left(T_{m}\right)}{\Delta V_{m}(P) T_{m}} d T_{m}$ (4)
DVm(P) = (VL-VS)+(DVL-DVS) where the subscripts S and L denote solid and liquid, respectively. DVS = -VSPSkS and DVL = -VLPLkL where VL and VS are known data. To find a solution of the equation, a relationship between PL and PS must be found. To do that, a spherical particle with a diameter D is considered. In light of the Laplace-Young equation, PS = 4f/D and PL = 4g/D where g is the surface energy of the liquid [10]. Thus, DVL = -VLPS(g/f)kL because PS/PL = f/g. Substituting this relationship into DVm(P) function,
DVm(P) = VL-VS +[VSkS -VL(g/f)kL]P (5)
where PS has been simplified as P. when the initial point of (P0, T0) is selected as (0,Tm0) where Tm0 is the melting temperature under ambient pressure, integrating Eq. (5) with DHm(Tm) and ΔVm(P) functions in terms of Eqs. (3) and (5),
$\int_{0}^{P}\left\{V_{L}-V_{S}+\left[V_{S} \kappa_{S}-V_{L}\left(\gamma / f_{S}\right) \kappa_{L}\right] P\right\} d P =\left(\Delta H_{m 0} / T_{m 0}^{2}\right) \int_{T_{m 0}}^{T_{m}} T_{m} d T_{m}$,
or
$T_{m}(P) =T_{m 0} \sqrt{1+\left\{2\left(V_{L}-V_{S}\right) P+\left[V_{S} \kappa_{S}-V_{L}(\gamma / f) \kappa_{L}\right] P^{2}\right\} / \Delta H_{m 0}}$ (6)
Although the above discussion on P is related with the surface stress induced internal pressure Pi for a spherical particle, they may be extended to a general case for the pressure effect on Tm, which is illustrated as follows: Let P denote the sum of Pi and the external pressure Pe, namely [16],
P=Pi+Pe. (7)
When Pe » 0, P = Pi. This is the case of the size-dependent melting. When Pi » 0 with D®¥, P = Pe, which is the usual situation of the pressure-dependent melting for bulk materials. Since any pressure source should have the same effect on materials properties, Pi can be substituted by Pe. Thus, although P denotes Pi in above Tm(P) equation, it has been considered as Pe and is simplified as P.
Figs.1 and Figs.2 describes the melting curve on the Si T-P phase diagram and Si nano crystals and T-P phase diagram of Ge according to equation (6) compared model predicted results and experimental results and other theoretical results, parameters used are listed in Table. 1. Figure. 1 present a comparison for T-P phase diagram of bulk Si and the melting curve of Si nanocrystal among the model predictions and experimental and other theoretical results. The solid lines denote model predictions in terms of Eqs. (6) Where necessary parameters used are listed in Table .1. The symbols ○, □, ∆ show experimental results. The dash and dot lines denote other theoretical results. Other symbols denote I-II transition pressure at room temperature where n denotes the theoretical result, + denotes the experimental results under non-hydrostatic pressure, ♦, ◊ and ∇ denote the experimental results under hydrostatic pressure. For the melting of Si nanocrystal, the two dash lines show the predicted results where the corresponding TmI (D) values denoted as × (1478 K) and ▲ (1371 K) are obtained from other theoretical result and Eq. (6), respectively. For comparison, the dot line gives the theoretical result for melting of Si nanocrystal. Figs.1 and Figs.2 in the P-T relationship is through the small particles produced by internal pressure considered and applied in bulk crystals of external pressure equivalent to the idea of the establishment of the. However, equation (6) limit the size of nano crystal used in Pi must be taken into account; it is equal to 6h. For the I-L transformation, the corresponding 6hI = 1.4112 nm, according to PI = 4 f more I/D, we obtain the limit pressure for the Pl = 10.5 GPa. while at Pl < P < Pt this pressure range, the error of P-T curve and the experimental results of our model predicted only small, but this will still give the triple point (Pt determination of Tt), bring some inaccuracy. In order to improve the accuracy and the experimental results more in line with that, we take the approach in determining P > Pl curve is: the curve tangent direction line extend along at P = 10.5 GPa place, this is because the experimental results confirm the pressure is large enough melting curve is approximately a straight line. Similarly, for the transformation of the Ge I-L, when 6hI = 1.47 nm, Pl = 6.12 GPa. We have taken and the Si class Like the way to deal with Pl < P < Pt the range of pressure curve. For the T-P phase diagram of Si and Ge, I-II phase boundary shift is very fuzzy, change the pressure distribution in the reported a wide range, especially at low temperatures, and change due to the very slow lag. As shown in the figure, although we chose different experimental results at room temperature with a mean value of PI-II to determine the transition curve of I-II, but the results of model predictions and the experimental results are in good agreement, this shows that the average results of the phase boundary of this transition and experiment is very close to the. In fact, our model predicted results and experimental results or have a certain error, this may be caused because we neglected the effect of compression of the pressure coefficient.
Figure 1. A comparison for T-P phase diagram of bulk Si and the melting curve of Si nanocrystalamong the model predictions and experimental and other the oretical results
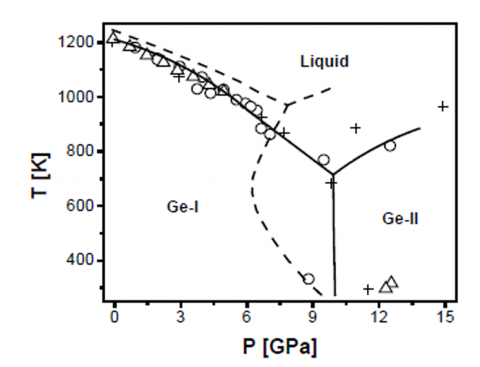
Figure 2. A comparison for T-P phase diagram of bulk Ge among the model predictions and experimental and other theoretical results
The solid lines denote model predictions in terms of Eqs. (6) where necessary parameters used are listed in Table 1. The ymbols Δ , + and Ο show experimental results. The dash lines denote other theoretical results.
Table 1. Necessary parameters for calculating T-P phase diagram of Si and Ge and the melting curve of Si nanocrystals in terms of Eqs. (6)
|
|
I-L transition |
I-II transition |
II-L transition |
|||||
|
|
Si |
Ge |
|
Si |
Ge |
|
Si |
Ge |
|
TmI |
1693 |
1210.4 |
TI-IId |
273 |
273 |
Ttf |
960 |
714 |
|
|
|
|
PI-IId |
12 |
10 |
Ptf |
11.6 |
9.915 |
|
VIa |
12.06 |
13.64 |
VIa |
11.00 |
11.93 |
VIIa |
8.53 |
9.66 |
|
VLa |
10.93 |
12.94 |
VIIa |
8.53 |
9.66 |
VLa |
10.93 |
12.94 |
|
κIb |
1.02 |
1.33 |
|
|
|
κIIb |
0.885 |
1.19 |
|
κL |
10.00 |
10.00 |
|
|
|
κL |
10.00 |
10.00 |
|
f Ic |
3.707 |
2.252 |
|
|
|
f IIc |
2.797 |
1.589 |
|
γ |
0.765 |
0.581 |
|
|
|
γ |
0.765 |
0.581 |
|
ΔHI-L |
50.55 |
36.94 |
ΔHI-IIe |
0.78 |
0.2 |
ΔHII-Le |
53.67 |
37.74 |
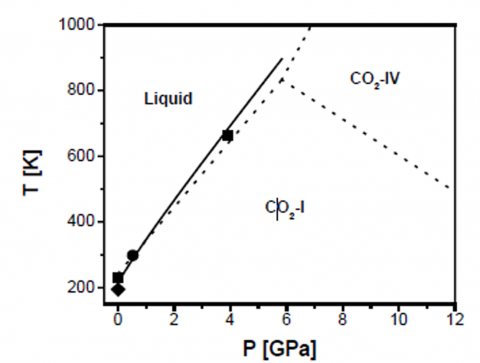
Fig.3 A comparison for TI-L(P) curve of bulk CO2-I between the model prediction and experimental results. The solid line denotes the model prediction in terms of Eqs. (6) where necessary parameters used are: TmI = 215.55 K, VL = M/ρL = 12.43 cm3⋅g-atom-1 with M =14.67 g⋅g-atom-1 and ρL = 1.18 g⋅cm-3, VI = 10.65 cm3⋅g-atom-1, κI = 1/BI =8.06×10⁻¹¹ Pa-1 with BI = 12.4 GPa, κL ≈ 100×10-11 Pa-1 as a first order approximation is equal to the κL value of CS2 since CS2 as a linear molecule has a similar behavior of CO2,ΔHI-L = 2.649 KJ⋅g-atom-1, γ = 0.00913 J⋅m-2, and fI = 0.5613 J⋅m-2 is calculated by Eq.(6) with hI = (21/2/2)aI = 0.3575 nm where aI = 0.5056 nm for Pa3 structure and ΔSvibI-L =8.856 J⋅g-atom-1⋅K-1. The dot lines show the experimental phase diagram.
Figure 3. A comparison for TI-L(P) curve of bulk CO2-I between the model prediction and experimental results
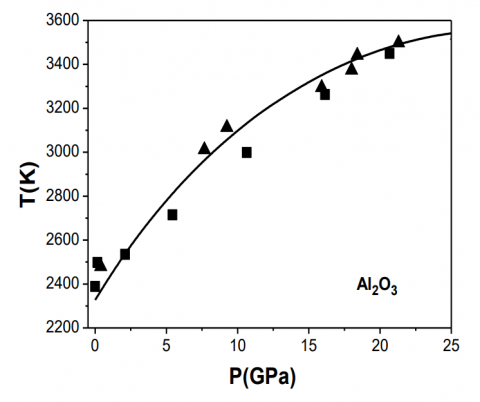
Figure.4 presents comparison between the model predictions of Eq. (6) and experimental result of pressure dependent melting of Al2O3. As shown in the figure, Tm increases as P increases. This is evidently induced by positive volume change DV during the melting. Thus, However, the low size limit of nanocrystals for the application of Pi in Eq. (6) must be considered, a crystal is characterized by its long-range order and the smallest nanocrystal should have at least a half of the atoms located within the particle [17]. Hence, the smallest Dmin is 2D0. For Al2O3, Dmin =1.146 nm in term of D0=3h for nanocrystals [7]. The curvature-induced pressure P approximately equals to 20.10 GPa by Laplace-Young equation Pi=4f/D associated with Eq. (2). The value of Tm on the melting curve Tm(P) must be determined. As shown in the figure, Clapeyron equation, without any adjustable parameter, is consistent with the experimental result and other theoretical prediction [13-15]. The Tm(P)-P relationship in Figs. 1 is made by a generalization where the internal pressure of small particles is considered to be equivalent to that of the bulk one.
Figure 4. Presents comparison between the model predictions of Eq. (6) and experimental result of pressure dependent melting of Al2O3
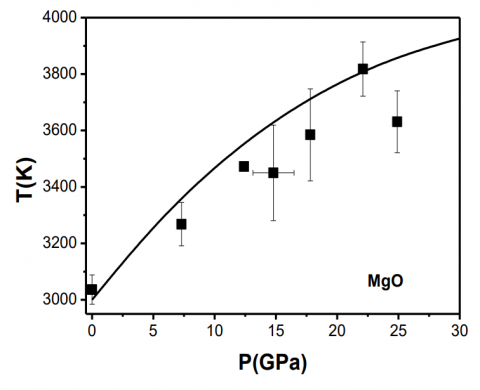
Figs.5 presents comparison between the model predictions of Eq. (6) and experimental result of pressure dependent melting of MgO. As shown in the figure, Tm increases as P increases. This is evidently induced by positive volume change DV during the melting.Thus, However, the low size limit of nanocrystals for the application of Pi in Eq. (6) must be considered, a crystal is characterized by its long-range order and the smallest nanocrystal should have at least a half of the atoms located within the particle [17]. Hence, the smallest Dmin is 2D0. For MgO, Dmin =1.284nm in term of D0=3h for nanocrystals . The curvature-induced pressure P approximately equals to 25.39 GPa by Laplace-Young equation Pi=4f/D associated with Eq. (2). The value of Tm on the melting curve Tm(P) must be determined. As shown in the figure, Clapeyron equation, without any adjustable parameter, is consistent with the experimental result and other theoretical prediction. The Tm(P)-P relationship in Figs.2 is made by a generalization where the internal pressure of small particles is considered to be equivalent to that of the bulk one.
Figure 5. Presents comparison between the model predictions of Eq. (6) and experimental result of pressure dependent melting of MgO
Since Clapeyron equation may govern all first-order phase transitions, the above consideration may be generalized for different phase transitions. Moreover, the success of Eq. (6) implies that the both assumptions of essentially ΔHm being a function of temperature and ΔVm being a function of pressure are reasonable.
Fig.1 A comparison for T-P phase diagram of bulk Si and the melting curve of Si nanocrystal among the model predictions and experimental and other theoretical results. The solid lines denote model predictions in terms of Eqs. (6) where necessary parameters used are listed in Table.1. The dash and dot lines denote other theoretical results. Other symbols denote I-II transition pressure at room temperature where n denotes the theoretical result, + denotes the experimental results under non-hydrostatic pressure, ♦ , ◊ and ∇ denote the experimental results under hydrostatic pressure. For the melting of Si nanocrystal, the two dash lines show the predicted results where the corresponding TmI(D) values denoted as × (1478 K) and ▲ (1371 K) are obtained from other theoretical result and Eq. (6), respectively. For comparison, the dot line gives the theoretical result for melting of Si nanocrystal.
Figure. 2 A comparison for T-P phase diagram of bulk Ge among the model predictions and experimental and other theoretical results. The solid lines denote model predictions in terms of Eqs. (6) where necessary parameters used are listed in Table.1. The symbols Δ, + and Ο show experimental results. The dash lines denote other theoretical results.
Figure. 3 A comparison for TI-L(P) curve of bulk CO2-I between the model prediction and experimental results. The solid line denotes the model prediction in terms of Eqs. (6) where necessary parameters used are: TmI = 215.55 K, VL = M/ρL = 12.43 cm3⋅g-atom-1 with M =14.67 g⋅g-atom-1and ρL = 1.18 g⋅cm-3, VI = 10.65 cm3⋅g-atom-1, κI = 1/BI =8.06×10⁻¹¹ Pa-1 with BI = 12.4 GPa, κL ≈ 100×10-11 Pa-1 as a first order approximation is equal to the κL value of CS2 since CS2 as a linear molecule has a similar behavior of CO2,ΔHI-L = 2.649 KJ⋅g-atom-1, γ = 0.00913 J⋅m-2, and fI = 0.5613 J⋅m-2 is calculated by Eq.(6) with hI = (21/2/2)aI = 0.3575 nm where aI = 0.5056 nm for Pa3 structure and ΔSvibI-L =8.856 J⋅g-atom-1⋅K-1. The dot lines show the experimental phase diagram.
Figure. 4 The pressure-temperature melting diagram of Al2O3, where the solid line shoes the model prediction of Eq. (6). The theoretical and experimental results are also plotted in the figure. The symbols ■ and ▲ denote the theoretical estimations and the experimental observations [13]. The necessary parameters in Eq. (6) are as follows: Tm = 2327 K [18], Hm = 21.76 KJ g-atom-1[19],Sm=Hm/Tm=9.35Jg-atom-1K-1, Sm=Sel+Spos+Svib, Sel is negligibly small, and Spos=-R[xAln(xA)+ xVln(xV)], where xA= 1/(1+ΔVm) and xV=ΔVm /(1+ΔVm) are the molar fractions of the host material and vacancies, respectively [20], and ΔVm is the volume difference between the crystal and corresponding fluid at Tm. As result, Svib= Sm-Spos or Svib » Sm+ R[xAln(xA)+ xVln(xV)] [21]. ΔVm=(VL-VS)/VS, Svib=5.6 Jg-atom-1K-1, h = 0.191 nm [18], g = 0.690 Jm-2 , kS =3.86×10⁻¹² Pa-1 is determined by k =1/B with B =289.55 GPa being the bulk modulus [21], VS = 5.14 cm3 g-atom [21], VL = 6.16 cm3g-atom-1 [18], kL =57.9×10⁻¹² Pa-1 as a first-order approximation under higher pressure, we assume kL » 15kS [13]. f is calculated through Eq. (2) and f = 4.5 Jm-2.
In summary, we have demonstrated the reliability of simple thermodynamic model in calculating the high pressure melting of solid by comparisons between obtained melting temperature and experimental melting data for Al2O3 and MgO. It is found that the model predictions are consistent with the present experimental and theoretical results. Since the Clapeyron equation may govern all first-order phase transitions, the Clapeyron equation supplies a new way to determine the T-P phase diagram of materials.
This work was supported by Science and technology project of Jilin province education department during the Twelfth Five-year Plan Period (No.2013232).
1. S.N. Singh, Flow and heat transfer studies in a doublepass counter flow solar air heater [J]. International Journal of Heat and Technology, Volume 31 No 2 (2013): 37-42.
2. Taoufik Brahim, Abdelmajid Jemni. A Two Dimensional Steady State Roll Heat Pipe Analyses For Heat Exchanger Applications. International Journal of Heat and Technology, Volume 30 No 2 (2012): 115-119.
3. V.Iota, J-H.Park, C.S.Yoo, Phase diagram of nitrous oxide: Analogy with carbon dioxide. Phys. Rev. B, Volume 69 (2004): 064106-064108.
4. J. G. Dash, History of the search for continuous melting. Rev. Mod. Phys, Volume 71 (1999):1737-1739.
5. R. Kofman, P. Cheyssac, R. Garrigos, from the bulk to clusters: solid-liquid phase transitions and precursor effects. Phase Transit. Volume 24 (1990): 283-285.
6. B. Holm, R. Ahuja, Y.Yourdshahyan, B. Johansson, and B. I. Lundqvist, Elastic and optical properties of Al2O3. Phys. Rev. B, Volume 59 (1999):12777-12779.
7. A. R. Oganov, M. J. Gillan, G. D. Price, Ab initio lattice dynamics and structural stability of MgO. J. Chem. Phys, Volume 118 (2003): 22-25.
8. P. F. McMillan, New materials from high-pressure experiments. Nature Mater, Volume 1 (2002):19-22.
9. V. Iota, C. S. Yoo, Phase diagram of carbon dioxide: Evidence for a new associated phase. Phys. Rev. Lett, Volume 86 (2001): 5922-5924. 10. S. A. Bonev, F. Gygi, T. Ogitsu, G. Galli, High-pressure molecular phases of solid carbon dioxide. Phys. Rev. Lett, Volume 91 (2003):065501-065503.
11. V. N. Soloviev, A. Eichhöfer, D. Fenske, U. Banin, Molecular limit of a bulk semiconductor: size dependence of the band gap in CdSe cluster molecules. J. Am. Chem. Soc, Volume 122 (2000), 2673-2675.
12. J. Mazher, A. K. Shrivastav, R. V. Nandedkar, R. K. Pandey, Strained ZnSe nanostructures investigated by xray diffraction, atomic force microscopy, transmission electron microscopy and optical absorption and luminescence spectroscopy. Nanotechnology, Volume 15 (2004) 572-574.
13. S. Sapra, D. D. Sarma, Evolution of the electronic structure with size in II-VI semiconductor nanocrystals. Phys. Rev. B, Volume 69 (2004)125304-125306.
14. B. Garrido, M. Lopez, O. Gonzalez, A. Perez-Rodrýguez, J. R. Morante, C. Bonafos, Correlation between structural and optical properties of Si nanocrystals embedded in SiO2: the mechanism of visible light emission. Appl. Phys. Lett, Volume 77 (2000)3143-3145.
15. K. Gaál-Nagy, M. Schmitt, P. Pavone, D. Strauch, Ab initio study of the high-pressure phase transition from the cubic-diamond to the –tin structure of Si. Comput. Mater. Sci, Volume 22 (2001), 49-52.
16. S. K. Deb, M. Wilding, M. Somayazulu, P. F. McMillan, Pressure-induced amorphization and an amorphousamorphous transition in densified porous silicon. Nature, Volume 414 (2001)528-529.
17. V. Schettino, R. Bini, Molecules under extreme conditions: Chemical reactions at high pressure. Phys. Chem. Chem. Phys, Volume 5 (2003) 1951-1953.
18. W. Rhim, K. Ohsaka, Thermophysical properties measurement of molten silicon by high-temperature electrostaic levitator: density, volume expansion, specific heat capacity, emissivity, surface tension and viscosity. J. Cryst. Growth, Volume 208 (2000):313-315.
19. S. Zhang, Size-dependent piezoelectric coefficient d33 of PbTiO3 nanoparticles. Materials Letter, Volume 62 (2008): 2438-2440.
20. C. C. Yang, G. Li, Q. Jiang, Effect of pressure on melting temperature of silicon. J. Phys.: Condens. Matter, Volume 15 (2003):4961-4963.
21. C. C. Yang, Q. Jiang, Effect of pressure on melting temperature of carbon dioxide. J. Chem. Thermodyn, Volume 37 (2005):1019-1020.