Optimization of Bioethanol Production from Unripe Jackfruit (Artocarpus heterophyllus Lam.) Pulp Starch Using Response Surface Methodology

Chizoma Nwakego Adewumi![]() | Ozioma Achugasim
| Ozioma Achugasim![]() | Adekunle Akanni Adeleke
| Adekunle Akanni Adeleke![]() | Ikechukwu Stanley Okafor
| Ikechukwu Stanley Okafor![]() | Hauwa Abubakar Rasheed
| Hauwa Abubakar Rasheed![]() | Regina Enyidiya Ogali
| Regina Enyidiya Ogali![]() | Onyewuchi Akaranta
| Onyewuchi Akaranta![]() | Emmanuel Omotosho*
| Emmanuel Omotosho*![]()
© 2025 The authors. This article is published by IIETA and is licensed under the CC BY 4.0 license (http://creativecommons.org/licenses/by/4.0/).
OPEN ACCESS
Bioethanol can only continue as a viable cleaner alternative to fossil fuels by utilizing abundant, renewable, and eco-friendly feedstocks with high conversion efficiencies or by developing technologies that enhance efficiency and reduce inhibition. This study aims to compare the potential of producing bioethanol from Artocarpus heterophyllus Lam. (AHL) pulp starch with cassava (CAS) starch. Response surface methodology (RSM) was used to optimize the process conditions in acid and enzymatic hydrolysis for optimum reducing sugar and ethanol yield. The study demonstrated that AHL performed better than CAS in the enzymatic process with an optimum reducing sugar yield of 80.22 g/L compared to 70.61 g/L obtained for CAS. The conversion efficiencies for AHL and CAS at an optimum condition of 120 amylase and 310 amyloglucosidase unitg-1 starch were 91.2% and 80.24%, respectively. Consequently, in the acidic process, an optimum sugar yield was achieved at 0.5 M H2SO4, 45 mins hydrolysis time and 121℃. Under these conditions, AHL sugar yield was 19.05 g/L with 34.64% conversion efficiency while CAS produced 22.48 g/L with 40.87% conversion. The results of the ethanol yield obtained in both hydrolytic processes showed that AHL compared very favorably with CAS. Though AHL is characterized by higher amylose content (28.90) than CAS (20.43) which would easily hinder enzyme accessibility during hydrolysis, its type-A crystal structure paved the way for its starch to be easily assessed by the α-enzymes. Hence, this study provided a suitable, efficient and sustainable substitute to cassava or other first-generation feedstock for bioethanol production.
acid hydrolysis, bioethanol, cassava, enzymatic hydrolysis, Jackfruit, starch
Globally, there is a growing focus on developing renewable, affordable, and environmentally friendly energy sources, particularly in the transport sector. This shift is driven by the rising energy demand and the challenges associated with the depletion, production, and use of non-renewable fossil fuels, which have raised significant concerns about climate change [1, 2]. Among the renewable energy sources, bioethanol is considered the most promising renewable biofuel with inherent octane number enhancing ability when blended with gasoline, CO2 reduction, hence reducing climate change [3, 4]. Blending bioethanol with gasoline not only enhances the octane rating due to its oxygen content but also reduces the need for toxic octane-boosting additives such as methyl tertiary butyl ether [3, 5]. The high cost associated with bioethanol production has been an issue restraining the intensive use of ethanol as an oxygenate in gasoline. In this regard, governments have made several subsidies to encourage the continuous production of bioethanol to meet the global mandate of a minimum 10% bioethanol blend in gasoline [6]. The adoption of zero emission of CO2 by 2050 for many countries has led to innovative approaches toward enhancing the amount of global bioethanol production and sustain energy requirement, especially in the transportation sector [1, 7].
Major industrial production of bioethanol is obtained from first generation biomass such as corn, cassava, wheat, sugarcane, sweet sorghum and so on. However, it is extremely dangerous for food security [8, 9]. Currently, the world is faced with enormous food crises because of the Russia-Ukraine war, where billions of tons of grains are hindered from reaching the rest of the world. Lignocellulosic biomass, being non-food-based, offers the advantage of avoiding food-versus-fuel conflicts in bioethanol production. However, its economic viability is hindered by the complexity of its structure, high costs associated with pretreatment and detoxification, and relatively low product yield [10, 11]. Third-generation bioethanol feedstocks, such as algae, have minimal impact on food security. However, the difficulties in harvesting algae and the high costs associated with conversion processes limit their broader adoption and development [4, 12]. The choice of feedstock, whether first, second, or third generation, is crucial in commercial bioethanol production. This is because the costs associated with feedstock and conversion processes make up a significant portion of the total production expenses. Additionally, ethanol yield and productivity, environmental sustainability, and social factors are also important considerations when evaluating the economics of fuel ethanol production [5, 13]. For example, sugar cane is predominantly used in Brazil, corn is the primary feedstock in the United States, and cassava and wheat are commonly used in China. Cassava has been a major raw material for bioethanol production in other parts of the world because of its high conversion yield and availability. Pervez et al. [14] reported an 84.0% ethanol conversion efficiency after hydrolyzing and fermenting 20.0 g/L cassava starch. Wangpor et al. [15] produced a maximum bioethanol yield of 43.5 g/L with a fermentation percentage of 85.4% during enzymatic hydrolysis of cassava starch. In addition, Pradyawong et al. [5] compared ethanol yield from cassava starch with different varieties of corn starch; the result demonstrated that cassava produced ethanol with a 2.8% yield higher than that of corn varieties. In Nigeria, there is an active search for alternative feedstocks to replace cassava and corn for bioethanol production, with the goal of minimizing or eliminating impacts on food security. Thus, this study aims to produce bioethanol from the starch of unripe Artocarpus heterophyllus Lam. (AHL) pulp and compare its reducing sugar and ethanol yields with those obtained from cassava, using both acid and enzymatic hydrolysis methods.
2.1 Materials and reagents
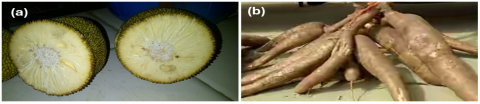
Unripe matured Jackfruit (JF) bulb and cassava (CAS) tuber (TMS 326) shown in Figure 1 were collected from a farm in the University of Port Harcourt, Choba, Rivers State, Nigeria. The rind and seeds of JF and the CAS peel were removed. The pulp of JF and the tuber of CAS were washed, sliced into pieces, and then subjected to wet milling for starch extraction. All reagents used were of analytical grade. Enzymes: α-amylase (10065-10G; with alpha amylase activity of 30 U/mg), amyloglucosidase (10115-1G-F; with amyloglucosidase activity of 70U/mg) and dry active yeast were purchased from Sigma-Aldrich Germany. Potassium dichromate (99.5%), sulfuric acid (95-97%) and other regents used were of analytical grade purchased from BDH Chemicals, England.
Figure 1. (a) Unripe matured JF, (b) Cassava tuber
2.2 Starch extraction and characterization
The starch extraction process of JF and CAS was done following the procedure reported by Adewumi et al. [16]. The proximate content of the starches was determined based on the Association of Official Analytical Chemists (A.O.A.C., 1990) standard. The amylose content of the starches was determined by the calorimetric iodine affinity procedure adopted by Adewumi et al. [16].
2.3 Experimental design
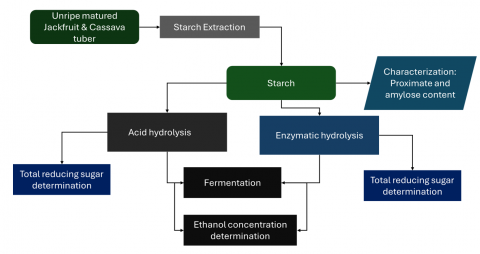
The experimental design was carried out by adopting the method described by Adewumi et al. [3], as presented in Figure 2.
Figure 2. Experimental design for bioethanol production from JF and CAS
2.3.1 Acid hydrolysis procedure
Acid hydrolysis of AHL and cassava starch was carried out in a hydrolysis vessel (autoclave model TT-280A, Techmel, U.S.A). A starch slurry of 1:20 substrates to liquid ratio was made in a 250 ml apparatus at an acid (H2SO4) concentration of 0.25-0.75 moldm-3 and the mixture transferred into the autoclave for hydrolysis at 121℃ for the period of 15-60 minutes. The resultant solution was analyzed for total reducing sugar (TRS) concentration using the DNS method.
2.3.2 Enzymatic hydrolysis procedure
The enzymatic hydrolysis of the starch samples. The reaction conditions for the hydrolysis were α-amylase (60-180 unit/g starch), amyloglucosidase (140-420 unit/g starch) and substrate concentration (15%W/V. The hydrolysis was done in a water bath with a shaker (Shz-88 Thermostatic Digital Shaking Water Bath). The starches were first gelatinized at 90℃ for 10 minutes at a substrate to liquid ratio of 1:10. Thereafter, the mixture was liquefied with 2 ml of different α-amylase activities (60-180 unit/g starch) at 75℃ for 1hour. At the end of the process, the medium temperature was reduced to 55℃ and pH adjusted to 5.0 using 1% HCl. Then, 2 ml of different amyloglucosidase (140-420 unit/g starch) activities was added and saccharification was carried out for further 3 hours at 55℃. The enzyme was deactivated by raising the medium temperature to 100℃. At this point, the solution was allowed to cool and the residue was removed by filtration.
2.3.3 Fermentation of the hydrolysate
The hydrolysate was fermented with Saccharomyces cerevisiae (1g/L) in a media that consists of yeast extract (2 g/L), glucose (2 g/L), peptone (3 g/L) and distilled water making up 1000 ml. The media was supplemented with MgSO4.7H2O (1g/L), NH4Cl (1g/L), KH2PO4 (2 g/L) and CaCl2 (0.1 g/L). Then the broth was subjected to anaerobic conditions at a pH of 5.0, 30℃ for 72 hours.
2.4 Statistical design for acid and enzymatic hydrolysis
Response surface methodology (RSM) implemented using Design Expert software (version 11.0) was used to determine the optimal conditions for both hydrolysis methods. The influence of acid concentration and time for acid hydrolysis, as well as amylase and amyloglucosidase activities for enzymatic hydrolysis on glucose yield (the dependent variable) was evaluated. The glucose yield was examined using three coded levels (-1, 0, +1) of the Central Composite Rotational Design (CCRD), which comprised 13 experimental runs for enzymatic hydrolysis and 12 runs for acid hydrolysis, as presented in Tables 1 and 2. The second-order model designated for predicting the optimum point is expressed in Eq. (1).
Table 1. Coded levels of variable for CCRD for enzymatic hydrolysis
|
Variables |
Units |
Symbols |
Coded Levels |
||
|
-1 |
0 |
+1 |
|||
|
α-Amylase |
Enzyme units |
X1 |
60 |
120 |
180 |
|
Amyloglucosidase |
Enzyme units |
X2 |
140 |
280 |
420 |
Table 2. Coded levels of variables for CCRD for acid hydrolysis
|
Variables |
Units |
Symbols |
Coded Levels |
||
|
-1 |
0 |
+1 |
|||
|
Acid concentration |
Moldm-3 |
X1 |
0.25 |
0.5 |
0.75 |
|
Time |
Minutes |
X2 |
15 |
30 |
60 |
$\begin{array}{r}Y=\beta_0+\sum \beta_1 X_1+\sum \beta_2 X_2+\sum \beta_{12} X_1 X_2 +\sum \beta_{11} X_1^2+\sum \beta_{22} e_2^2+e^2\end{array}$ (1)
where, Y = glucose yield (predicted response), X1 and X2 = variable factors (acid/enzyme concentrations and time), $\beta_0$ is a constant term. $\beta_1$ and $\beta_2$ are the coefficients of the linear terms, $\beta_{12}$ is the coefficient of the cross term, $\beta_{11}$ and $\beta_{22}$ are the coefficients of the quadratic term and ℮ is the error term.
2.5 Analytical methods
2.5.1 Determination of TRS
The TRS of the hydrolyzed samples were analyzed using the 3,5-dinitrosalicylic acid (DNS) method as adopted by Adewumi et al. [3]. The absorbance of glucose standard against sugar concentration of the hydrolyzed samples was determined at 540 nm using a UV-Visible spectrophotometer (Metash UV-5200 spectrophotometer, Shangai Metash Instruments Co Ltd).
2.5.2 Determination of ethanol content by Potassium dichromate method
A combined chromic method of Sayyad et al. [17] and Adewumi et al. [3] was adopted for determining the ethanol content in the broth. Potassium dichromate (0.2 M) in sulfuric acid (4 M) was prepared to analyze 1 ml of 10% ethanol (standard concentration) at 600 nm wavelength using a Metesh UV-5200 spectrophotometer. The absorbance obtained after the color change were recorded against the known concentrations. A similar procedure was utilized to determine the ethanol content in the fermentation broth of the samples. The actual (g/L), percentage (v/v) and fermentation efficiency (%) of the ethanol (EtOH) obtained was determined from the absorbance readings and the yield calculated through the following sets of Eqs. (2)-(6).
$\mathrm{Starch} (1 \mathrm{~g})+\mathrm{H}_2 \mathrm{O} \rightarrow \mathrm{glucose} (1.1 \mathrm{~g})+ \mathrm{ethanol} (0.56 \mathrm{~g})$ (2)
The amount of ethanol (g/L) obtained from the broth was evaluated from the following sets of Eqs. (3)-(6).
$\mathrm{Vol\ of}\ \mathrm{EtOH}\left(\frac{\mathrm{ml}}{100 \mathrm{ml}}\right)=\frac{\mathrm{EC}\left(\% \mathrm{VV}^{-1}\right)}{100 \times \mathrm{AVF}^{-1}(\mathrm{ml})}$ (3)
$\mathrm{Amount\ of\ EtOH} \left(\frac{\mathrm{g}}{100 \mathrm{ml}}\right)=\frac{\text { Vol of EtOH }(\mathrm{ml})}{1 \mathrm{ml} \times \text { Density of EtOH }\left(\mathrm{gml}^{-1}\right)}$ (4)
$\mathrm{Amount\ of\ EtOH} \left(\frac{\mathrm{g}}{100 \mathrm{ml}}\right)=\frac{\text { Mass of EtOH }(\mathrm{g})}{100 \mathrm{ml} \times 1000\left(\mathrm{mlL}^{-1}\right)}$ (5)
where, EC = concentration of ethanol obtained from spectrophotometric absorbance readings, AVF = Actual volume of the fermentation broth. The fermentation efficiency Eq. (6) is calculated from the theoretical ethanol yield obtained from Eq. (2).
$\mathrm{Eff} (\%)=\frac{\text { Actual EtOH yield }\left(\mathrm{gL}^{-1}\right)}{\text { Theoretical EtOH }\left(\mathrm{gL}^{-1}\right)} \times 100$ (6)
2.5.3 Component analysis of the fermentation broth
The compositional content of the broth was estimated with HPLC (Agilent LC System) equipped with an ion-exclusion column (Aminex HPX-87H, Bio-Rad) and, refractive index detector (model 4212). Sulphuric acid concentration of 0.005 M at 60℃ was used as the mobile phase at a flow rate of 0.8 mLmin-1.
3.1 Compositional and morphological analysis of AHL and CAS starches
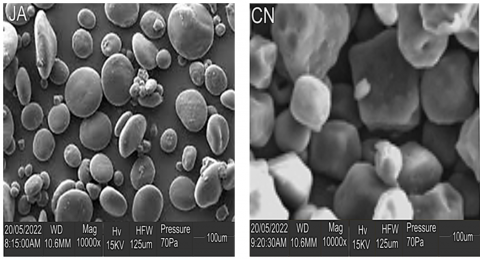
The component analysis of the starches is summarized in Table 3. One of the important parameters that determines the percentage starch conversion to simple sugars is the amylose-amylopectin ratio. The structural variation between amylose (an amorphous linear polymer with 20-30% starch) and amylopectin (a highly branched semi-crystalline polymer with 70 - 80% starch) determines their physicochemical properties and application [18]. Amylose is well known for its high resistance to digestion; however, amylopectin is rapidly broken down due to its high glycemic index. Varghese at al. [18] reported that starches with higher amylose (> 30%) content exhibit lower conversion efficiency, which is attributed to high resistance to enzymes. The results obtained from the current study show that AHL has an amylose content of 28.90 (which is 35.97% of the total carbohydrate content of the starch) while CAS has a 20.43 (23.88% total carbohydrate) with the former expected to be a more resistant starch than the latter. The amylose content of AHL falls within 26.41- 38.24% reported by Zhang et al. [19]. Nevertheless, the high amylose content of AHL did not have a negative impact on the sugar yield in the enzymatic process, whereas a negative impact was observed in the sugar yield in the acidic process. Consequently, AHL was observed to have higher moisture content than CAS. The high moisture content of AHL agrees with the work of Zhang et al. [19], which demonstrates a positive impact on gel formation. The morphological characterization (Figure 3) of the starches with scanning electron microscope (JEOL-JSM-7600F-USA) shows that AHL possesses smooth spherical and smaller size particles that enhance reactivity than CAS with a rough hexagonal structure.
Table 3. Proximate composition of the starches of AHL and cassava
|
Parameters |
AHL |
Cassava |
|
Moisture |
11.20±0.10 |
8.58±0.33 |
|
Ash |
1.20±0.19 |
2.17±0.38 |
|
Protein |
3.34±0.25 |
1.01±0.09 |
|
Fat |
1.75±0.14 |
1.34±0.13 |
|
Carbohydrate |
80.48±0.08 |
85.55±0.12 |
|
Fibre |
2.13±0.15 |
1.30±0.24 |
|
Amylose |
28.90±0.11 |
20.43±0.56 |
Figure 3. SEM image of AHL (JA) and CAS (CN)
3.2 Reducing sugar (glucose) production and optimization
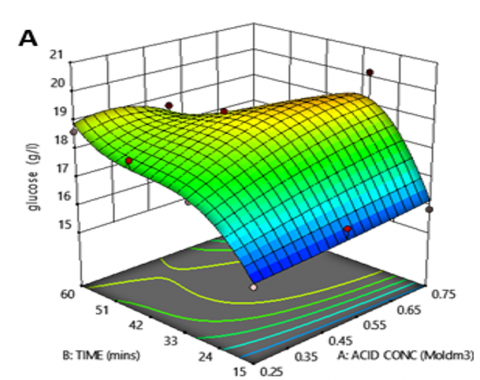
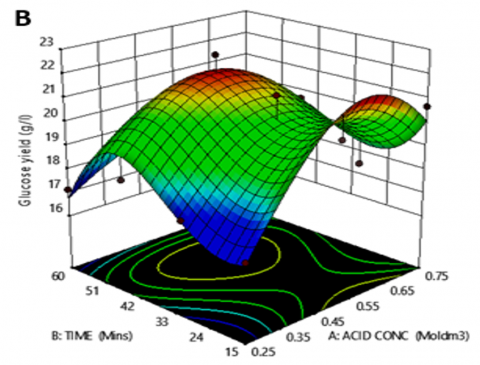
The effects of factors: acid concentration and time on glucose yield were examined during acid hydrolysis of AHL and CAS and the results presented in a 3-dimensional (3D) response surface plot in Figure 4. Lower acid concentration (0.25-0.5 M) and time (15-30 mins) were found to have a positive effect on glucose yield. However, a negative effect on glucose yield was observed at higher concentrations and longer periods of time. The result of the analysis of variance (ANOVA) for the acid hydrolysis of AHL and CAS is presented in Tables 4 and 5. Both results showed the non-suitability of the model as evidenced in the non-significant p-values of 0.0669 and 0.1359, which are lower than the threshold p-value (0.05) in terms of reducing sugar yield.
Figure 4. 3D Response surface plots of time and acid concentration on the glucose yield (g/l) of (A) AHL and (B) CAS starch samples hydrolyzed with H₂SO₄
Table 4. ANOVA for quadratic model of acid hydrolysis of AHL
|
Source |
Sum of Squares |
df |
Mean Square |
F-value |
p-value |
|
|
|
Model |
0.0002 |
5 |
0.0000 |
3.82 |
0.0669 |
not significant |
|
|
A-Acid Conc |
8.650E-07 |
1 |
8.650E-07 |
0.0869 |
0.7780 |
|
|
|
B-Time |
0.0000 |
1 |
0.0000 |
4.88 |
0.0692 |
|
|
|
AB |
0.0000 |
1 |
0.0000 |
4.11 |
0.0891 |
|
|
|
A² |
9.597E-06 |
1 |
9.597E-06 |
0.9647 |
0.3639 |
|
|
|
B² |
0.0001 |
1 |
0.0001 |
9.04 |
0.0238 |
|
|
|
Residual |
0.0001 |
6 |
9.949E-06 |
|
|
|
|
|
Cor Total |
0.0002 |
11 |
|
|
|
|
|
|
Fit Statistics |
Std. dev |
Mean |
C.V(%) |
R² |
Adjusted R² |
Predicted R² |
Adeq. Precision |
|
|
0.0032 |
0.0571 |
5.53 |
0.7607 |
0.5514 |
-0.1465 |
6.1306 |
Table 5. ANOVA for quadratic model of acid hydrolysis of CAS
|
Source |
Sum of Squares |
df |
Mean Square |
F-value |
p-value |
|
|
|
Model |
0.0002 |
5 |
0.0000 |
2.62 |
0.1359 |
not significant |
|
|
A-Acid Conc |
0.0000 |
1 |
0.0000 |
1.77 |
0.2321 |
|
|
|
B-Time |
0.0000 |
1 |
0.0000 |
1.45 |
0.2741 |
|
|
|
AB |
0.0000 |
1 |
0.0000 |
1.11 |
0.3319 |
|
|
|
A² |
0.0001 |
1 |
0.0001 |
6.90 |
0.0392 |
|
|
|
B² |
0.0000 |
1 |
0.0000 |
1.89 |
0.2189 |
|
|
|
Residual |
0.0001 |
6 |
0.0000 |
|
|
|
|
|
Cor Total |
0.0003 |
11 |
|
|
|
|
|
|
Fit Statistics |
Std. Dev |
Mean |
C.V(%) |
R² |
Adjusted R² |
Predicted R² |
Adeq. Precision |
|
|
0.0039 |
0.0533 |
7.27 |
0.6862 |
0.4246 |
-0.1828 |
4.3298 |
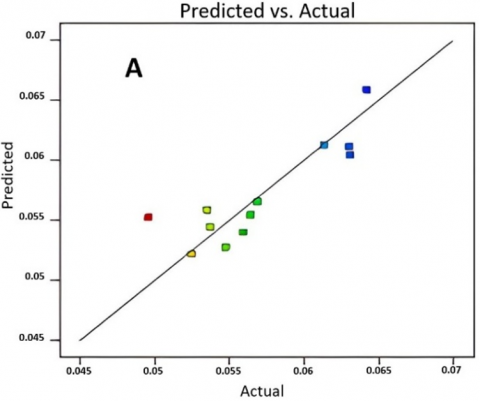
This implies that the impact of the factors: acid concentration and time, was not significant in releasing sufficient sugar yield during the acid process. The two-way (AB) interaction between acid concentration and time also demonstrated large p-values greater than 0.05 for both AHL and CAS. The correlation (R2) value of 0.7607 and 0.6862 implies that the model could only predict a confidence level of 76.07% and 68.62% in the responses of the regions examined for AHL and CAS, respectively. In addition, the difference (greater than 0.2) between the R2 and adjusted R2 demonstrated that the model term or variables are not adequate and require readjustment. The lack of significance of the model is pronounced in the predictive versus actual yield (Figure 5), where data points were observed to fall out of the line of best fit. Bekele Bayu et al. [20] studied the effects of single factors such as acid concentration, temperature, and time on optimum sugar and ethanol yields. Their findings indicated that temperature and time had an overall positive effect, while acid concentration had a negative impact on both sugar and ethanol yields. Similar observations were reported by Ferrer et al. [21] in their study on sulfuric acid hydrolysis of empty palm bunches.
Figure 5. Predicted Vs actual yield of glucose for (A) AHL and (B) CAS after acid hydrolysis
A quadratic model showed the effect of hydrolysis time on total sugar yield, with the maximum glucose yield being achieved at 26 minutes of reaction. Beyond this point, a negative impact on glucose yield was observed. The significant lack of fit in the model, as demonstrated in this study, may be attributed to the degradation of simple sugars into inhibitory by-products such as 5-hydroxymethylfurfural (HMF) and furfural [22, 23]. Studies have shown that increasing reaction conditions accelerates the breakdown of glycosidic linkages, leading to the formation of sugar by-products [3, 22].
The results presented in Figure 4 reveal that the optimum glucose yield was achieved at an acid concentration of 0.5 M and a hydrolysis time of 45 minutes. This yielded 19.05 g/L of glucose with a 34.64% conversion for AHL and 22.48 g/L with a 40.87% conversion for CAS from an initial 50 g/L of starch (Eq. (2)). Thus, the model's prediction aligns with the experimental results, confirming the insignificant effect of further reaction beyond these optimal conditions.
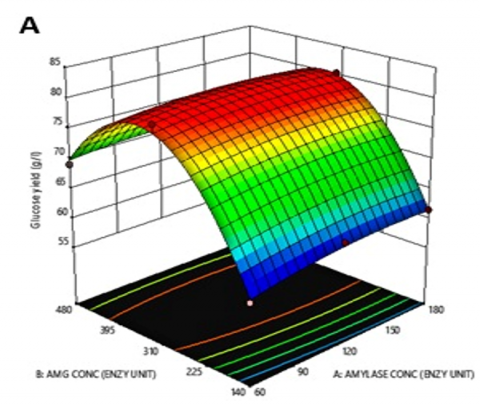
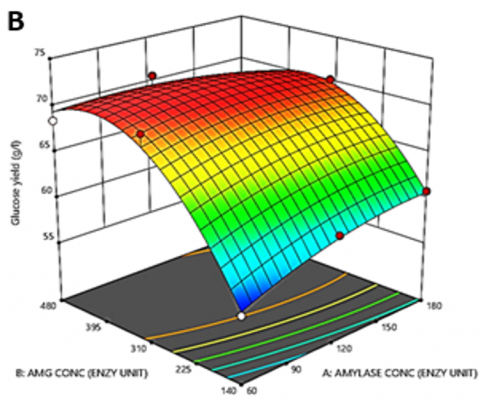
The influence of the factors: amylase and amyloglucosidase activities on glucose yield was estimated during enzymatic hydrolysis of AHL and CAS, as presented in Table 1. The result from the 3D response plot (Figure 6) demonstrated that the factors exerted a positive influence on the glucose yield of AHL and CAS. In all conditions of analysis, the optimum glucose yield was achieved at 120 amylase activity and 310 amyloglucosidase activity, with AHL producing 80.22 g/L sugar with 91.2% conversion efficiency, while CAS produced 70.61 g/L with 80.24% conversion efficiency. The results from ANOVA analysis (Tables 6 and 7) for the enzymatic hydrolysis of AHL and CAS established the suitability and fitness of the quadratic model, as demonstrated by the exceedingly significant p-value of (< 0.0001) for both starches. These values designate a low probability of noise influencing the result.
Figure 6. 3D Response surface plots on the effects of α-amylase and amyloglucosidase concentrations on the glucose yield (g/l) of (A) AHL and (B) CAS starch samples after enzymatic hydrolysis
Table 6. ANOVA fit statistics and point prediction for quadratic model of enzymatic hydrolysis of AHL
|
Source |
Sum of Squares |
df |
Mean Square |
F-value |
p-value |
||||
|
Model |
863.3 |
5 |
172.66 |
245.83 |
< 0.0001 |
Significant |
|||
|
A-AMYLASE CONC |
32.59 |
1 |
32.59 |
3.68 |
0.0964 |
||||
|
B-AMG CONC |
144.94 |
1 |
144.94 |
206.37 |
< 0.0001 |
||||
|
AB |
1.96 |
1 |
1.96 |
0.79 |
0.0087 |
||||
|
A² |
22.61 |
1 |
22.61 |
3.71 |
0.0953 |
||||
|
B² |
278.03 |
1 |
278.03 |
23 |
< 0.0201 |
||||
|
Residual |
54.92 |
9 |
4.7023 |
||||||
|
Lack of Fit |
5.8 |
3 |
1.6 |
0.72 |
0.8511 |
not significant |
|||
|
Pure Error |
0.1213 |
4 |
0.0303 |
||||||
|
Cor Total |
868.22 |
12 |
|||||||
|
Fit Statistics |
Std. dev |
Mean |
C.V(%) |
R2 |
Adjusted R2 |
Predicted R2 |
Adeq. Precision |
||
|
1.8381 |
73.29 |
1.14 |
0.9943 |
0.9863 |
0.9641 |
28.1314 |
|||
|
Point Prediction |
|||||||||
|
Solution 1 of 100 Response |
Predicted Mean |
Predicted Median |
Observed |
Std Dev |
SE Mean |
95% CI low for Mean |
95% CI high for Mean |
95% TI low for 99% Pop |
95% TI high for 99% Pop |
|
Glucose yield |
80.5961 |
80.5961 |
1.838062 |
0.347201 |
79.7751 |
81.4171 |
76.0588 |
85.1334 |
|
Table 7. ANOVA fit statistics and point prediction for quadratic model of enzymatic hydrolysis of CAS
|
Source |
Sum of Squares |
df |
Mean Square |
F-value |
p-value |
||||
|
Model |
863.3 |
5 |
172.66 |
245.83 |
< 0.0001 |
Significant |
|||
|
A-AMYLASE CONC |
32.59 |
1 |
32.59 |
3.68 |
0.0964 |
||||
|
B-AMG CONC |
144.94 |
1 |
144.94 |
206.37 |
< 0.0001 |
||||
|
AB |
1.96 |
1 |
1.96 |
0.79 |
0.0087 |
||||
|
A² |
22.61 |
1 |
22.61 |
3.71 |
0.0953 |
||||
|
B² |
278.03 |
1 |
278.03 |
23 |
< 0.0201 |
||||
|
Residual |
54.92 |
9 |
4.7023 |
||||||
|
Lack of Fit |
5.8 |
3 |
1.6 |
0.72 |
0.8511 |
not significant |
|||
|
Pure Error |
0.1213 |
4 |
0.0303 |
||||||
|
Cor Total |
868.22 |
12 |
|||||||
|
Fit Statistics |
Std. dev |
Mean |
C.V(%) |
R2 |
Adjusted R2 |
Predicted R2 |
Adeq. Precision |
||
|
1.8381 |
73.29 |
1.14 |
0.9943 |
0.9863 |
0.9641 |
28.1314 |
|||
|
Point Prediction |
|||||||||
|
Solution 1 of 100 Response |
Predicted Mean |
Predicted Median |
Observed |
Std Dev |
SE Mean |
95% CI low for Mean |
95% CI high for Mean |
95% TI low for 99% Pop |
95% TI high for 99% Pop |
|
Glucose yield |
80.5961 |
80.5961 |
1.838062 |
0.347201 |
79.7751 |
81.4171 |
76.0588 |
85.1334 |
|
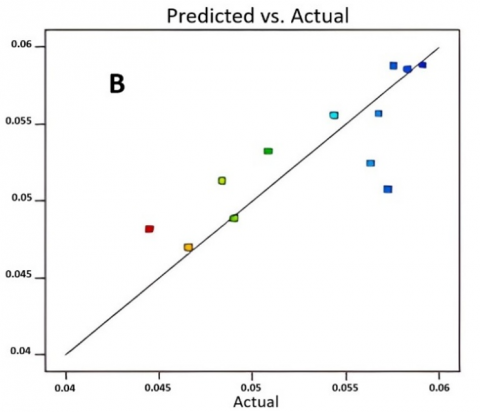
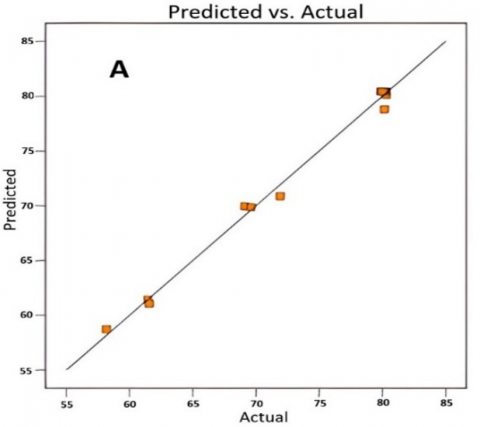
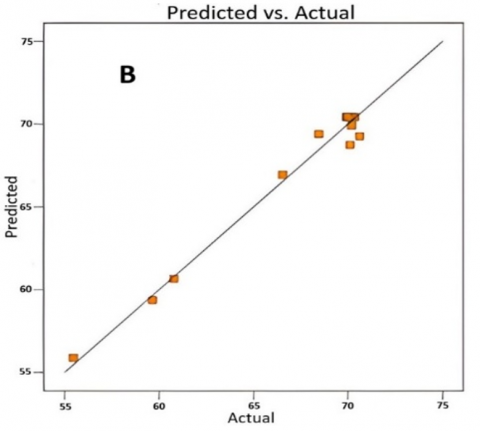
The factors: amylase (A), amyloglucosidase (B), have a significant impact on enhancing the sugar yield in both starches. However, amyloglucosidase was observed to have a more significant impact on sugar yield than amylase. The two factor (Two-way) interaction AB, A2, and B2 all had a significant impact on the yield of sugar with p-value lower than the threshold p-value (< 0.05). High correlation (R2 with adjusted R2) values of 0.9943 (0.9863) and 0.9816 (0.9684) for AHL and CAS, respectively, obtained in the analysis (Tables 6 and 7), show that the model adequately represents the experimental values, which established a correlation between the variables investigated. An R2 value of 0.9943 and 0.9816 specifies that the model could predict 99.4% and 98.2% confidence levels in the response within the region examined. Predicted vs actual plot (Figure 7) further established the fitness of the model in predicting the conditions of optimum sugar yield for both AHL and CAS.
Figure 7. Predicted Vs actual yield of glucose for (A) AHL and (B) CAS after enzymatic hydrolysis
3.3 Comparison of reducing sugar (glucose) and ethanol yield of AHL and CAS
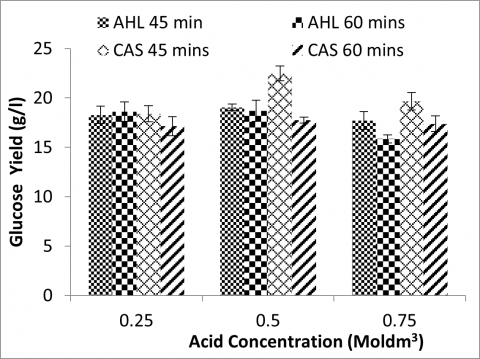
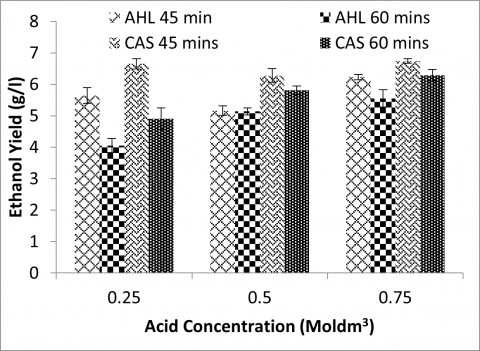
Figures 8 and 9 compare the glucose and ethanol yields of AHL and CAS from the acid hydrolysis process. They show that CAS produced higher glucose and ethanol yields than AHL under the given hydrolysis conditions. The maximum glucose yields of 19.05 g/L for AHL and 22.48 g/L for CAS were obtained at 0.5 M acid concentration and 45 minutes of hydrolysis time. Similarly, the maximum ethanol yields were 6.23 g/L for AHL and 6.74 g/L for CAS. It was observed that ethanol yield decreases when the glucose concentration exceeds the threshold of 20.0 g/L, likely due to the inhibition of the fermentative enzyme (yeast) by inhibitory substances such as hydroxymethylfurfural (HMF), phenolic compounds, and acidic compounds generated during acid hydrolysis [20, 22]. Key conditions such as time, temperature, and acid concentration determine the overall yield of reducing sugars and ethanol during acid hydrolysis. An increase in these conditions is known to favor the production of furfural, HMF, and other compounds like clavulanic, acetic, and formic acids, which inhibit yeast action and reduce ethanol yield [3, 24]. In this study, it was observed that sugar yield decreases above 0.5 M acid concentration and 45 minutes of hydrolysis time. Additionally, the amylose-amylopectin content of each starch (as shown in Table 3) may also be a factor in the lower conversion efficiency of AHL compared to CAS. The lower conversion of AHL to glucose aligns with the findings of Varghese et al. [18], who reported that starches with higher amylose content are more resistant to catalysts, thus leading to lower conversion efficiency.
Figure 8. Reducing sugar (glucose) yield of AHL and CAS after 45-60 mins of acid hydrolysis
Figure 9. Ethanol yield of AHL and CAS after 45-60 mins of acid hydrolysis
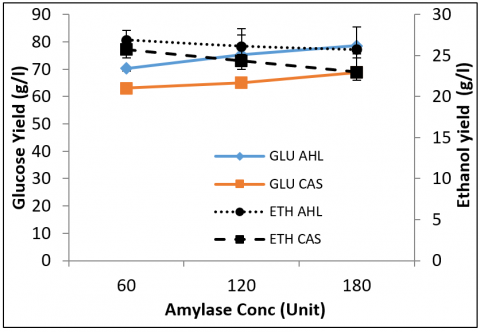
Consequently, the reverse was the case for both reducing sugar and ethanol yields in AHL and CAS during the enzymatic hydrolysis process. Under all conditions of hydrolysis (involving amylase and amyloglucosidase activities), AHL produced higher yields of both reducing sugar and ethanol compared to CAS (Figures 10 and 11). Specifically, among the conditions analyzed, AHL produced a sugar yield of 78.54 g/L, while CAS yielded 68.84 g/L.
Figure 10. Glucose and ethanol yield of AHL and CAS after enzymatic hydrolysis at 280 amyloglucosidase unit
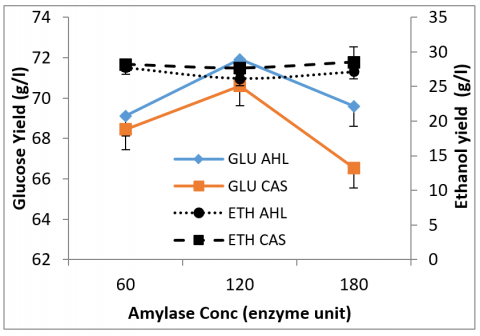
Figure 11. Glucose and ethanol yield of AHL and CAS after enzymatic hydrolysis at 480 amyloglucosidase unit
Corresponding ethanol yields were 26.88 g/L for AHL and 25.73 g/L for CAS, respectively, at 180 amylase and 280 amyloglucosidase activities. At 120 amylase and 480 amyloglucosidase activities, AHL also produced higher glucose and ethanol yields, with 71.92 g/L of glucose and 28.54 g/L of ethanol, compared to the 70.61 g/L of glucose and 27.12 g/L of ethanol produced by CAS. The ethanol conversion efficiency obtained in this study is compared (Table 8) with the percentage conversion of other studies on JF, and the results are compared very favorably. Native starches with higher amylose content have been reported to be resistant to hydrolysis by α-amylase enzymes [25, 26]. However, the results obtained in this study showed that AHL, despite having a higher amylose content, produced a higher sugar yield than CAS (Table 3) during the enzymatic process, countering this previous report. Further studies have shown that factors other than amylose content significantly impact the enzymatic hydrolysis of starches.
Table 8. Comparison of bioethanol yield and percentage conversion from AHL from different literatures
|
Jackfruit Part |
Method of Hydrolysis |
Reducing Sugar Yield |
Ethanol Yield (% Conversion) |
References |
|
Pulp starch |
Acid (H2SO4) Enzymatic (α-amylase and AMG) |
19.05 g/L 80.22 g/L |
6.23 g/L (64%) 33.86 g/L (82.6%) |
This work |
|
Pulp starch |
Enzymatic (Diatase) |
1.12 mg/ml |
0.98 mg/ml (86.5%) |
[27] |
|
Seed starch |
Immobilization |
180 g/L |
89.15 g/L (96.92%) |
[28] |
|
Seed starch |
Acid (H2SO4) |
(75 %) |
(57 %) |
[29] |
|
Seed (stone) starch |
Acid (HCl) Enzymatic (α-amylase) |
(17.36 %) (33.15%) |
(11%) (13.4%) |
[30] |
|
Seed starch (36% starch) |
Enzymatic (Rice cake starter) |
NA |
(11.5%) |
[31] |
One such factor is the crystalline type of starch (type A, B, or C), which plays a crucial role in hydrolysis [26]. Tester et al. [32] reported that type-B starches are more resistant to enzymatic hydrolysis compared to type-A starches. Most cereal starches, such as rice and wheat, are type-A, while tuber starches like cassava and potatoes are type-B. According to Wong et al. [33], JF (AHL) seed starch, with an amylose content of 25%, had a type-A crystal structure like rice, while potato starch, with 17% amylose content, had a type-B crystal structure. This finding was confirmed by Khang et al. [34], who also reported that AHL starch contains a type-A crystal structure. Therefore, the higher sugar yield obtained by AHL in this study may not solely be due to its amylose content but primarily due to its type-A crystalline structure, which is more easily hydrolyzed by α-amylase compared to the type-B structure of cassava starch. Type-A starches have a double helical structure with amylopectin chains packed in a parallel manner. This structure influences enzymes (α-amylase and amyloglucosidase) binding, accessibility and activity, thereby cleaving the glycosidic bonds, hence releasing short chain sugars. The efficiency of enzymes on type-A starches improves both sugar and ethanol yield.
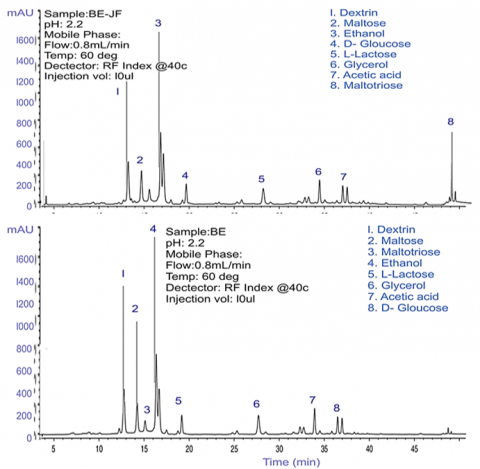
To further understand the efficiency of conversion, the broth was characterized with HPLC (Figure 12) and the result revealed higher ethanol content however, the presence of dextrins, maltose and maltotrioses may suggest either incomplete conversion due to reduced activity of the fermenting microorganism (as exhibited by less than 85% conversion obtained in this work) or higher yeast concentration may have increased yield. Adewumi et al. [3] reported that substrate concentration has a negative impact on ethanol percentage conversion. This observation thus shows that overcoming the challenge of substrate concentration would increase the percentage conversion to ethanol.
Figure 12. HPLC analysis of CAS (BE) and AHL (BE-JF) in the fermentation broth after hydrolysis at 120 amylase and 280 amyloglucosidase units
3.4 Sustainability of bioethanol production
The competitiveness of bioethanol as a cleaner fuel alternative to fossil fuels can only be sustained if feedstocks with higher conversion efficiencies are utilized or if technologies that improve efficiency and reduce inhibition are developed. First-generation bioethanol sources (such as corn, cassava, wheat, and sugarcane) have provided sustainability but are hindered by the food-versus-fuel debate. Meanwhile, second-generation (lignocellulose) and third-generation (algae) bioethanol face challenges such as low yield, inhibition, and high production costs [4, 35]. These issues have prompted many governments to implement initiatives aimed at advancing and maximizing biofuel production [1], with a focus on sourcing crops that do not threaten national food security. Recent developments in the bioethanol industry have seen the use of corn in the U.S.A., sugarcane and sugar bagasse in Brazil, wheat and barley in Europe, and cassava and barley in China and Taiwan [4, 36]. Nigeria’s bioethanol industry, however, remains in its infancy, with most bioethanol still imported. Although cassava, corn, and sugarcane have been identified by the Nigerian government as potential bioethanol feedstocks, the sustainability and availability of these crops present challenges, as they are also vital food sources [37, 38]. The high cost of these feedstocks in the market further complicates matters [39]. Itam et al. [40] noted that the marginal cost and return analysis for cassava production per hectare stands at ₦77,500, with high costs attributed to input expenses and a lack of awareness among farmers (both adopters and non-adopters) of improved cassava varieties. As a result, alternative feedstocks that can boost bioethanol production without threatening food security in Nigeria are currently being sought. JF (AHL) is not a major food crop in Nigeria, with many trees growing wild, making it an ideal candidate for bioethanol production without negatively impacting food security. AHL is one of the largest edible fruits, belonging to the Moraceae family. It is native to the Western Ghats in India but is grown in many tropical and subtropical regions worldwide [16, 41]. A mature JF can weigh between 10-20 kg, and when ripe, it contains an edible yellowish pulp and 100-500 seeds [19]. JF trees are reported to produce 50-80 tons of fruit per hectare, with each mature tree yielding up to 700 fruits annually, each weighing between 0.5-50 kg [42]. Panthak et al. [43] identified AHL as an underutilized crop with a carbohydrate content exceeding 76.1%, along with secondary metabolites of medicinal significance. The study highlighted AHL’s potential when converted into bioproducts such as biofuels and bioplastics, making it a sustainable and readily available raw material for industrial production.
This research has revealed the ethanol yielding potential of AHL, which encourages feedstock diversification and boosts bioethanol production, it is imperative, however, to address concerns about the potential impact of large-scale harvesting of AHL for bioethanol production on the ecological environment and biodiversity. It is paramount to increase AHL cultivation and increase feedstock production. Moreso, biodiversity conservation strategies should be developed, such as; implementation of crop management and establishment of protected areas of cultivation for genetic diversity preservation. In addition, a sustainable harvesting practice should be encouraged to minimize harm to the ecosystem and ensure the long-term viability of JF feedstock for bioethanol production.
On the other hand, considerations on the circular economic concept, exploring conversion pathways for by-products of the hydrolysis such as hydroxymethylfurfurals (HMF), acetic acids, and unconverted carbohydrates (dextrins) for the production of high-valued products such as 2,5-Furandicarboxylic acid (FDCA), a monomer for the production of polyethylene furanoate (PEF), which serves as a sustainable alternative to polyethylene plastics. Acetic acid can also be converted to valuable products esters, polyesters, biogas and pharmaceutical products. Also, the unconverted carbohydrates can be used for the production of biocomposites, animal feed additives, or as organic fertilizers. Overall, the implementation of these strategies coupled with the conversion efficiency of AHL would have a significant impact on the socio-economic development of the entire country or region.
Readily available, renewable, and sustainable feedstock with high conversion efficiency for bioethanol production is very desirable. This use of JF as a sustainable feedstock for bioethanol production was optimized in this study using CCRD of RSM, with CAS as a comparison. The results showed that AHL pulp starch yielded 80.22 g/L of reducing sugar, compared to 70.61 g/L from CAS starch, with conversion rates of 91.2% and 80.24%, respectively, during the enzymatic hydrolysis process. These findings highlight AHL's potential as a substitute for cassava in bioethanol production. Response surface optimization predicted the model’s significance, with R² values of 0.9943 for AHL and 0.9816 for CAS. The optimum glucose yield was obtained under conditions of 120 amylase and 310 amyloglucosidase units per gram of starch during enzymatic hydrolysis, whereas the model for acid hydrolysis was not significant, with R2 values of 0.7607 and 0.6862 for AHL and CAS, respectively. Although AHL is characterized by a higher amylose content that typically limits enzyme accessibility during hydrolysis, its type-A crystal structure makes its starch more easily hydrolysed by α-enzymes, aided by its high carbohydrate composition. Additionally, the bioethanol yield from AHL was comparable to that from CAS, making it a suitable alternative to cassava or other first-generation feedstocks for bioethanol production. Overall, using AHL as a feedstock could ensure the sustainability of bioethanol production without negatively impacting food security, particularly in Nigeria, which is in line with the sustainable development goals seven (SDG 7) on affordable and clean energy and SDG 13 on climate action.
[1] Perumal, P.K., Patel, A.K., Singhania, R.R., Saini, R., et al. (2024). Harnessing Ulva ohnoi for eco-friendly bioethanol production via hydrothermal pretreatment. Journal of the Taiwan Institute of Chemical Engineers, 164: 105662. https://doi.org/10.1016/j.jtice.2024.105662
[2] Sokan-Adeaga, A.A., Salami, S.A., Bolade, D.O., Aledeh, M., et al. (2024). Utilization of local corn (Zea Mays) wastes for bioethanol production by separate hydrolysis and fermentation. Journal of Hazardous Materials Advances, 15: 100447. https://doi.org/10.1016/j.hazadv.2024.100447
[3] Adewumi, C.N., Ekpo, E.I., Achugasim, O., Ogali, R.E., Akaranta, O. (2022). Substrate concentration: A more serious consideration than the amount of 5-hydroxymethylfurfural in acid-catalyzed hydrolysis during bioethanol production from starch biomass. Heliyon, 8(12): e12047. https://doi.org/10.1016/j.heliyon.2022.e12047
[4] Hou, J., Zhang, Q., Tian, F., Liu, F., et al. (2024). Structure changes of lignin and their effects on enzymatic hydrolysis for bioethanol production: A focus on lignin modification. Journal of Biotechnology, 393: 61-73. https://doi.org/10.1016/j.jbiotec.2024.07.012
[5] Pradyawong, S., Juneja, A., Sadiq, M.B., Noomhorm, A., Singh, V. (2018). Comparison of cassava starch with corn as a feedstock for bioethanol production. Energies, 11(12): 3476. https://doi.org/10.3390/en11123476
[6] Hu, G., Heitmann, J.A., Rojas, O.J. (2008). Feedstock pretreatment strategies for producing ethanol from wood, bark, and forest residues. BioResources, 3(1): 270-294. http://doi.org/10.15376/biores.3.1.270-294
[7] Gupta, P.K., Basu, S., Rana, V., Malik, S., Panchadhyayee, A. (2024). Utilization of non-concentrated banana pseudostem sap waste for converting to bioethanol: In vitro and in silico evidence. Waste Management Bulletin, 2(3): 109-119. https://doi.org/10.1016/j.wmb.2024.07.002
[8] Kurambhatti, C.V., Kumar, D., Rausch, K.D., Tumbleson, M.E., Singh, V. (2018). Increasing ethanol yield through fiber conversion in corn dry grind process. Bioresource Technology, 270: 742-745. https://doi.org/10.1016/j.biortech.2018.09.120
[9] Mahapatra, S., Kumar, D., Singh, B., Sachan, P.K. (2021). Biofuels and their sources of production: A review on cleaner sustainable alternative against conventional fuel, in the framework of the food and energy nexus. Energy Nexus, 4: 100036. https://doi.org/10.1016/j.nexus.2021.100036
[10] Triwahyuni, E., Sudiyani, Y., Abimanyu, H. (2015). The effect of substrate loading on simultaneous saccharification and fermentation process for bioethanol production from oil palm empty fruit bunches. Energy Procedia, 68: 138-146. https://doi.org/10.1016/j.egypro.2015.03.242
[11] Jelani, F., Walker, G., Akunna, J. (2023). Effects of thermo-chemical and enzymatic pre-treatment of tropical seaweeds and freshwater macrophytes on biogas and bioethanol production. International Journal of Environmental Science and Technology, 20(12): 12999-13008. https://doi.org/10.1007/s13762-023-04843-7
[12] Tambat, V.S., Patel, A.K., Singhania, R.R., Vadrale, A.P., et al. (2023). Sustainable mixotrophic microalgae refinery of astaxanthin and lipid from Chlorella zofingiensis. Bioresource Technology, 387: 129635. https://doi.org/10.1016/j.biortech.2023.129635
[13] Ogbonna, C.N., Okoli, E.C. (2013). Economic feasibility of on-farm fuel ethanol production from cassava tubers in rural communities. African Journal of Biotechnology, 12(37): 5618-5626. http://doi.org/10.5897/AJB2013.12855
[14] Pervez, S., Aman, A., Iqbal, S., Siddiqui, N.N., Ul Qader, S.A. (2014). Saccharification and liquefaction of cassava starch: An alternative source for the production of bioethanol using amylolytic enzymes by double fermentation process. BMC Biotechnology, 14(1): 49. https://doi.org/10.1186/1472-6750-14-49
[15] Wangpor, J., Prayoonyong, P., Sakdaronnarong, C., Sungpet, A., Jonglertjunya, W. (2017). Bioethanol production from cassava starch by enzymatic hydrolysis, fermentation and ex-situ nanofiltration. Energy Procedia, 138: 883-888. https://doi.org/10.1016/j.egypro.2017.10.116
[16] Adewumi, C.N., Achugasim, O., Ogali, R.E., Akaranta, O. (2019). Physicochemical characterization of starch from unripe Artocarpus heterophyllus Lam pulp as a low-cost starch source for oilfield applications. In SPE Nigeria Annual International Conference and Exhibition, Lagos, Nigeria, p. D033S027R008. https://doi.org/10.2118/198746-MS
[17] Sayyad, S.F., Chaudhari, S.R., Panda, B.P. (2015). Quantitative determination of ethanol in arishta by using UV-visible spectrophotometer. Pharmaceutical and Biological Evaluations, 2(5): 204-207. https://www.researchgate.net/profile/Sadikali-Sayyad/publication/288380556.
[18] Varghese, S., Awana, M., Mondal, D., Rubiya, M.H., et al. (2022). Amylose–amylopectin ratio: Comprehensive understanding of structure, physicochemical attributes, and applications of starch. In: Thomas, S., AR, A., Jose Chirayil, C., Thomas, B. (eds) Handbook of Biopolymers,. https://doi.org/10.1007/978-981-16-6603-2_48-1
[19] Zhang, Y., Zhang, Y., Xu, F., Li, S., Tan, L. (2018). Structural characterization of starches from Chinese Jackfruit seeds (Artocarpus heterophyllus Lam). Food Hydrocolloids, 80: 141-148. https://doi.org/10.1016/j.foodhyd.2018.02.015
[20] Bekele Bayu, A., Abeto Amibo, T., Beyan, S.M. (2022). Process optimization for acid hydrolysis and characterization of bioethanol from leftover injera waste by using response surface methodology: Central composite design. International Journal of Analytical Chemistry, 2022(1): 4809589. https://doi.org/10.1155/2022/4809589
[21] Ferrer, A., Requejo, A., Rodríguez, A., Jiménez, L. (2013). Influence of temperature, time, liquid/solid ratio and sulfuric acid concentration on the hydrolysis of palm empty fruit bunches. Bioresource Technology, 129: 506-511. https://doi.org/10.1016/j.biortech.2012.10.081
[22] Amenaghawon, N.A., Ogbeide, S.E., Okieimen, C.O. (2014). Application of statistical experimental design for the optimisation of dilute sulphuric acid hydrolysis of cassava Bagasse. Acta Polytechnica Hungarica, 11(9): 239-250. http://doi.org/10.12700/APH.11.09.2014.09.14
[23] Megala, S., Rekha, B., Saravanathamizhan, R. (2020). Chemical and non-chemical pre-treatment techniques for bio ethanol production from biomass. International Journal of Energy and Water Resources, 4(2): 199-204. https://doi.org/10.1007/s42108-020-00064-7
[24] Saini, R., Singhania, R.R., Patel, A.K., Chen, C.W., et al. (2024). Sustainable production of cellulose and hemicellulose-derived oligosaccharides from pineapple leaves: Impact of hydrothermal pretreatment and controlled enzymatic hydrolysis. Bioresource Technology, 398: 130526. https://doi.org/10.1016/j.biortech.2024.130526
[25] Tester, R.F., Karkalas, J., Qi, X. (2004). Starch structure and digestibility enzyme-substrate relationship. World's Poultry Science Journal, 60(2): 186-195. https://doi.org/10.1079/WPS200312
[26] Li, J.H., Vasanthan, T., Hoover, R., Rossnagel, B.G. (2004). Starch from hull-less barley: V. In-vitro susceptibility of waxy, normal, and high-amylose starches towards hydrolysis by alpha-amylases and amyloglucosidase. Food Chemistry, 84(4): 621-632. https://doi.org/10.1016/S0308-8146(03)00287-5
[27] Debajyoti Bose, D.B., Srija Basu, S.B., Hiranmay Gangopadhyay, H.G. (2010). Production of bio-alcohol utilizing Jackfruit wastes. Journal of Mycopathological research, 48(2): 365-369. https://doi.org/10.5555/20133277173
[28] Bahlawan, Z.A.S., Megawati, M., Damayanti, A., Putri, R.D.A., et al. (2022). Immobilization of Saccharomyces cerevisiae in Jackfruit (Artocarpus heterophyllus) seed fiber for bioethanol production. ASEAN Journal of Chemical Engineering, 22(1): 156-167. http://doi.org/10.22146/ajche.69781
[29] Arif, A.R., Natsir, H., Rohani, H., Karim, A. (2018). Effect of pH fermentation on production bioethanol from Jackfruit seeds (Artocarpus heterophyllus) through separate fermentation hydrolysis method. Journal of Physics: Conference Series, 979: 012015. http://doi.org/10.1088/1742-6596/979/1/012015
[30] Nuriana, W. (2015). Ethanol synthesis from Jackfruit (Artocarpus Heterophyllus Lam.) stone waste as renewable energy source. Energy Procedia, 65: 372-377. https://doi.org/10.1016/j.egypro.2015.01.066
[31] Chongkhong, S., Lolharat, B., Chetpattananondh, P. (2012). Optimization of ethanol production from fresh Jackfruit seeds using response surface methodology. Journal of Sustainable Energy & Environment, 3(3): 97-101. https://jseejournal.com/media/126/attachment/Optimization%20of%20Ethanol%20Production%20pp.97-101.pdf.
[32] Tester, R.F., Qi, X., Karkalas, J. (2006). Hydrolysis of native starches with amylases. Animal Feed Science and Technology, 130(1-2): 39-54. https://doi.org/10.1016/j.anifeedsci.2006.01.016
[33] Wong, K.T., Poh, G.Y.Y., Goh, K.K.T., Wee, M.S.M., Jeyakumar Henry, C. (2021). Comparison of physicochemical properties of Jackfruit seed starch with potato and rice starches. International Journal of Food Properties, 24(1): 364-379. https://doi.org/10.1080/10942912.2021.1885439
[34] Khang, V.C., Thanh, V.T., Nhan, N.P.T., Nhi, T.Y., et al. (2020). Physico-chemical evaluation of Jackfruit seed starch and its application in cupcake. IOP Conference Series: Materials Science and Engineering, 991(1): 012031. https://doi.org/10.1088/1757-899X/991/1/012031
[35] Wang, K., Tester, J.W. (2023). Sustainable management of unavoidable biomass wastes. Green Energy and Resources, 1(1): 100005. https://doi.org/10.1016/j.gerr.2023.100005
[36] Devi, A., Singh, A., Bajar, S., Pant, D., Din, Z.U. (2021). Ethanol from lignocellulosic biomass: An in-depth analysis of pre-treatment methods, fermentation approaches and detoxification processes. Journal of Environmental Chemical Engineering, 9(5): 105798. https://doi.org/10.1016/j.jece.2021.105798
[37] Abila, N. (2014). Biofuels adoption in Nigeria: Attaining a balance in the food, fuel, feed and fibre objectives. Renewable and Sustainable Energy Reviews, 35: 347-355. https://doi.org/10.1016/j.rser.2014.04.011
[38] Adewuyi, A. (2020). Challenges and prospects of renewable energy in Nigeria: A case of bioethanol and biodiesel production. Energy Reports, 6: 77-88. https://doi.org/10.1016/j.egyr.2019.12.002
[39] Adewumi, C.N., James, J., Ogwuda, U.A., Ezebuiro, V. (2024). Chemical modification and characterization of starches from soursop as potential water based drilling fluid additives. Journal of Petroleum Science and Technology, 14(1): 31-41. https://doi.org/10.22078/jpst.2024.5331.1918
[40] Itam, K.O., Ajah, E.A., Udoeyop, M.J. (2018). Comparative cost and return analysis of cassava production by adopters and non-adopters of improved cassava varieties among farmers in Ibesikpo Asutan LGA, Akwa Ibom State, Nigeria. Global Journal of Agricultural Sciences, 17(1): 33-41. https://doi.org/10.4314/gjass.v17i1.4
[41] Sreeletha, A.1., Lini, J., Dhanyalekshmi, C.S., Sabu, K.R., Pratap, C.R. (2017). Phytochemical, proximate, antimicrobial, antioxidant and FTIR analyses of seeds of Artocarpus heterophyllus Lam. Advances in Biotechnology and Microbiology, 5(1): 555-653. http://doi.org/10.19080/AIBM.2017.05.555653
[42] Ndyomugyenyi, E.K., Okot, M.W., Mutetikka, D. (2014). Characterization of the chemical composition of raw and treated Jackfruit (Artocarpus heterophyllus) and java plum (Syzygium cumini) beans for poultry feeding. Journal of Animal Science Advances, 4(11): 1101-1109. http://doi.org/10.5455/jasa.20141113124747
[43] Pathak, N., Singh, S., Singh, P., Singh, P.K., et al. (2022). Valorization of Jackfruit waste into value added products and their potential applications. Frontiers in Nutrition, 9: 1061098. https://doi.org/10.3389/fnut.2022.1061098