Rana T. Shibli*![]() | Kamail H. Al-Sowdani
| Kamail H. Al-Sowdani![]()
© 2025 The authors. This article is published by IIETA and is licensed under the CC BY 4.0 license (http://creativecommons.org/licenses/by/4.0/).
OPEN ACCESS
This study describes the development of a fully automated microfluidic spectrophotometric system for detecting various pollutants, including nitrite, in the Shatt al-Arab River in the Basra governorate of southern Iraq. The proposed system offers a simple, effective, and efficient analytical approach characterized by high sample throughput, low reagent consumption, and minimal sample volume requirements. The custom-fabricated microfluidic chip has a total volume capacity of 25 μL and a length of 10cm. It consisted of three microchannels, two channels with individual volumes of 10 μL, and the third with a volume of 5μL. Three Arduino-controlled peristaltic pumps were employed, supported by in-house developed software to control the flow rates of both reagent introduction and sample loading. Data acquisition was performed by recording peak heights corresponding to sample concentrations using the Microsoft Excel 2016 program. Application of the system to real samples from the Shatt Al-Arab River revealed the nitrite concentration ranging from 0.006 to 0.06 μg mL-1. The method demonstrated a detection limit of 1×10(-4) μgmL-1 and exhibited excellent precision, with a relative standard deviation (RSD%) of 0.379% for ten replicate measurements at a concentration of 0.1 μg/mL. Linearity was established in the range of (0.01-0.1) μgmL-1, yielding a correlation coefficient (R2) of 0.9998 based on ten data points. Each analysis of a sample required only 50µl of reagents, resulting in a total reagent consumption of 30 mL for 600 analyses within an hour. Consequently, this system is eco-friendly due to its minimal waste levels.
microfluidic, a fully automated, environmental pollution, spectrophotometric, nitrite concentration
Water pollution is considered one of the most serious threats to living organisms, particularly to human health. Elevated concentrations of nitrite ions are among the common toxic indicators found in water. Thus, measuring nitrite levels is a key parameter in assessing water quality, making it one of the essential analyses routinely conducted by water quality specialists [1]. To investigate the sources of nitrite pollution in water, it has been found that it can originate from natural processes such as rain and biological denitrification. However, a significant source of nitrite contamination is industrial waste. When industrial effluents are not properly treated and are discharged–either directly or indirectly–into water bodies, they can severely degrade water quality [2]. As humans are continuously exposed to food and water that may contain elevated levels of nitrite, these ions can accumulate in the body over time, potentially leading to adverse health effects. Therefore, monitoring nitrite concentrations serves as an important indicator of environmental pollution. This monitoring is essential for promoting sustainable public health and mitigating potential health risks [3]. Consequently, various analytical methods are employed to determine nitrite levels, including colorimetric techniques, spectrophotometric, and chromatographic methods [4-6]. Although traditional methods offer several advantages, they also have notable drawbacks. These include susceptibility to ionic interference, the time-consuming nature of the analytical procedures, and the need for expensive and sophisticated equipment [7]. As a result, a recent trend in quantitative analysis focuses on determining concentrations using newly developed laboratory devices and processes integrated into compact, unique miniaturized platforms. these systems aim to simplify chemical analysis by reducing the number of procedural steps, thereby enhancing efficiency, portability, and cost effectiveness [8]. This approach is known as a microfluidic system or Lab-on-a-Chip (LOC). Recent technological advancements in this field enable the precise manipulation of tiny fluid volumes- typically in the micro- to picolitre [9] range-within microscale channels. These automated systems integrate various laboratory operations onto a single chip, including mixing, handling chemical reagents, and waste management. As a result, they provide a streamlined reaction process characterized by reduced operational costs, high accuracy, enhanced sensitivity, and minimal reagent consumption [10, 11]. Furthermore, this technique enables the use of standard laboratory materials, reagents, and samples, while allowing for efficient mixing, reaction, and separation processes-all within a compact and controlled environment [12]. Microfluidic techniques are applied across various scientific fields, including physics, nanotechnology, chemistry, biochemistry, and biology. These interdisciplinary applications enhance researchers' capabilities in effectively analyzing and controlling fluid control flow behavior at the microscale [13]. One notable example is the use of specialized microchip designs to detect and distinguish cancerous cells from healthy blood cells, demonstrating the potential of microfluidics in advanced biomedical diagnostics [14]. Recently, a new generation of microfluidic technology has been employed for monitoring water pollution, specifically for detecting soluble silicate in seawater. In addition, sensors have been integrated to measure various nutrients, including nitrate, nitrite, phosphate, and manganese (Mn), among others, enabling comprehensive and efficient environmental analysis [15]. Although this work is not entirely original, it builds upon and extends previous research [16]. Other methods differ in detection limits, often requiring a greater number of pumps and higher sample volumes. Additionally, they generally involve increased reagent consumption and lower sample throughput per hour, especially when compared to the microfluidic device developed in this study [17]. This system offers a simple, effective, and efficient solution with high sample throughput, low reagent consumption, and minimal sample volume requirements compared to other methods. The fully automated microfluidic system developed in this study effectively determines nitrite levels in various water samples. The aim was to create a user-friendly, cost-effective, and environmentally sustainable system without relying on complex actuation devices. The integration of these features makes microfluidic systems highly appealing for monitoring chemical species in aquatic environments. Accordingly, the proposed system is employed to measure nitrite concentration at various locations along the Shatt Al-Arab River.
2.1 Reagents and chemicals
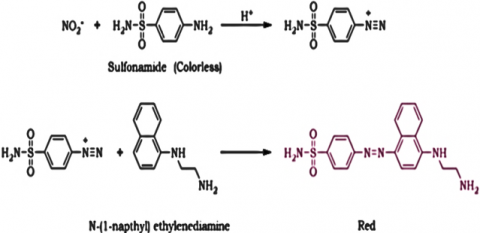
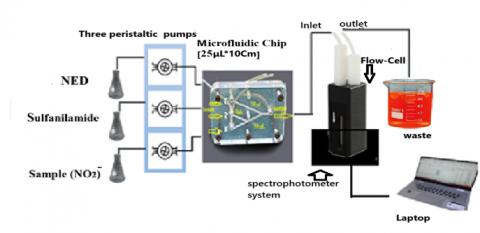
Deionized water (DI) was used for the preparation of all solutions, and all reagents were of high analytical grade. Standard stock solution with a concentration of 100 μgmL-1 was prepared by dissolving 0.15 g of sodium nitrite, NaNO2 in 1000 mL of deionized water. This stock solution was then serially diluted to obtain standard solutions with concentrations ranging from 0.01-0.15 μgmL-1. A 1% w/v Sulfanilamide solution was prepared by dissolving 3 g of Sulfanilamide in 156 ml of concentrated hydrochloric acid, followed by the addition of 300 ml of deionized water. Additionally, a 0.35% w/v solution of N-(1-Naphthyl) ethylene diamine dihydrochloride (NED) was prepared by dissolving 1.05 g of NED in 300 mL of deionized water [18] as shown in Figure 1.
Figure 1. The scheme for the determination of nitrite ion
2.2 The fabrication of a microfluidic chip
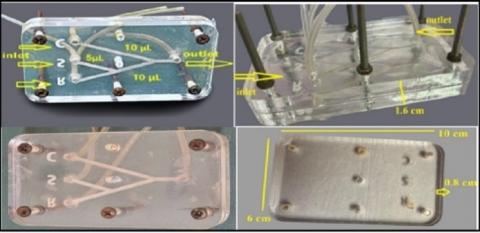
The microfluidic chip was constructed from two layers of Polymethylmethacrylate (PMMA), which exhibits good chemical resistance. However, it is essential to assess its compatibility within the specific environmental conditions of the intended application [19], each measuring 6 cm in width, 10 cm in length, and 0.8 cm in thickness, resulting in a total thickness of 1.6 cm. One layer served as a cover and remained undrilled, while the other was precision drilled using specialized equipment to form three microchannels. Two of the channels have a volume of 10 μL each, while the third has a volume of 5 μL. the total volume of the chip is 25 μL. Samples and reagents are introduced through the three inlet channels, which merge into a single outlet channel, forming a Y-shaped microfluidic configuration. The two pieces were bonded together using an adhesive material, which was applied only to the external parts of the chip without interfering with or affecting the chip’s internal manifold, to prevent any disruption to the internal reactions. Additionally, to enhance the overall structural stability and ensure compatibility with the operating method, the layers were tightly fastened using mechanical screws, as shown in Figure 2.
Figure 2. The microfluidic chip was created for an automated system
2.3 The fabrication of a microfluidic unit in the laboratory
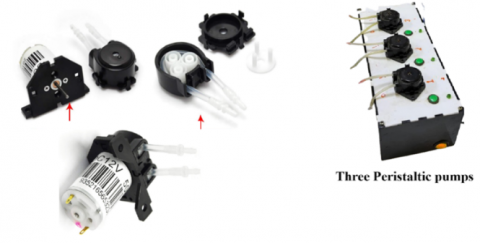
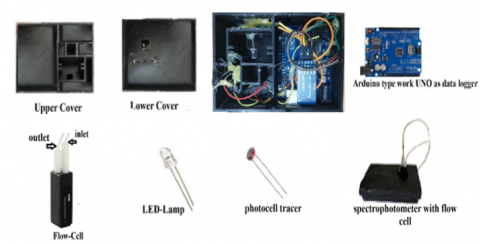
The microfluidic device comprises several key components, including three mini peristaltic pumps (12V DC DIY) controlled via an L298N motor driver to regulate the flow rates of the solution, as detailed in Table 1 and Figures 3 and 4. The basic components of the laboratory-fabricated system included a flow cell with a 32 μL volume, a 28 V LED lamp operating as a source in the visible region, and an LED photocell sensor, serving as a detector, to transfer the light intensity into an electrical signal. An Arduino microcontroller was used to function as a data logger. The system was interfaced with a laptop running Microsoft Excel 2016, which was used to record and display the peak heights corresponding to the analyte concentration.
Table 1. All components of the lab micro unit
|
Components |
Work |
Type |
Origin |
|
ARDUINO |
Micro controller |
UNO |
Italy |
|
Driver Motor |
Micro controller |
L298N |
China |
|
Three peristaltic pumps |
With drawing carrier and reagent |
INTLLAB 12V DCDIY |
China |
|
Power supply |
Device power controlling |
- |
China |
|
On/off button |
on/off |
- |
China |
|
Flow cell 32 μL |
Sample container |
OSS |
China |
|
LED-Lamp |
Light source |
- |
China |
|
Photocells tracer |
Detector |
- |
China |
Figure 3. Components of a lab-built peristaltic pump
Figure 4. Components of lab-built
2.4 The manifold design
Three Arduino-controlled pumps are employed in the proposed system, operating at flow rates ranging from 1.5 to 5.0 ml/min. The system is integrated with custom-developed software designed to control reagent flow rates, introduce nitrite samples, and record the resulting signal as peak height. This height corresponds to the nitrite concentration in the water sample. Data acquisition was performed using a laptop equipped with the custom software, with Microsoft Excel 2016 utilized as the data logging platform. The manifold consists of three Teflon tubes that transport the nitrite sample, the sulfanilamide solution, and N-(1-Naphthyl) ethylenediamine dihydrochloride (NED) reagent. These solutions are subsequently mixed and reacted within the microfluidic chip to form a colored complex. The resulting solution then flows through the detection cell to the detector. Figure 5 illustrates the manifold configuration used in the microfluidic system for nitrite determination.
(a)
(b)
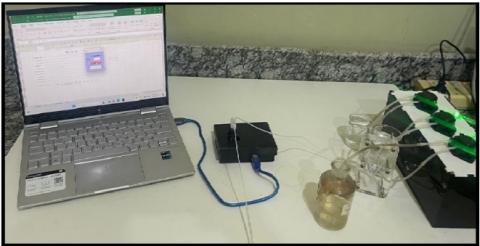
Figure 5. (a) Microfluidic manifold used to determine nitrite concentration; (b) The device connection photo of the automated microfluidic system
3.1 Spectral characteristics
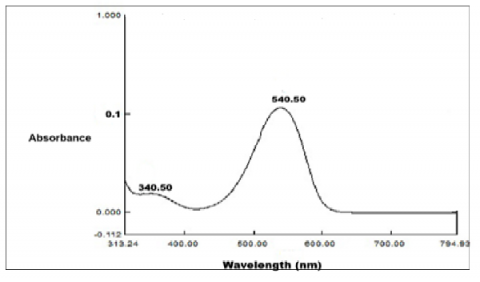
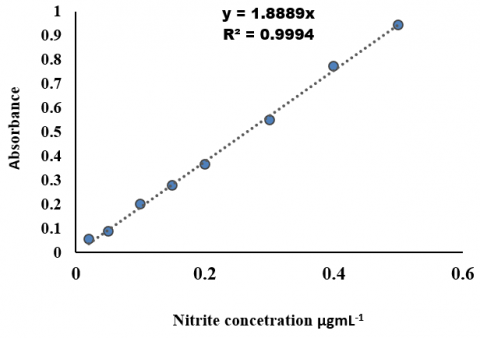
A UV-Visible spectrophotometer (doubal beam, Shimadzu 1800) equipped with a quartz cell of 1cm path length was used to measure the absorbance throughout this classical analysis, as illustrated in Figure 6. The recorded spectrum corresponds to the dye complex formed between nitrite standard solution, sulfanilamide under acidic conditions, and NED (N-(1-naphthyl) ethylene diamine dihydrochloride. The resulting azo dye exhibits a characteristic pink color with a maximum absorbance at 540 nm [20], indicating the azo compound. Figure 7 shows the standard calibration curve for nitrite determination by the Classical method.
Figure 6. The spectrum of the nitrite azo complex
Figure 7. Standard calibration curve for nitrite determination by the classical method
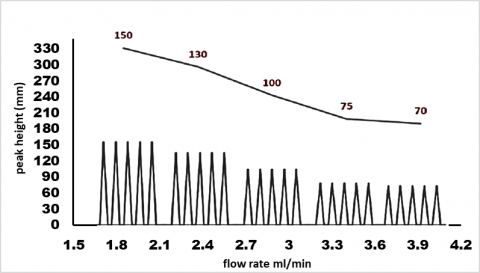
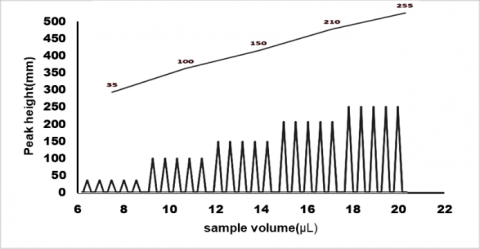
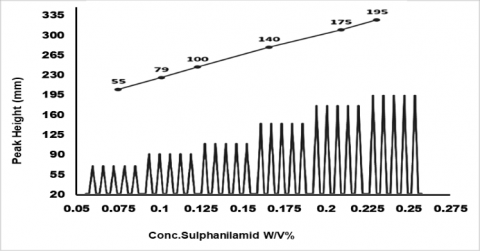
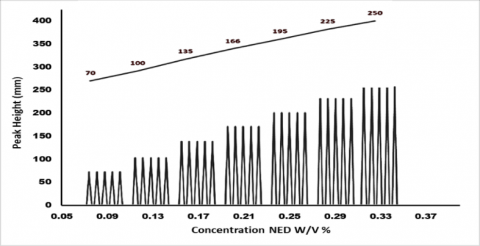
3.2 Optimum conditions
The custom-built automated microfluidic system, as shown in Figure 5, was used to optimize the parameters influencing the performance of the nitrite determination. The microfluidic system can reduce certain interferences by optimizing the reaction timing (1.8-4 ml/min), which limits the extent to which interfering substances can fully react under microfluidic conditions. Each sample is processed in approximately 0.166 seconds, compared to 30 minutes per sample using the classical method. This system was employed to identify the optimal analytical conditions affecting the peak height. A Series of experiments was conducted by Aboud and Al-Sowdani [21] to establish the optimal conditions. Table 2 summarizes all the optimum parameters used in subsequent experiments, while Figures 8-11 illustrate the optimal flow rate, sample volume, and the most suitable concentrations of reagents and solutions.
Table 2. Optimum conditions for Nitrite determination
|
Determination |
Parameters Values |
|
Chip Volume |
25 µL |
|
Total Flow Rate |
2.9 mL/min |
|
Sample Volume |
10 µL |
|
Sulfanilamide Concentration |
0.125%w/v |
|
N-(1-naphthyl)ethylenediamine dihydrochlorid concentration |
0.13%w/v |
|
Throughput |
600 sample/h |
|
Tube diameter |
0.18 mm |
Figure 8. Effect of total flow rate ml/min
Figure 9. Effect of the sample volume (µl)
Figure 10. Effect of the concentration of Sulphanilamide (%w/v)
Figure 11. Effect of the concentration of NED (%w/v)
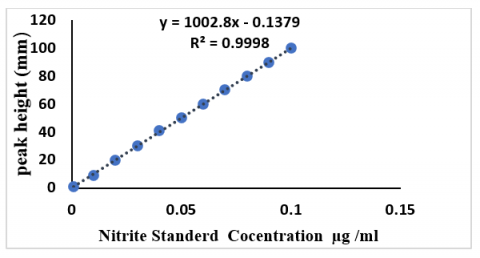
3.3 Linearity studies
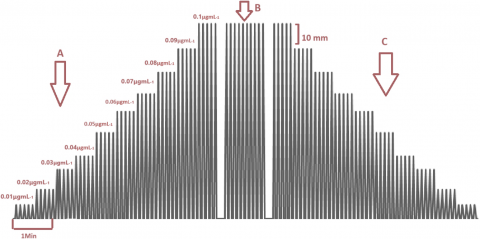
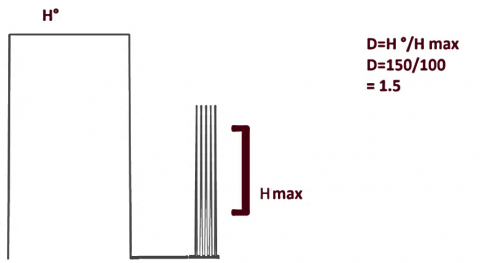
Using the optimized conditions determined in Table 2, linearity was studied as shown in Figures 12, 13, and Table 3. A calibration curve for nitrite was obtained, and linearity was observed over the range (0.01-0.1) μgmL-1. The linear calibration curve exhibited a regression coefficient (R2) of 0.9998, confirming the excellent linearity of the calibration curve and demonstrating that the analytical method is highly efficient and reliable, with a detection limit of 0.0001μgmL-1 and a Relative Standard deviation (R.S.D.) of 0.379%, respectively. While the values of R.S.D.%, as shown in Table 3 for all concentrations, were acceptable except for 0.01μg/mL, the elevated R.S.D.% value observed at the lowest concentration is likely due to increased relative variability near the detection limit, where signal-to-noise ratio is reduced and analytical sensitivity decreases. The sample throughput reached 600 samples per hour, and the system demonstrated a dispersion coefficient of 1.5 [22-24], as illustrated in the Figure 14.
Figure 12. Standard calibration curve for determining nitrite concentration
Figure 13. (A) Standard calibration graph for nitrite determination; (B) 10 replicates of 0.1μgmL-1 standard nitrite; (C) Peaks obtained by injecting nitrite standards
Figure 14. The dispersion coefficient in the microfluidic system
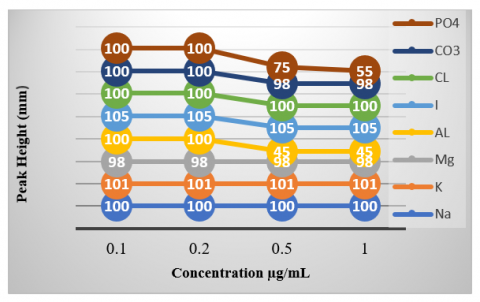
3.4 Interferences study
As the system was developed for the analysis of water samples, several chemical interferences from foreign ions (anions and cations) commonly present in such samples were considered. Their effects were evaluated by preparing solutions at equal concentrations, as well as two-fold, five-fold, and ten-fold higher concentrations, to analyze 0.1 μgmL-1 of nitrite in real samples. The study of the impact of each foreign ion on nitrite detection using the microfluidic system confirmed that the method exhibits high selectivity, despite the spectral overlap between aluminum (III) and nitrite at a concentration of 1 μgmL-1, the presence of aluminum in the studied environmental samples does not affect the proposed method due to its typically low concentration in such samples [25]. Meanwhile, Mg2+, K+, and Na+ do not interfere with the detection of nitrite. Regarding anions, none of the studied species showed any significant interference with nitrite measurement. except for the phosphate (III) ion, which shows spectral overlap at concentrations of 0.5 μg/mL and 1 μg/mL, as illustrated in the Figure 15. In the studied environment, nitrite concentration ranged between 0.5 and 1 μg/mL [26]. Low concentrations did not significantly impact the result. In contrast, high concentrations could be appropriately diluted during measurement to ensure accurate nitrite determination. To minimize or eliminate such interferences in the determination of nitrite in environmental samples, one can employ sample filtration, add sodium citrate as an interference suppressor, and use masking agents such as EDTA and tartrate solution [27, 28].
Table 3. Standard calibration graph of nitrite standards
|
Nitrite Concentration (μg/mL) |
Rate of Peak Height (mm) |
(R.S.D)% n=5 |
|
0.01 |
9.13 |
1.034 |
|
0.02 |
20.242 |
0.535 |
|
0.03 |
30.44 |
0.646 |
|
0.04 |
41.124 |
0.135 |
|
0.05 |
50.11 |
0.098 |
|
0.06 |
60.82 |
0.603 |
|
0.07 |
70.59 |
0.374 |
|
0.08 |
80.465 |
0.258 |
|
0.09 |
90.201 |
0.100 |
|
0.1 |
100.015 |
0.007 |
Figure 15. Shows the interference study of nitrite concentration
4.1 Describe the sample area
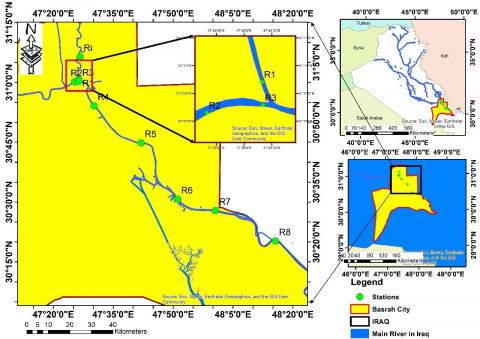
Sample collection was conducted in October, with five locations were selected along the Shatt Al-Arab River in Basra governorate of southern Iraq, the sampling sites were selected based on the diversity of pollution sources, including boating and fishing activities, residential area, agricultural lands, and drainage discharges. Although nutrient levels are generally not high during this month [29]. Site selection aims to capture potential variations linked to these sources; these locations are distributed as follows: The first station (R1) was located on the Tigris River, while the second and third stations (R2, R3) were established on the Euphrates River upstream of their confluence. The fourth station (R4) was situated downstream of the Shatt Al-Arab confluence near Al-Noor Bridge, and the last station (R5) was positioned at Al-Saad Bridge. The locations of these stations are illustrated in Figure 16. Water samples were collected 30 Cm below the surface using a water sampler instrument and placed in plastic containers [30]. The samples were then preserved by adding 10 mL of chloroform and stored at 4℃. After collection, they were transferred for processing. This included filtration using a 0.45 µm GF/C Whatman glass fiber filter paper, followed by analysis (see Figure 16).
Figure 16. The location of the samples selected in southern Iraq
4.2 Results
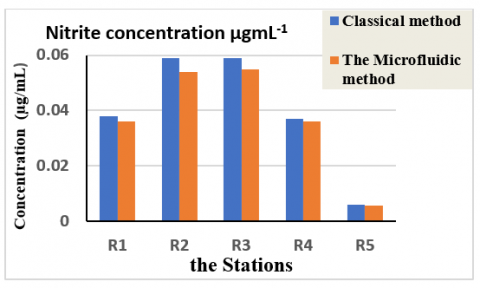
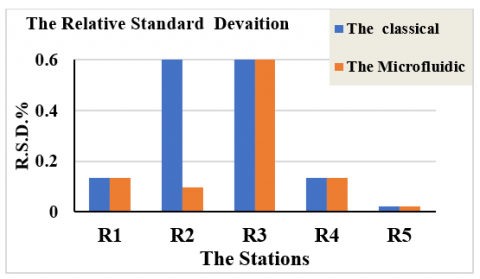
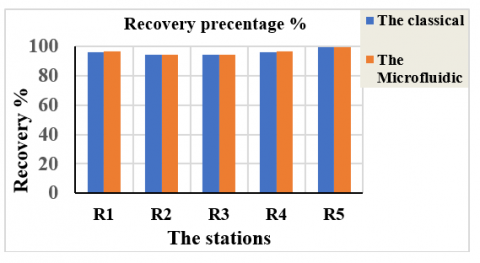
The results show minimal differences in nitrite Concentration between the two methods (ranging from 0.0003 to 0.005 µgmL-1), indicating a high level of agreement. While RSD%: The microfluidic method exhibited better precision in most samples, especially in R2, where the RSD was significantly lower but still in an acceptable range for R.S.D.%. Both methods provided highly comparable recovery rates, generally above 94%, with the Microfluidic method showing slightly higher values in certain cases. As shown in Table 4. The fully automated microfluidic platform developed in this study demonstrated high efficiency in quantifying nitrite concentrations across various water samples. The analytical results obtained using the proposed system closely align with those from the conventional method applied to the same sample batch [31]. In addition, the relative standard deviation and Recovery values confirm the method’s accuracy and reliability, indicating strong concordance between the two analytical approaches.
The stations:
R1: Al-Qurna/Tigris River (31°11′46.92″N, 47°26′19.52″E)
R2: Al-Qurna/Euphrates River(31°00′09.01″N, 47°25′20.02″E)
R3: Al-Qurna/Euphrates Rivers (31°00′17.43″N, 47°26′20.40″E)
R4: Noor Bridge/Shatt Al-Arab River (30°54′09.38″N, 47°30′11.13″E)
R5: Saad Bridge/Shatt Al-Arab River (30°44′51.03″N,47°41′59.64″E)
Table 4. Comparative data table between the two analytical methods used for nitrite determination
|
Sample |
Microfluidic Nitrite (µgmL-1) |
Microfluidic RSD% N=5 |
Microfluidic Recovery% |
|
R1 |
0.037 |
0.135 |
96.4 |
|
R2 |
0.054 |
0.098 |
94.6 |
|
R3 |
0.055 |
0.603 |
94.5 |
|
R4 |
0.036 |
0.133 |
96.4 |
|
R5 |
0.0057 |
0.021 |
99.43 |
|
Sample |
Classical Nitrite (µgmL-1) |
Classical RSD% N=3 |
Classical Recovery% |
|
R1 |
0.038 |
0.136 |
96.2 |
|
R2 |
0.059 |
0.611 |
94.1 |
|
R3 |
0.059 |
0.614 |
94.1 |
|
R4 |
0.037 |
0.135 |
96.3 |
|
R5 |
0.006 |
0.0212 |
99.4 |
4.2.1 Graphical comparison
As shown in Figure 17, the two methods were compared across all tested samples in terms of Nitrite concentration, RSD%, and Recovery%.
4.3 Analysis
The results show minimal differences in nitrite concentration between the two methods, indicating a high level of agreement. While R.S.D.%, the microfluidic method exhibited better precision in most samples, especially in R2, where the R.S.D.% was significantly lower. Both methods provided highly comparable recovery rates, generally above 94%, with the microfluidic method showing slightly higher values in certain cases.
This project focuses on the design and development of a device that employs a specific analytical method to accurately identify the concentrations of various ions, with particular emphasis on cost efficiency, user-friendliness, and analytical reliability. This system can be used for industrial water applications in specialized plants, such as chemical fertilizer production. Additionally, it can be operated online by incorporating an automated self-sampling mechanism for real- time sample collection. In this study, we introduced the design of an automated microfluidic device and utilized it to measure the nitrite levels from different locations in the Shatt Al-Arab River. The results obtained from the creative device proved high performance, accuracy, and practical applicability compared with the classical method, and we can also apply this system for nitrite measurement in wastewater; however, proper sample homogenization should be performed before analysis to ensure precise results.
[1] Dorta, D.J., De Oliveira, D.P. (2022). The Toxicity of Environmental Pollutants. BoD-Books on Demand. http://doi.org/10.5772/intechopen.98127
[2] Lucas, S.B., Duarte, L.M., Rezende, K.C.A., Coltro, W.K.T. (2022). Nitrite determination in environmental water samples using microchip electrophoresis coupled with amperometric detection. Micromachines, 13(10): 1736. https://doi.org/10.3390/mi13101736
[3] Zhang, H., Zhao, R., Yang, Y., Liu, Y., Han, L. (2023). Measuring nitrate concentration in surface waters with a microfluidic device facilitated by a miniaturized capacitive deionization cell. Water Quality Research Journal, 58(1): 1-13. https://doi.org/10.2166/wqrj.2023.010
[4] Zhang, H., Qi, S., Dong, Y., Chen, X., Xu, Y., Ma, Y., Chen, X. (2014). A sensitive colorimetric method for the determination of nitrite in water supplies, meat and dairy products using ionic liquid-modified methyl red as a colour reagent. Food Chemistry, 151: 429-434. https://doi.org/10.1016/j.foodchem.2013.11.016
[5] Wierzbicka, E. (2020). Novel methods of nitrate and nitrite determination-A review. Journal of Elementology, 25(1): 97-106. https://doi.org/10.5601/jelem.2019.24.3.1848
[6] Picetti, R., Deeney, M., Pastorino, S., Miller, M.R., Shah, A., Leon, D.A., Dangour, A.D., Green, R. (2022). Nitrate and nitrite contamination in drinking water and cancer risk: A systematic review with meta-analysis. Environmental Research, 210: 112988. https://doi.org/10.1016/j.envres.2022.112988
[7] Yardımcı, B. (2023). Spectrophotometric and smartphone-based facile green chemistry approach to determine nitrite ions using green tea extract as a natural source. Sustainable Chemistry and Pharmacy, 34: 101175. https://doi.org/10.1016/j.scp.2023.101175
[8] Al Mughairy, B., Al-Lawati, H.A. (2020). Recent analytical advancements in microfluidics using chemiluminescence detection systems for food analysis. TrAC Trends in Analytical Chemistry, 124: 115802. https://doi.org/10.1016/j.trac.2019.115802
[9] Melin, J., Quake, S.R. (2007). Microfluidic large-scale integration: The evolution of design rules for biological automation. Annual Review of Biophysics, 36: 213-231. https://doi.org/10.1146/annurev.biophys.36.040306.132646
[10] Chen, Y., Sun, T., Liu, Z., Zhang, Y., Wang, J. (2024). Towards design automation of microfluidic mixers: Leveraging reinforcement learning and artificial neural networks. Micromachines, 15(7): 901. https://doi.org/10.3390/mi15070901
[11] Lashkaripour, A., Rodriguez, C., Mehdipour, N., Mardian, R., McIntyre, D., Ortiz, L., Campbell, J., Densmore, D. (2021). Machine learning enables design automation of microfluidic flow-focusing droplet generation. Nature Communications, 12: 25. https://doi.org/10.1038/s41467-020-20284-z
[12] Wong, W.D., Majnis, M.F., Lai, C.W., Sagadevan, S., Julkapli, N.M. (2024). Enhancement of mixing and reaction efficiency of various fluids applications at different microfluidic configuration and design. Chemical Engineering and Processing-Process Intensification, 198: 109729. https://doi.org/10.1016/j.cep.2024.109729
[13] Olaizola-Rodrigo, C., Palma-Florez, S., Ranđelović, T., Bayona, C., Ashrafi, M., Samitier, J., Lagunas, A., Mir, M., Doblaré, M., Ochoa, I., Monge, R., Oliván, S. (2024). Tuneable hydrogel patterns in pillarless microfluidic devices. Lab on A Chip, 24(7): 2094-2106. https://doi.org/10.1039/D3LC01082A
[14] Lei, X., Ye, W., Safdarin, F., Baghaei, S. (2024). Microfluidics devices for sports: A review on technology for biomedical application used in fields such as biomedicine, drug encapsulation, preparation of nanoparticles, cell targeting, analysis, diagnosis, and cell culture. Tissue and Cell, 87: 102339. https://doi.org/10.1016/j.tice.2024.102339
[15] Cao, X., Zhang, S.W., Chu, D.Z., Wu, N., Ma, H.K., Liu, Y. (2017). A design of spectrophotometric microfluidic chip sensor for analyzing silicate in seawater. IOP Conference Series: Earth and Environmental Science, 82(1): 012080. http://doi.org/10.1088/1755-1315/82/1/012080
[16] Al-Jorani, Y.S.J., Al-Sowdani, K.H., Saleh, S.M. (2021). Lab-made semi-automated microfluidic flow injection spectrophotometric system for determination of nitrite in natural water. Journal of Physics: Conference Series, 1818(1): 012050. http://doi.org/10.1088/1742-6596/1818/1/012050
[17] Motahari, S., Morgan, S., Hendricks, A., Sonnichsen, C., Sieben, V. (2024). Continuous flow with reagent injection on an inlaid microfluidic platform applied to nitrite determination. Micromachines, 15(4): 519. https://doi.org/10.3390/mi15040519
[18] Nerdy, N., Putra, E.D.L. (2018). Spectrophotometric method for determination of nitrite and nitrate levels in broccoli and cauliflower with different fertilization treatment. Oriental Journal of Chemistry, 34(6): 2983-2991. http://doi.org/10.13005/ojc/340639
[19] Chen, Y., Zhang, L., Chen, G. (2008). Fabrication, modification, and application of poly (methyl methacrylate) microfluidic chips. Electrophoresis, 29(9): 1801-1814. https://doi.org/10.1002/elps.200700552
[20] Nagaraja, P., Shivaswamy, M., Kumar, H. (2001). Highly sensitive N-(1-naphthyl) ethylene diamine method for the spectrophotometric determination of trace amounts of nitrite in various water samples. International Journal of Environmental Analytical Chemistry, 80(1): 39-48. https://doi.org/10.1080/03067310108044384
[21] Aboud, M.N., Al-Sowdani, K.H. (2024). Design of a lab built fully automated microfluidic fluorometric system for fluorescent dye applications. Pakistan Journal of Analytical & Environmental Chemistry, 25(1): 13-21. http://doi.org/10.21743/pjaec/2024.06.02
[22] Al-Asady, I.A., Al-Sowdani, K.H. (2021). Lab build fully automated microfluidic flow injection system. Journal of Physics: Conference Series, 2063(1): 012018. http://doi.org/10.1088/1742-6596/2063/1/012018
[23] Al-Sowdani, K.H., Al-Balaawi, M.T.K. (2019). Lab-built semi-automated stop-flow system for spectrophotometric determination of nitrite in different water samples. Journal of Physics: Conference Series, 1294(7): 072010. http://doi.org/10.1088/1742-6596/1294/7/072010
[24] Aboud, M.N., Al-Sowdani, K.H. (2024). A smartphone serves as a data logger for a fully automated lab-constructed microfluidic system. MethodsX, 12: 102584. https://doi.org/10.1016/j.mex.2024.102584
[25] Mulec, A.O., Mladenovič, A., Pranjić, A.M., Oprčkal, P., Ščančar, J., Milačič, R. (2020). Study of interferences and procedures for their removal in the spectrophotometric determination of ammonium and selected anions in coloured wastewater samples. Analytical Methods, 12(39): 4769-4782. https://doi.org/10.1039/D0AY01361G
[26] Hamdan, A., Dawood, A., Naeem, D. (2018). Assessment study of water quality index (WQI) for Shatt Al-Arab River and its branches, Iraq. MATEC Web of Conferences, 162: 05005. https://doi.org/10.1051/matecconf/201816205005
[27] Colman, B.P. (2010). Understanding and eliminating iron interference in colorimetric nitrate and nitrite analysis. Environmental Monitoring and Assessment, 165: 633-641. https://doi.org/10.1007/s10661-009-0974-x
[28] Sgroi, M., Gagliano, E., Vagliasindi, F.G., Roccaro, P. (2020). Inner filter effect, suspended solids and nitrite/nitrate interferences in fluorescence measurements of wastewater organic matter. Science of the Total Environment, 711: 134663. https://doi.org/10.1016/j.scitotenv.2019.134663
[29] Abdulnabi, Z.A. (2020). Assessment of free and total cyanide levels in the water environment of Shatt Al-Arab. Indonesian Journal of Chemistry, 20(4): 880-886. https://doi.org/10.22146/ijc.47369
[30] Wilde, F.D., Sandstrom, M.W., Skrobialowski, S.C. (2014). Chapter A2. selection of equipment for water sampling. In Techniques of Water-Resources Investigations. US Geological Survey. https://doi.org/10.3133/twri09A2
[31] Singh, P., Singh, M.K., Beg, Y.R., Nishad, G.R. (2019) A review on spectroscopic methods for determination of nitrite and nitrate in environmental samples. Talanta, 191: 364-381. https://doi.org/10.1016/j.talanta.2018.08.028