Samadi![]() | Indra Wahyudi
| Indra Wahyudi![]() | Sitti Wajizah
| Sitti Wajizah![]() | Zulfahrizal
| Zulfahrizal![]() | Agus Arip Munawar*
| Agus Arip Munawar*![]()
© 2024 The authors. This article is published by IIETA and is licensed under the CC BY 4.0 license (http://creativecommons.org/licenses/by/4.0/).
OPEN ACCESS
In this study, we attempted to develop a robust and accurate near infrared spectroscopic model for nutrient content analysis in fermented Cocoa Pod Husk (CPH), a viable but underexploited byproduct in cocoa production with great potential for use in animal feed. Recognizing the necessity for sustainable feed options, precise nutrient profiling of CPH is critical for balanced diets and effective feed formulation. To achieve this, specific spectral pre-processing techniques, namely multiplicative scatter correction (MSC), Savitzky-Golay smoothing (SGs), and the first derivative (1st D) were purposefully chosen for their individual and combined abilities to correct for scattering effects, smooth out noise, and enhance spectral resolution, respectively. These methods significantly contribute to the model's superior performance by improving the quality of the spectral data input. Furthermore, Partial Least Squares Regression (PLSR) was selected over other multivariate algorithms due to its robustness in handling collinear and noisy data, making it well-suited for complex biological matrices such as fermented CPH. Employing the Unscrambler X 10.4 software, the PLSR model was rigorously assessed using a range of statistical tools to ensure validity, with notable precision in predicting key nutritional components. The findings not only confirm the model's excellence but also hold promising implications for the agriculture industry, particularly in the development of cost-effective, nutrient-rich animal feed solutions. By capitalizing on the compositional richness of CPH and refining NIRS modeling for its analysis, this study contributes to the enhanced utilization of agricultural byproducts and the sustainability of animal nutrition practices.
NIRS, pre-processing, spectra, cocoa pod husk, feed, animal, fermentation, chemometrics
As the world’s third largest cocoa (Theobroma cacao L.) producer, Indonesia has enormous potential for by-products such as fruit shells (pod husk). The use of cocoa pod husk is a strategic step toward increasing the availability of feed ingredients and reducing environmental pollution caused by improper cocoa pod shell disposal [1]. Cocoa pod husk, a by-product of the plantations, can be used as animal feed. Cocoa pod husk is the by-product with the highest proportion produced. Each pod contains 67–76% shells, and every ton of the dry beans will yield 10 tons of wet cocoa husk [2]. The husk contains several nutrients that can be used as feed ingredients for poultry and ruminants [3], Typically, these husks are left to accumulate in the plantation areas, which can cause ecological imbalances by attracting pests, promoting disease, and affecting soil quality due to the slow decomposition of the fibrous material from the pod husk. Moreover, the traditional burning of husks, practiced in some areas, releases significant amounts of carbon dioxide and pollutants, exacerbating air quality issues and contributing to global warming. This environmental challenge coexists with the potential for husks to serve as a valuable feed resource, containing 5.9–9.1%, 22.6–35.7%, and 1.2–10% crude protein, fiber, fat, and minerals [4].
The cocoa pod husk has a high nutritional value, but it also includes chemicals that may reduce the body’s ability to absorb nutrients. According to Laconi and Jayanegara [5], the cocoa pod husk fiber fraction has a dry (DM) and organic matter (OM) digestibility level of about 40% and is made up of Neutral Detergent Fiber (NDF), Acid Detergent Fiber (ADF), hemicellulose, cellulose, and lignin at 80.7%, 74.6%, 6.0%, 35.3%, and 38.8%.
Theobromine is also found in the husk of cocoa pods, where it can inhibit the growth of rumen microbes, reducing fiber digestion and causing diarrhea [6]. Considering the potential, nutrient composition, and limiting elements, processing is necessary to enhance the quality of a feed ingredient. This aims to increase nutritional content and digestibility while decreasing anti-nutritional compounds and extending shelf life. Furthermore, fermentation is one of the biological processing methods that can improve the nutritional quality and usability of agricultural by-product feed ingredients [7]. Hidayat et al. [8] reported that the fermentation process on cocoa pod husk using lingzhi mushrooms (Ganoderma lucidum) at different concentrations and times can increase the protein content and digestibility of DM and OM.
Fermentation represents a notable bio-processing avenue capable of enhancing the digestibility and nutritional value of agricultural by-products, including cocoa pod husks [7, 8]. Another prevalent method, chemical treatment, has also been explored for its potential to alleviate the impact of anti-nutritional factors and enhance feed ingredient quality. For instance, alkaline treatment has demonstrated effectiveness in reducing fiber content and improving protein digestibility in various agro-industrial by-products. Similarly, chemical treatments using alkalis or acids have been investigated in improving the digestibility and palatability of several feed resources. However, these processes often entail additional costs and can introduce certain environmental concerns related to waste disposal of chemical by-products.
Mechanical processing, such as grinding or particle size reduction, can also play a role in enhancing the utilization of agro-industrial by-products by improving their handling properties, but its impact on nutrient bioavailability is limited in comparison to biological or chemical methods.
While fermentation, either with chemical or mechanical treatments each have unique advantages and drawbacks, the emphasis in this study remains on the potential of fermentation as a biological processing method to enhance the nutritional value and usability of cocoa pod husk. The multifaceted nature of agricultural by-products necessitates the exploration of varied processing methods to ensure their effective contribution as valuable feed resources while addressing associated environmental and economic considerations.
In the preparation of livestock rations, the nutritional content and digestibility of feed ingredients, including cocoa pod husk, should be considered. Laboratory testing is commonly used to determine the nutritional content of animal feed ingredients. Although most of these methods are reliable and frequently used to measure feed ingredient parameters, this technique takes a long time, making it less time-efficient [7]. Therefore, it is necessary to develop fast, non-destructive, and chemical-free methods to predict better feed ingredients’ qualitative and quantitative parameters or at least be as accurate as conventional methods.
Near Infrared Reflectance Spectroscopy has evolved into a non-destructive method for analysis in various fields, including animal feed. NIRS can analyze quickly with easy sample preparation, an analytical technique that employs near-infrared radiation from the electromagnetic spectrum [9]. The interaction of NIR rays with biological objects causes changes in the vibrational energy of each organic molecule, which are visible as a fingerprint or spectral pattern. It provides information about the object’s organic molecular bonds and chemical composition [10]. The main influence of each spectral pattern is determined by the object’s chemical composition, cell structure, and physical properties. Meanwhile, the NIR spectrum captured from biological objects represents the C-O, C-H, O-H, and N-H molecular bond responses [11]. The main information gathered from the interaction of near-infrared radiation with biological objects are materials’ physical, optical, and chemical properties [11].
In practice, the NIRS method’s analysis of the nutritional quality of feed ingredients is conducted based on a model built from the initial calibration and validation results and the chemical analysis before being used continuously. The resulting spectrum has a significant impact on the development of NIRS models. Before applying advanced chemometric methods, noise in NIRS data modeling should be removed early. The presence of noise in the raw spectrum data affects the prediction accuracy and robustness of the model [12].
In chemometrics, noise correction techniques are often chosen based on the best results. However, a specific correction can lead to non-optimal modeling because data previously processed with different correction techniques, that can carry complementary information. Spectrum correction in combination or hybrid mode allows for the most accurate NIRS model performance. According to the findings by Mishra et al. [13], combining different techniques could improve the performance of the NIRS model for predicting the moisture, fat, and protein content of meat. Therefore, this study aims to investigate the use of hybrid spectrum pretreatment method combined with the Partial Least Squares Regression (PLSR) algorithm as a reliable analytical method for measuring the nutritional quality parameters.
2.1 Cocoa pod husk sample
A total of 48 samples of cocoa pod husk feed ingredients fermented with different fungi were used. Furthermore, 30 samples were fermented using 3% white rot fungi (Phanerochaete chrysosporium) at 0, 7, 14, 21, and 28 days of fermentation, while others were fermented with 7% and 15% of lingzhi mushrooms (Ganoderma lucidum) at 15, 30, and 45 days [8]. Fermentation conditions, can significantly impact the growth of fungi and the overall fermentation process. Understanding these factors is essential for comprehensively evaluating the outcomes of the fermentation process and its influence on the nutritional characteristics of the cocoa pod husk samples.
Specifically, temperature and humidity play a pivotal role in facilitating the growth of fungi and other microorganisms during the fermentation process. These parameters can influence the rate of fungal proliferation, metabolic activity, and subsequent biochemical changes within the substrate. Additionally, details regarding the substrate used for fermentation would offer insights into the nutritional and structural alterations that might occur during the process.
2.2 Proximate analysis of nutritional contents
The proximate results are useful reference data for calibration and validation in developing the NIRS model. Proximate analysis determines the quality of fermented cocoa pod feed ingredients, and the analysis testing begins with drying the sample at 60℃ for 24 hours. The sample was then mashed using cutter mills to 1 mm in size. The proximate analysis performed included Dry Matter (DM), Crude Protein (CP), Extract Ether (EE), Crude Fiber (CF), ash, and Nitrogen-Free Extract (NFE). Tests for DM, CP, EE, CF, and ash were conducted according to AOAC International procedures [14]. Meanwhile, BETN is calculated using the following equation: NFE = 100%-(CP+EE+CF+ash).
2.3 NIR spectra data acquisition
The remaining proximate test sample (15 grams) was then used for NIRS testing, and the spectra data were acquired using a bench-top Nicolet-Antaris Method Development Sampling (MDS) system controlled remotely through an integrated software configuration (Thermo Fisher Scientific Inc., Madison, WI, USA). A workflow is set up to configure the tool to acquire the spectrum in a formatted diffuse reflectance (Log (1/R)) 32 times, and save the results in “*.CSV” format. The wavelength ranges from 1000 to 2500 nm (10000 to 4000 cm-1) with an interval of about 0.02 nm, and the spectra were collected around 29-31℃.
2.4 Calibration and validation models
Calibration is a model that shows the level of correlation between the NIR spectra (X-variable) and chemical data (Y-variable) in a collection of datasets. Before modeling, the features of the absorbance spectrum are examined by visualizing in graphical form. Projection Principal Component Analysis (PCA) combined with Hotelling’s T2 ellipse to visualize the data structure and identify patterns, trends, outliers in the spectrum, and other dominant features in the sample [10].
The collected NIR spectra contain sample component and interference information such as light scattering, baseline drift, and background noise, which can reduce the accuracy and stability of the model. Before developing the calibration model, several pretreatment methods, both specific and hybrid, were used, including Multiplicative Scatter Correction (MSC), Savitsky-Golay smoothing (SGs), first derivative (1st D), MSC+SGs, MSC+1st D, SGs+1st D, and MSC+SGs. Moreover, the spectrum pretreatment and development of the calibration model were conducted using The Unscrambler® X 10.4 software (CAMO, Oslo, Norway).
The PLSR algorithm was used to develop a model for the quantification analysis of the nutrient attributes of the fermented cocoa pod husk samples. To ensure the accuracy of the calibration model, it is necessary to carry out validation tests. The accuracy of the predictions from the calibration regression with the chemical composition was tested using the cross-validation method. Meanwhile, eight full cross-validations with six random data segments are used to assess model performance and avoid data overfitting. Each of these random data segments is excluded from the calibration model but is used to test and measure the model during the cross-validation.
Several statistical parameters are used to evaluate the performance of the NIRS model, including the correlation coefficient (r), coefficient of determination (R2), Root-Mean-Square Error (RMSE), and Residual Predictive Deviation Index (RPD). RPD is the ratio of SD to RMSE, and the index Range Error Ratio (RER) denotes the relationship between the composition. Finally, the number of Latent Variables (LV) is directly proportional to the estimation results [15, 16].
3.1 NIR spectral features of cocoa pod husk
The absorbance features of the NIR spectrum of a fermented cocoa pod husk sample in the wavelength range of 1000–2500 nm is shown in Figure 1. The NIR spectrum shows very complex information due to the vibration of the atomic bonds, such as C-H (aliphatic), C-H (aromatic), C-O (carboxyl), O-H (hydroxyl), and N-H (amines and amides) in the organic compounds, in response to the frequency of the radiation.
The NIR spectral features of cocoa pod husk samples reflect their chemical composition and physical properties. When subjected to NIR spectroscopy, these samples exhibit unique absorption patterns and spectral characteristics across the NIR range typically 1000-2500 nm, providing valuable insights into their molecular composition.
The NIR spectrum of cocoa pod husk samples displays key absorption bands that correspond to various chemical components, including but not limited to organic compounds, moisture content, protein, fiber, and fat. The interaction of NIR radiation with the molecular bonds within the samples results in distinctive absorption peaks, reflecting the presence and relative abundance of different chemical constituents.
Figure 1. The absorbance features of a fermented cocoa pod husk's NIR spectrum
The C-H, O-H, and N-H molecular bonds present in organic compounds generate characteristic absorption features within the NIR spectrum, contributing to the overall spectral pattern. These features can be analyzed to determine the levels of specific nutrients, assess the sample's structural properties, and provide information regarding its overall chemical composition.
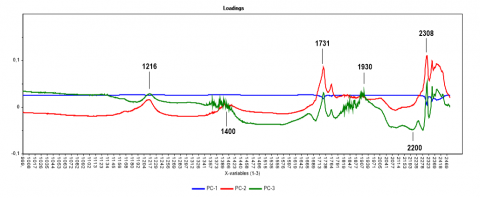
Furthermore, using PCA loading, it is possible to extract the wavelength characteristics. The highest or lowest peaks of the loading curve are considered significant variations in the data. In detail, Figure 2 shows the PCA loading curve of the raw NIR spectrum of the three principal components, namely, PC1, PC2, and PC3.
Figure 2. The PCA loading curve of NIR raw spectrum
As seen in Figure 2, there are peaks and valleys in the regions of 1216, 1400, 1731, 1930, 2200, and 2308 nm. Meanwhile, the absorbance peaks around 1216 and 1731 nm are related to fat content. The peaks at 1216 nm and 1731 nm were the stretching vibration of the C–H bond in aliphatic hydrocarbon compounds and -CH2- bond in a group of fatty acids [17]. The absorption bands at 1400 nm (1400–1450 nm; O-H stretch first overtone) and 1930 nm (1920–1940 nm; a combination of O-H stretch and O-H deformation and O-H bend second overtone) are associated with the moisture content [9]. According to Liu et al. [18], the C–H bond of the aromatic ring affects the diffuse reflectance module in the range of 1374–1449 nm. The absorbance peak at 2200 nm correlates with the protein content and the wavelength of 2046–2278 nm corresponds to the stretching of N–H molecules in amino acids [9, 19]. Furthermore, several molecular vibration modes are associated with the absorption peak around 2148 to 2200 nm, including the N–H bend second overtone, the C–H stretch and C=O stretch, the N–H in-plane bend, and the C–N stretch. Carbohydrates have also been investigated in the absorption band around 2308 nm, where the absorption peak occurs due to stretching C–H and C–C [20].
3.2 Principal component analysis (PCA) and outliers
The PCA method was tasked to extract useful, relevant information while removing irrelevant ones, allowing similar cocoa pod husk samples to be closer together. In a multivariate data space (X matrix), PCA can identify the most significant direction of variability and primary phenomena in spectra data [21]. In PCA analysis, data sets are transformed into a smaller number of uncorrelated variables called Principal Components (PCs) [22]. According to the results, the PCA performed on the raw spectra data produced a good and clear trend of clusters or separation, as shown in Figure 3. Furthermore, the principal components contain information about the spectral and chemical composition of the relevant samples. It shows that the two topmost PCs can explain 99% of the variance information extracted from the 48 fermented cocoa pod husk samples.
Figure 3. Score plot of PCA obtained for all samples under different fermentations
Figure 3 depicts the two main clusters of cocoa pod husk samples and does not show any outlier data outside the ellipse line (Hotelling’s T2 ellipse) at a 95% confidence level. The clusters include various cocoa pod husks and the graphical plots offer relevant information to determine differences between samples fermented by Phanerochaete chrysosporium and Ganoderma lucidum.
3.3 Calibration model for the nutritional attributes
NIRS requires a dataset from actual laboratory measurements (wet chemical analysis) for the calibration process before developing robust prediction models for measuring the nutritional attributes of fermented cocoa pod husk. Table 1 shows the statistical nutritional content of fermented cocoa pod husk, which was used for the calibration dataset.
Table 1. The statistical nutritional content of fermented CPH
|
Parameters (%) |
Min. |
Max. |
Mean |
SD |
CV |
|
Dry matter |
51.1 |
90.6 |
75.7 |
16.9 |
22.4 |
|
Crude protein |
5.6 |
14.2 |
10.3 |
2.9 |
28.3 |
|
Crude fiber |
28.5 |
41.2 |
33.9 |
3.9 |
11.5 |
|
Extract ether |
0.2 |
2.0 |
1.0 |
0.4 |
42.7 |
|
Ash |
9.1 |
13.7 |
11.0 |
1.4 |
12.6 |
|
NFE |
37.3 |
51.8 |
43.8 |
3.3 |
7.6 |
A PLSR analysis was applied to the datasets to develop prediction models and the algorithm can reduce the data by forming a new Primary Component (PC), which keeps chemical content information to facilitate prediction as presented in Table 2.
The superiority of combined pre-treatment methods, such as MSC+SGs+1st D, over specific methods, such as MSC, SGs, or 1st D alone, could indeed be due to a synergistic effect arising from the complementary nature of these techniques. To elucidate this, the authors could hypothesize potential reasons based on the observed data and the known effects of these pretreatment methods.
One possible hypothesis is that the combined pre-treatment methods address different sources of variation and spectral distortions more comprehensively than singular techniques. For example, while MSC corrects for scatter effects, SGs addresses baseline drift, and 1st D enhances spectral resolution. By combining these techniques, it is likely that a broader range of spectral distortions and noise components are effectively mitigated, leading to a more accurate and robust spectral dataset.
Furthermore, the combinatory approach could potentially amplify the beneficial effects of each individual pre-treatment method, resulting in an enhanced overall correction of spectral interference and noise. This may lead to improved model performance and prediction accuracy due to a more refined and distortion-free spectral dataset.
Another hypothesis could be related to the preservation of relevant information during the pre-processing stage. Combined pre-treatment methods may better retain essential spectral features linked to the variations in nutritional content and chemical composition, thus providing a more comprehensive and informative dataset for subsequent modeling.
The findings regarding the NIRS models have significant practical implications for the industry, particularly within the context of feed ingredient analysis and production. First, these models offer a rapid, non-destructive, and cost-effective method for assessing nutrient content in fermented cocoa pod husk and potentially other feed ingredients, which could streamline quality control processes and provide real-time, accurate data for decision-making. Additionally, their integration can decrease analysis time, reduce the need for extensive sample preparation, and lead to enhanced operational efficiency.
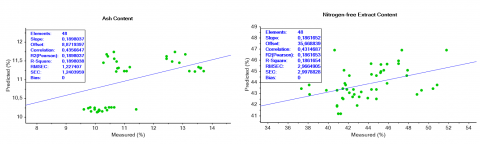
Furthermore, the ability to rapidly monitor and assess nutrient content in feed ingredients allows for more precise and timely adjustments to formulations, enabling better-balanced diets for animals and potentially improving overall nutritional outcomes. NIRS prediction models performances for all studied parameters are presented in Figure 4. These models could be integrated into routine quality control procedures for frequent and thorough monitoring of nutrient content in feed ingredients, allowing real-time validation and verification of incoming feed ingredient quality, ultimately leading to more efficient production processes and improved decision-making. However, ongoing calibration maintenance and ensuring sample representativeness are key areas that need to be carefully managed, along with the need for confirmation through traditional laboratory methods for niche or specific parameters.
Figure 4. Scatter plots of PLSR calibration with the best result for all nutritional parameters
In general, the model has different capabilities for estimating the nutritional parameters of fermented cocoa pod husk. Pre-treatment of raw spectra data affects the reliability of predictions. This is shown by the increasing R2 value, the RMSE, which appears to be getting smaller, as well as RPD and RER. Generally, the hybrid pretreatment method can reduce the physical differences between samples caused by scattering to eliminate additive and multiplicative effects and resulting in a more optimal spectrum. Combined pretreatment methods are more effective than specific methods at showing hidden information and reducing noise. A comprehensive comparison of the PLSR model with three specific methods and four different combinations showed that the combined pretreatment of MSC+SGs+1st D with factor LV 6 was the best model for dry matter parameters (R2 = 0.99, RMSE = 1.45, RPD = 11.68, and RER = 27.22). In contrast, the pretreatment method combining MSC+SGs with factor LV 5 generated the best PLSR model for crude protein parameters (R2 = 0.81, RMSE = 1.23, RPD = 2.37, and RER = 6.93).
The predictive performance for dry matter and crude protein parameters is considered very good, with accurate quantitative analysis capabilities and good generalization abilities. According to Saeys et al. [23], models with RPD values less than 1.5 should not be used to make predictions, RPD values 1.5–2.0 can distinguish between high and low values, and models with RPD 2.0–2.5 can be used to make quantitative prediction estimates.
Meanwhile, the RPD values of 2.0–2.5 and above 3.0 can be used for good and very good predictions. The RER index can act as an additional criterion when evaluating the use of each prediction model. RER is considered the statistical indicator with the greatest weight in determining the accuracy of the NIRS calibration model. RER values in the range 4–8 indicate the probability of discerning between high and low data values in samples, while 8–12 represent the probability of predicting quantitative data [24].
The optimal model for predicting crude fiber and extract ether is also obtained by applying the data pretreatment technique using MSC+SGs+1st D. The R2 values for the parameters crude fiber and fat are 0.79 and 0.76, respectively. The PLS model only has good category performance with basic quantitative predictive and good generalization abilities. The R2 value indicates the percentage of variance in Y accounted for by the X variable.
According to Karoui et al. [25], the R2 value between 0.50 and 0.65 indicates that X’s variance accounts for more than 50% of Y, allowing discrimination between high and low concentrations. Meanwhile, R2 values between 0.60 to 0.81 and 0.80 to 0.90 indicate an approximate quantitative and good prediction. A calibration model with an R2 value greater than 0.91 is considered reliable.
The PLS model, built based on raw data and various pretreatment algorithms, showed poor performance for predicting ash contents, with values of R2 = 0.18, RPD = 1.13, and RER = 3.83 fixed, and the ash content of a material is closely related to minerals. The mineral composition of the feed is not detected by NIRS because its structure has no organic bonds.
Table 2. The statistical parameters of PLSR calibration develoved with diferent pretreatment methods
|
Parameters |
Pretreatment |
LVs |
r |
R2 |
RMSE |
RPD |
RER |
|
Dry matter |
Raw |
4 |
0.99 |
0.98 |
2.15 |
7.88 |
18.36 |
|
MSC |
3 |
0.99 |
0.98 |
2.22 |
7.63 |
17.78 |
|
|
SGs |
4 |
0.99 |
0.98 |
2.16 |
7.84 |
18.27 |
|
|
1st D |
2 |
0.99 |
0.98 |
2.16 |
7.84 |
18.27 |
|
|
MSC+SGs |
5 |
0.99 |
0.99 |
1.50 |
11.29 |
26.31 |
|
|
MSC+1st D |
4 |
0.99 |
0.99 |
1.61 |
10.52 |
24.52 |
|
|
SGs+1st D |
3 |
0.99 |
0.99 |
1.64 |
10.33 |
24.07 |
|
|
MSC+SGs+1st D |
6 |
0.99 |
0.99 |
1.45 |
11.68 |
27.22 |
|
|
Crude protein |
Raw |
4 |
0.89 |
0.80 |
1.26 |
2.32 |
6.77 |
|
MSC |
3 |
0.89 |
0.79 |
1.31 |
2.23 |
6.51 |
|
|
SGs |
4 |
0.89 |
0.80 |
1.26 |
2.32 |
6.77 |
|
|
1st D |
2 |
0.89 |
0.79 |
1.30 |
2.25 |
6.56 |
|
|
MSC+SGs |
5 |
0.90 |
0.81 |
1.23 |
2.37 |
6.93 |
|
|
MSC+1st D |
4 |
0.90 |
0.81 |
1.25 |
2.34 |
6.82 |
|
|
SGs+1st D |
3 |
0.89 |
0.80 |
1.26 |
2.32 |
6.77 |
|
|
MSC+SGs+1st D |
6 |
0.90 |
0.81 |
1.24 |
2.35 |
6.88 |
|
|
Crude fiber |
Raw |
4 |
0.78 |
0.60 |
2.40 |
1.62 |
5.29 |
|
MSC |
3 |
0.75 |
0.57 |
2.50 |
1.55 |
5.08 |
|
|
SGs |
4 |
0.78 |
0.60 |
2.40 |
1.62 |
5.29 |
|
|
1st D |
2 |
0.73 |
0.54 |
2.58 |
1.50 |
4.92 |
|
|
MSC+SGs |
5 |
0.78 |
0.61 |
2.36 |
1.64 |
5.38 |
|
|
MSC+1st D |
4 |
0.77 |
0.60 |
2.41 |
1.61 |
5.27 |
|
|
SGs+1st D |
3 |
0.77 |
0.59 |
2.43 |
1.60 |
5.22 |
|
|
MSC+SGs+1st D |
6 |
0.79 |
0.63 |
2.31 |
1.68 |
5.49 |
|
|
Extract ether |
Raw |
4 |
0.75 |
0.56 |
0.28 |
1.57 |
6.29 |
|
MSC |
3 |
0.73 |
0.54 |
0.29 |
1.52 |
6.07 |
|
|
SGs |
4 |
0.75 |
0.56 |
0.28 |
1.57 |
6.29 |
|
|
1st D |
2 |
0.72 |
0.52 |
0.30 |
1.47 |
5.87 |
|
|
MSC+SGs |
5 |
0.74 |
0.56 |
0.28 |
1.57 |
6.29 |
|
|
MSC+1st D |
4 |
0.73 |
0.54 |
0.29 |
1.52 |
6.07 |
|
|
SGs+1st D |
3 |
0.74 |
0.54 |
0.29 |
1.52 |
6.07 |
|
|
MSC+SGs+1st D |
6 |
0.76 |
0.58 |
0.28 |
1.57 |
6.29 |
|
|
Ash |
Raw |
4 |
0.43 |
0.18 |
1.22 |
1.13 |
3.83 |
|
MSC |
3 |
0.43 |
0.18 |
1.22 |
1.13 |
3.83 |
|
|
SGs |
4 |
0.43 |
0.18 |
1.22 |
1.13 |
3.83 |
|
|
1st D |
2 |
0.43 |
0.18 |
1.22 |
1.13 |
3.83 |
|
|
MSC+SGs |
5 |
0.43 |
0.18 |
1.22 |
1.13 |
3.83 |
|
|
MSC+1st D |
4 |
0.43 |
0.18 |
1.22 |
1.13 |
3.83 |
|
|
SGs+1st D |
3 |
0.43 |
0.18 |
1.22 |
1.13 |
3.83 |
|
|
MSC+SGs+1st D |
6 |
0.43 |
0.18 |
1.22 |
1.13 |
3.83 |
|
|
Nitrogen-free extract |
Raw |
10 |
0.33 |
0.11 |
3.09 |
1.07 |
4.68 |
|
MSC |
10 |
0.37 |
0.13 |
3.05 |
1.09 |
4.74 |
|
|
SGs |
10 |
0.33 |
0.11 |
3.10 |
1.07 |
4.67 |
|
|
1st D |
10 |
0.43 |
0.18 |
2.96 |
1.12 |
4.89 |
|
|
MSC+SGs |
10 |
0.36 |
0.13 |
3.06 |
1.08 |
4.73 |
|
|
MSC+1st D |
10 |
0.43 |
0.18 |
2.96 |
1.12 |
4.89 |
|
|
SGs+1st D |
10 |
0.44 |
0.19 |
1.22 |
2.72 |
11.86 |
|
|
MSC+SGs+1st D |
10 |
0.43 |
0.18 |
2.96 |
1.12 |
4.89 |
MSC: multiplicative scatter correction, SGs: savitzky-golay smoothing, 1st D: first derivative, LVs: latent variables, r: koefisien korelasi, R2: koefisien determinasi, RMSE: root mean square error, RPD: residual predictive deviation index, RER: range error ration.
However, minerals are predictable when they belong to organic complexes or are due to mineral-induced changes in the absorbance region of the water spectrum [26]. The PLS calibration model for predicting NFE content also shows poor performance. Table 2 shows that the results of the PLS calibration in the raw and pretreatment data did not indicate any significant changes.
The value obtained from the results for the NFE content did not meet the standard (low R2 value), even though the LV number was increased to 10 factors. However, among the pretreatment methods in Table 2, the SGs+1st D combination reported a higher calibration value than other methods, namely R2 = 0.19, RMSE = 1.22, RPD = 2.72, and RER = 11.86. R2 values between 0.75 and 1.00 indicate an acceptable calibration equation. Even though the acceptable calibration ranges from 0.75 to 1.00, the model with a value of R2 between 0.30 and 0.75 is considered useful for differentiating between low, medium, and high concentrations. Meanwhile, when the value is less than 0.30, the calibration model is considered useless [27, 28].
The study demonstrates that a combination of Near Infrared Reflectance Spectroscopy (NIRS) and chemometrics can effectively and simultaneously assess the nutritional attributes of fermented cocoa pod husk. Through the application of various pretreatment methods, the reliability of the model construction can be significantly enhanced. The combined pretreatment method showed superior performance in increasing model reliability compared to specific pretreatments, as demonstrated in the models' assessment for dry matter content (MSC+SGs+1st D), crude protein (MSC+SGs), crude fiber content (MSC+SGs+1st D), and extract ether (MSc+SGs+1st D), as well as ash content and NFE.
The explicit practical implications of these findings for the industry can be summarized as follows: integrating these models into existing quality control processes stands to enhance efficiency, improve decision-making, and streamline feed formulation, ultimately leading to cost reductions and increased accuracy in feed production. However, it's important to acknowledge potential limitations like the need for ongoing calibration maintenance and ensuring sample representativeness. By discussing these potential implications, the conclusion can provide a more comprehensive and actionable insight into the practical benefits and limitations associated with these models.
The authors express gratitude to DRPM Kemdikvud Ristek for supporting this study through WCR research scheme 2023. The authors are alo grateful to LPPM Universitas Syiah Kuala for administrative supports.
[1] Umela, S. (2016). Fermentasi kulit buah kakao (Theobroma cacao) sebagai bahan pakan ternak. Jurnal Technopreneur (JTech), 4(2): 107-115. https://doi.org/10.30869/jtech.v4i2.64
[2] Campos-Vega, R., Nieto-Figueroa, K.H., Oomah, B.D. (2018). Cocoa (Theobroma cacao L.) pod husk: Renewable source of bioactive compounds. Trends in Food Science & Technology, 81: 172-184. https://doi.org/10.1016/j.tifs.2018.09.022
[3] Wajizah, S., Zulfahrizal, Z., Munnawar, A.A. (2022). Near infrared technology for determining cacao pod husk quality attributes as animal feed by means of PLSR approach. IOP Conference Series: Earth and Environmental Science, 995(1): 012010. https://doi.org/10.1088/1755-1315/995/1/012010
[4] Oddoye, E.O., Agyente-Badu, C.K., Gyedu-Akoto, E. (2013). Cocoa and its by-products: Identification and utilization. Chocolate in Health and Nutrition, 23-37. https://doi.org/10.1007/978-1-61779-803-0_3
[5] Laconi, E.B., Jayanegara, A. (2015). Improving nutritional quality of cocoa pod (Theobroma cacao) through chemical and biological treatments for ruminant feeding: In vitro and in vivo evaluation. Asian-Australasian Journal of Animal Sciences, 28(3): 343. https://doi.org/10.5713/ajas.13.0798
[6] Puastuti, W., Susana, I.W.R. (2014). Potensi dan pemanfaatan kulit buah kakao sebagai pakan alternatif ternak ruminansia. Wartazoa, 24(3): 151-159. https://doi.org/10.14334/wartazoa.v24i3.1072
[7] Samadi, S., Wajizah, S., Munawar, A.A. (2018). Rapid and simultaneous determination of feed nutritive values by means of near infrared spectroscopy. Tropical Animal Science Journal, 41(2): 121-127. https://doi.org/10.5398/tasj.2018.41.2.121
[8] Hidayat, T., Al-Majid, F., Wajizah, S., Usman, Y. (2022). Evaluation of nutritive values and digestibility’s cacao (Theobroma cacao L.) pod husk fermented with lingzhi mushroom (Ganoderma lucidum) at different concentration and incubation time. IOP Conference Series: Earth and Environmental Science, 951(1): 012024. https://doi.org/10.1088/1755-1315/951/1/012024
[9] Manley, M. (2014). Near-infrared spectroscopy and hyperspectral imaging: Non-destructive analysis of biological materials. Chemical Society Reviews, 43(24): 8200-8214. https://doi.org/10.1039/C4CS00062E
[10] Alagappan, S., Hoffman, L.C., Mantilla, S.M.O., Mikkelsen, D., James, P., Yarger, O., Cozzolino, D. (2022). Near infrared spectroscopy as a traceability tool to monitor black soldier fly larvae (Hermetia illucens) intended as animal feed. Applied Sciences, 12(16): 8168. https://doi.org/10.3390/app12168168
[11] Munawar, A.A., Meilina, H., Pawelzik, E. (2022). Near infrared spectroscopy as a fast and non-destructive technique for total acidity prediction of intact mango: Comparison among regression approaches. Computers and Electronics in Agriculture, 193: 106657. https://doi.org/10.1016/J.COMPAG.2021.106657
[12] Samadi, Wajizah, S., Munawar, A.A. (2020). Near infrared spectroscopy (NIRS) data analysis for a rapid and simultaneous prediction of feed nutritive parameters. Data in Brief, 29: 105211. https://doi.org/10.1016/J.DIB.2020.105211
[13] Mishra, P., Verkleij, T., Klont, R. (2021). Improved prediction of minced pork meat chemical properties with near-infrared spectroscopy by a fusion of scatter-correction techniques. Infrared Physics & Technology, 113: 103643. https://doi.org/10.1016/j.infrared.2021.103643
[14] Official Methods of Analysis of AOAC International, 18th ed. (2006). AOAC International, Maryland, USA.
[15] Nicolai, B.M., Beullens, K., Bobelyn, E., Peirs, A., Saeys, W., Theron, K.I., Lammertyn, J. (2007). Nondestructive measurement of fruit and vegetable quality by means of NIR spectroscopy: A review. Postharvest Biology and Technology, 46(2): 99-118. https://doi.org/10.1016/j.postharvbio.2007.06.024
[16] Munawar, A.A., von Hörsten, D., Wegener, J.K., Pawelzik, E., Mörlein, D. (2016). Rapid and non-destructive prediction of mango quality attributes using Fourier transform near infrared spectroscopy and chemometrics. Engineering in Agriculture, Environment and Food, 9(3): 208-215. https://doi.org/10.1016/j.eaef.2015.12.004
[17] Yao, W., Liu, R., Zhang, F., Li, S., Huang, X., Guo, H., Peng, M., Zhong, G. (2022). Detecting aflatoxin B1 in peanuts by fourier transform near-infrared transmission and diffuse reflection spectroscopy. Molecules, 27(19): 6294. https://doi.org/10.3390/molecules27196294
[18] Liu, Y.D., Wu, M.M., Li, Y.F., Sun, X.D., Hao, Y. (2017). Comparison of reflection and diffuse transmission for detecting solid soluble contents and ratio of sugar and acid in apples by on-line Vis/NIR spectroscopy. Spectroscopy and Spectral Analysis, 37(8): 2424-2429. https://doi.org/10.3964/J.ISSN.1000-0593(2017)08-2424-06
[19] Shen, F., Wu, Q., Liu, P., Jiang, X., Fang, Y., Cao, C. (2018). Detection of Aspergillus spp. Contamination levels in peanuts by near infrared spectroscopy and electronic nose. Food Control, 93: 1-8. https://doi.org/10.1016/j.foodcont.2018.05.039
[20] Meenu, M., Zhang, Y., Kamboj, U., Zhao, S., Cao, L., He, P., Xu, B. (2021). Rapid determination of β-glucan content of hulled and naked oats using near infrared spectroscopy combined with chemometrics. Foods, 11(1): 43. https://doi.org/10.3390/foods11010043
[21] Sun, M., Zhang, D., Liu, L., Wang, Z. (2017). How to predict the sugariness and hardness of melons: A near-infrared hyperspectral imaging method. Food Chemistry, 218: 413-421. https://doi.org/10.1016/j.foodchem.2016.09.023
[22] Anyidoho, E.K., Teye, E., Agbemafle, R. (2021). Differentiation of organic cocoa beans and conventional ones by using handheld NIR spectroscopy and multivariate classification techniques. International Journal of Food Science, 2021: 1844675. https://doi.org/10.1155/2021/1844675
[23] Saeys, W., Mouazen, A.M., Ramon, H. (2005). Potential for onsite and online analysis of pig manure using visible and near infrared reflectance spectroscopy. Biosystems Engineering, 91(4): 393-402. https://doi.org/10.1016/j.biosystemseng.2005.05.001
[24] Parrini, S., Staglianò, N., Bozzi, R., Argenti, G. (2021). Can grassland chemical quality be quantified using transform near-infrared spectroscopy?. Animals, 12(1): 86. https://doi.org/10.3390/ani12010086
[25] Karoui, R., Mouazen, A.M., Dufour, É., Pillonel, L., Schaller, E., De Baerdemaeker, J., Bosset, J.O. (2006). Chemical characterisation of European Emmental cheeses by near infrared spectroscopy using chemometric tools. International Dairy Journal, 16(10): 1211-1217. https://doi.org/10.1016/J.IDAIRYJ.2005.10.002
[26] Alemu, T., Wamatu, J., Tolera, A., Beyan, M., Eshete, M., Alkhtib, A., Rischkowsky, B. (2021). Optimizing near infrared reflectance spectroscopy to predict nutritional quality of chickpea straw for livestock feeding. Animals, 11(12): 3409. https://doi.org/10.3390/ani11123409
[27] Shenk, J.S., Workman Jr, J.J., Westerhaus, M.O. (2007). Application of NIR spectroscopy to agricultural products. In: Handbook of near-infrared analysis, pp. 365-404. CRC Press.
[28] Ikoyi, A.Y., Younge, B.A. (2022). Faecal near-infrared reflectance spectroscopy profiling for the prediction of dietary nutritional characteristics for equines. Animal Feed Science and Technology, 290: 115363. https://doi.org/10.1016/j.anifeedsci.2022.115363