Rika Favoria Gusa* | Asmar | Ghiri Basuki Putra | Wahri Sunanda | Yudi Setiawan
© 2026 The authors. This article is published by IIETA and is licensed under the CC BY 4.0 license (http://creativecommons.org/licenses/by/4.0/).
OPEN ACCESS
Reliable engineering decisions increasingly rely on computational models whose predictions are affected by uncertainties in measured input parameters. Identifying the parameters that most strongly influence model responses is therefore essential for improving uncertainty quantification and engineering decision support. This study proposes a systematic engineering approach that combines deterministic energy system modelling, uncertainty characterization, and Morris Global Sensitivity Analysis (GSA) to evaluate parameter influence across multiple engineering response variables within a unified analytical workflow. Unlike conventional sensitivity studies that evaluate individual performance indicators separately, the proposed approach performs a comparative sensitivity assessment across multiple system responses simultaneously. The methodology is demonstrated using a deterministic regional energy planning model comprising 29 uncertain engineering input parameters grouped into six engineering categories and evaluated against six engineering response variables. The results show that gas generation capacity is the dominant parameter for annual system cost (normalized mean absolute elementary effect (μ*) = 1.00), whereas interconnection capacity governs carbon emissions and external electricity supply (normalized μ* = 1.00). Biomass generation capacity and biomass capacity factor primarily determine renewable energy share (normalized μ* = 1.00 and 0.99), while electricity demand exerts the greatest influence on fossil generation share and energy balance (normalized μ* = 1.00). Comparative sensitivity evaluation further identifies gas generation capacity as the most influential parameter across all engineering response variables, with a mean normalized sensitivity of 0.596, followed by electricity demand (0.557), coal generation capacity (0.522), and interconnection capacity (0.514). The proposed approach provides a practical procedure for uncertainty-oriented engineering measurement, parameter prioritization, and sensitivity-informed decision support.
Morris Global Sensitivity Analysis, engineering measurement, uncertainty quantification, parameter prioritization
Modern engineering systems are becoming increasingly complex due to the integration of heterogeneous technologies, large-scale datasets, advanced computational models, and interconnected infrastructures [1, 2]. In practical engineering applications, decision-making is rarely based on deterministic information alone because model inputs are inherently affected by uncertainties arising from measurement errors, temporal variability, incomplete observations, parameter estimation, and simplifying modelling assumptions [3, 4]. These uncertainties propagate through computational models and influence predicted system responses, potentially leading to suboptimal engineering decisions when they are not adequately quantified [5]. Consequently, understanding how uncertainties affect engineering models has become an essential aspect of model validation, uncertainty quantification, and reliable decision support across numerous engineering disciplines.
Sensitivity analysis provides a systematic framework for investigating how variations in uncertain input parameters influence engineering responses [6]. Beyond identifying influential parameters, sensitivity analysis supports model interpretation, parameter screening, uncertainty propagation, experimental design, and measurement reliability assessment [7, 8]. It also provides an effective means of testing model robustness, examining the dependence of outputs on input assumptions, and improving the transparency of model-based assessments [9]. These capabilities have led to its widespread adoption in manufacturing systems, environmental monitoring, structural engineering, medical instrumentation, fluid mechanics, and energy systems. As engineering models continue to increase in dimensionality and complexity, sensitivity analysis has evolved from a complementary validation procedure into an indispensable tool for supporting engineering measurements and strengthening confidence in computational predictions [10, 11].
Sensitivity analysis methods are generally classified into local and global approaches [12]. Local sensitivity methods evaluate parameter influence around a nominal operating point and are computationally efficient, but they frequently fail to capture nonlinear system behaviour and interactions among uncertain parameters [13]. In contrast, Global Sensitivity Analysis (GSA) explores the entire parameter space by simultaneously varying uncertain inputs according to predefined probability distributions [14]. Among the available global methods, variance-based techniques such as Sobol analysis provide comprehensive sensitivity decomposition but usually require a large number of model evaluations, making them computationally demanding for engineering systems involving numerous uncertain parameters [15, 16]. The Morris GSA method offers an attractive alternative by combining computational efficiency with effective parameter screening [17]. Through the calculation of elementary effects and the statistical measures of the mean absolute elementary effect (μ*) and the standard deviation (σ), the Morris method simultaneously quantifies parameter importance while identifying potential nonlinear effects and parameter interactions [18]. These characteristics make Morris GSA particularly suitable for computationally intensive engineering models with high-dimensional uncertain parameter spaces.
Recent advances have extended GSA beyond conventional single-response models toward multivariate and multi-response engineering systems. Recent studies have proposed multivariate sensitivity analysis frameworks capable of simultaneously evaluating multiple correlated model outputs, thereby overcoming the limitations of analysing each response independently [19]. Other studies have further demonstrated that GSA can be formulated as a unified framework for comparative evaluation of multiple mathematical models under uncertainty, highlighting its broader role in engineering assessment and decision support [20]. More recently, GSA has been extended to multi-input multi-output engineering systems, emphasizing that parameter importance should be evaluated across multiple correlated performance indicators rather than through isolated model outputs [21]. Although these developments have substantially advanced multi-response sensitivity analysis, they are predominantly based on variance-based methods, surrogate modelling, or comparative model-analysis frameworks. Comparatively few studies have adopted the computationally efficient Morris screening approach within a unified framework that systematically compares parameter influence across multiple engineering response variables while integrating parameter ranking, interaction assessment, and multidimensional visualization into a single analytical workflow.
Despite the growing adoption of GSA, several important limitations remain in the existing literature. First, many studies evaluate parameter influence using only a single response variable, such as cost, efficiency, or emissions, even though practical engineering systems are typically characterized by multiple interdependent performance indicators [22]. Second, although recent studies have increasingly considered multiple engineering response variables, comparative interpretation of parameter importance across these responses remains limited, making it difficult to determine whether an uncertain parameter consistently dominates overall system behaviour or primarily influences individual performance indicators [8]. Third, although visualization has become increasingly important for interpreting high-dimensional sensitivity information, most existing studies employ individual visualization techniques independently, without integrating parameter ranking, interaction assessment, and cross-response comparison into a unified analytical framework [23]. As a result, translating sensitivity analysis results into practical engineering insights and measurement-informed decision support remains challenging, particularly for complex systems involving numerous uncertain inputs and multiple competing objectives [24].
Regional energy planning represents a representative engineering application in which these challenges become particularly significant [25]. Planning decisions rely on numerous uncertain technical, economic, and operational parameters [26], including electricity demand, generation capacities, technology costs, emission factors, renewable resource characteristics, and interconnection capabilities. Variations in these parameters simultaneously influence multiple engineering response variables, including annual system cost, carbon emissions, renewable energy penetration, fossil generation share, external electricity dependence, and overall energy balance. From a measurement perspective, these quantities constitute engineering performance indicators whose reliability depends on the accurate characterization and propagation of uncertain input parameters [27]. Therefore, identifying the parameters that most strongly influence these response variables is essential not only for improving model reliability but also for prioritizing measurement efforts, reducing uncertainty, and supporting robust engineering decision-making.
To address these limitations, this study proposes a systematic engineering approach for uncertainty-oriented sensitivity assessment using the Morris GSA method. The proposed approach combines deterministic system modelling, systematic uncertainty characterization, Morris-based parameter screening, multidimensional visualization, and comparative cross-response sensitivity interpretation within a unified analytical workflow. By evaluating multiple engineering response variables simultaneously, the proposed procedure enables the identification of parameters that consistently influence overall system performance rather than individual indicators alone. A deterministic regional energy system model is employed as a representative case study to demonstrate the applicability of the proposed approach to a complex engineering problem involving numerous uncertain inputs and multiple competing performance objectives.
The main contributions of this study are fourfold. First, a systematic engineering workflow is proposed that combines deterministic engineering modelling, uncertainty characterization, and Morris GSA for uncertainty-oriented sensitivity assessment. Second, the workflow integrates parameter screening, sensitivity ranking, multidimensional visualization, and comparative interpretation across multiple engineering response variables within a unified analytical procedure. Third, it enables the identification of critical parameters that consistently influence different engineering performance indicators, thereby facilitating more comprehensive uncertainty quantification than conventional single-response analyses. Finally, the applicability of the workflow is demonstrated through a regional energy planning case study, illustrating how measurement-informed sensitivity analysis can support model interpretation, uncertainty reduction, and engineering decision support in complex computational systems.
The proposed methodology integrates deterministic engineering modelling with uncertainty characterization and Morris GSA to evaluate the influence of uncertain input parameters on multiple engineering response variables. The methodology consists of four main stages: engineering framework and system description, input parameter uncertainty characterization, Morris GSA, and sensitivity evaluation through parameter ranking and comparative visualization. Each stage is described in the following subsections.
2.1 Engineering framework and system description
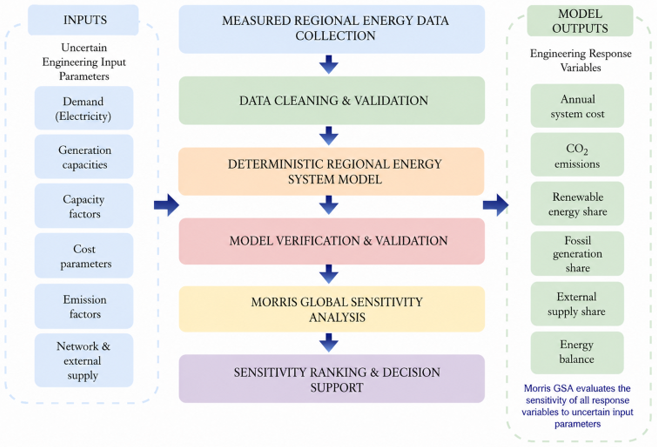
Figure 1 illustrates the overall engineering framework adopted in this study. The proposed methodology integrates measured regional energy data, deterministic engineering modelling, uncertainty characterization, and Morris GSA into a unified workflow for evaluating the influence of uncertain input parameters on multiple engineering response variables. Rather than analysing individual model outputs independently, the proposed workflow enables a systematic assessment of parameter importance across multiple engineering performance indicators, thereby providing a comprehensive basis for uncertainty quantification and engineering decision support.
Figure 1. Proposed engineering framework
The framework consists of six sequential stages, including data preparation, deterministic system modelling, model verification, Morris GSA, sensitivity evaluation, and engineering decision support. Measured regional energy data are initially collected, organized, and validated to establish a consistent modelling database. The processed data are subsequently used to construct a deterministic regional energy system model representing the baseline operating conditions. Model verification is then performed through a series of internal consistency and physical feasibility checks to ensure that the deterministic baseline model satisfies the fundamental engineering requirements before sensitivity analysis. The verification procedure confirms positive electricity demand and electricity supply, an acceptable annual energy balance within a practical engineering tolerance of ±5% to account for minor numerical discrepancies, physically meaningful renewable, fossil, and external electricity supply shares, non-negative economic and environmental outputs, and valid engineering parameter ranges for generation capacity, capacity factor, variable generation cost, and emission factor. Such predefined verification criteria are consistent with recommended engineering modelling practice for establishing model reliability prior to further analysis [28]. In addition, consistency checks are conducted to ensure that aggregated electricity generation, annual system cost, and carbon emissions obtained from individual generation technologies are fully consistent with the corresponding system-level totals. Only after all verification criteria are satisfied is the deterministic baseline model used for the subsequent Morris GSA. Finally, the elementary effects obtained from Morris GSA are synthesized through parameter ranking, interaction assessment, and comparative sensitivity visualization to identify the most influential uncertain parameters and support engineering decision-making.
2.2 Input parameters uncertainty characterization
Engineering models inevitably contain uncertainties originating from measurement errors, temporal variability, parameter estimation, and simplifying assumptions. Proper characterization of these uncertainties is therefore essential to ensure that sensitivity analysis adequately represents realistic operating conditions and parameter variability. In the present study, uncertainty characterization was performed by identifying model input parameters that directly influence the deterministic regional energy system model and assigning uncertainty ranges based on engineering judgement, published techno-economic data, and available regional energy statistics.
The selected uncertain input parameters represent the principal technical, economic, and operational characteristics of the regional energy system. These include electricity demand, installed generation capacities, renewable energy capacity factors, variable generation costs, emission factors, and interconnection characteristics. In total, the uncertainty characterization comprises 29 individual engineering input parameters. These consist of one electricity demand parameter together with generation capacity, capacity factor, variable generation cost, and emission factor parameters for each active generation technology and the interconnection system. For presentation purposes, the 29 individual uncertain parameters are grouped into the engineering categories shown in Table 1, whereas the Morris analysis was performed using all individual parameters. Each parameter was assigned a baseline value representing the deterministic operating condition and an uncertainty interval defining the allowable variation during the Morris GSA. The uncertainty ranges were selected to reflect realistic operating conditions while maintaining consistency with commonly adopted assumptions in engineering system modelling. Table 1 summarizes the input parameters together with their corresponding baseline values, perturbation ranges, units, and data sources.
Table 1. Baseline input parameters and perturbation ranges used in the regional energy system model
|
Input Parameter/Reference |
Nominal Value |
Perturbation Range |
|
Annual electricity demand (GWh/year), according to an unpublished technical report from PLN, 2025 |
1,990.70 |
±5% |
|
Existing capacity by technology (MW), according to an unpublished technical report from PLN, 2025 |
Coal 83; gas 125; diesel 73.23; solar PV 1; wind 0; biomass 12.60; biogas 7.65; interconnection 100 |
±10% |
|
Maximum additional capacity (MW) [29] |
Solar PV 2,810; wind 1,787; biomass 217.70; biogas 5.40 |
Not perturbed in the 2025 baseline |
|
Capacity factor [30] |
Coal 0.75; gas 0.50; diesel 0.30; solar PV 0.18; wind 0.25; biomass and biogas 0.70; interconnection 0.75 |
±10% |
|
Variable generation cost (USD/MWh) [30] |
Coal 1.50; gas 2.60; diesel 7.30; solar PV 0; wind 0; biomass and biogas 3.40; interconnection 3.80 |
±10% |
|
Emission factor (tCO₂/MWh) [31] |
Coal 0.341; gas 0.202; diesel 0.267; solar PV 0; wind 0; biomass and biogas 0.360; interconnection 0.341 |
±5% |
The engineering input data were compiled from a combination of official government reports, utility publications, publicly available regional energy statistics, and peer-reviewed technical literature. Official government reports and utility publications were adopted because they constitute the primary reference sources for regional energy planning and infrastructure assessment, providing officially reported information on electricity demand, installed generation capacities, generation technology characteristics, and system operation. To ensure data reliability, the collected datasets were subjected to consistency checks by comparing values across multiple official sources where available and verifying that all engineering parameters were physically reasonable and internally consistent with the deterministic model assumptions. When official statistics were unavailable for specific techno-economic parameters, the corresponding values were supplemented using peer-reviewed engineering literature reporting established techno-economic data. The compiled datasets did not contain any missing values requiring statistical imputation. All input parameters were subsequently reviewed prior to uncertainty characterization to ensure completeness, consistency, and engineering plausibility.
The maximum additional capacities listed in Table 1 were retained as deterministic planning constraints and were not perturbed because the analysis employed the existing-capacity configuration for the 2025 baseline system.
The uncertain parameters were represented as bounded engineering intervals defined by their prescribed perturbation ranges of ±5% or ±10% around the corresponding baseline values. No parameter-specific continuous probability distributions, such as normal or triangular distributions, were imposed. Instead, each uncertain parameter was mapped onto a normalized input space ranging from 0 to 1 and evaluated using the discrete grid adopted in the Morris trajectory design. This bounded grid-based representation was selected because reliable empirical probability distributions were unavailable for several engineering parameters and because the primary objective of the analysis was to screen and rank parameter influence over plausible operating ranges rather than to estimate probabilistic output distributions.
Following this bounded interval representation, all uncertain parameters were independently perturbed within their predefined ranges while the remaining model structure and operational constraints were preserved. This approach enables the Morris method to evaluate the relative influence of each uncertain parameter on multiple engineering response variables under a consistent deterministic modelling framework. Consequently, the resulting sensitivity indices primarily reflect the influence of parameter uncertainty rather than structural modifications of the engineering model.
Consistent with the standard Morris screening formulation, all uncertain input parameters were perturbed independently, and potential statistical dependencies among parameters were not explicitly modelled.
This assumption was adopted to enable computationally efficient one-at-a-time perturbations over the predefined uncertainty space while preserving a transparent interpretation of the elementary effects. Although practical dependencies may exist among certain engineering parameters, such as between installed generation capacity and capacity factor or between generation technology and emission factor, modelling such relationships requires additional empirical evidence or probabilistic dependency models that were beyond the scope of the present study. The reported sensitivity rankings should therefore be interpreted as reflecting the relative influence of independently varying parameters within the specified uncertainty ranges. The incorporation of parameter dependency structures remains an important extension of the proposed framework and may provide further insight into the influence of correlated uncertainties on global sensitivity rankings.
2.3 Morris Global Sensitivity Analysis
The Morris GSA method is a screening-based global sensitivity technique developed to identify the relative importance of uncertain input parameters while maintaining a relatively low computational cost. Unlike local sensitivity methods, which evaluate parameter influence around a single operating point, Morris GSA explores the entire input space by sequentially perturbing one parameter at a time along multiple randomly generated trajectories. This sampling strategy enables the method to capture both the direct influence of individual parameters and potential nonlinear behaviour or interactions among parameters without requiring the extensive model evaluations associated with variance-based approaches such as Sobol analysis. It should be noted that the Morris method is primarily intended as a global screening technique for identifying the relative importance of uncertain input parameters through elementary effects rather than for quantifying each parameter's contribution to output variance. Accordingly, the resulting sensitivity indices should be interpreted as relative measures for parameter prioritization within the predefined uncertainty ranges rather than as variance decomposition metrics.
In this study, the Morris sampling design employed $p=4$ discrete levels in the normalized input space, resulting in a perturbation step size of $\Delta=\frac{p}{2(p-1)}=\frac{2}{3}$, following the standard Morris formulation. A total of 30 sampling trajectories were generated, each initialized from a randomly selected feasible starting point on the normalized sampling grid. Within each trajectory, the order of parameter perturbations and the perturbation directions were randomly assigned while ensuring that only one parameter was perturbed at each sampling step. No trajectory optimization algorithm was employed, as the objective of the present study was efficient parameter screening rather than maximizing trajectory dispersion. This configuration was selected to provide adequate exploration of the predefined uncertainty space while maintaining computational efficiency for the regional energy system model. The Morris method was selected because the primary objective of this study was to identify and rank the most influential uncertain engineering parameters across multiple engineering response variables. Compared with variance-based methods such as Sobol analysis, Morris requires substantially fewer model evaluations while still providing effective parameter screening and indicating potential nonlinear effects and parameter interactions. Therefore, the Morris method provides an appropriate balance between computational efficiency and sensitivity information for deterministic regional energy system models involving numerous uncertain inputs.
For a model with k uncertain input parameters, the elementary effect (EE) of the i-th parameter is defined as the change in the model response resulting from a finite perturbation of that parameter while all remaining parameters are held constant [32]. The elementary effect is expressed as
$E E_i=\frac{Y\left(x_1, \ldots, x_i+\Delta, \ldots, x_k\right)-Y\left(x_1, \ldots, x_i, \ldots, x_k\right)}{\Delta}$ (1)
where, $Y(\cdot)$ denotes the model response, $x_i$ is the normalized value of the i-th input parameter, and $\Delta$ represents the predefined perturbation step within the normalized parameter space. Multiple elementary effects are generated for each parameter using different sampling trajectories to ensure that the sensitivity estimates adequately represent the global behaviour of the engineering model.
The elementary effects obtained from all sampling trajectories are subsequently summarized using two statistical indices [33, 34]. The first index is the mean absolute elementary effect, μ*, which quantifies the overall influence of an uncertain parameter on the model response and is calculated as
$\mu^*=\frac{1}{r} \sum_{j=1}^r\left|E E_{i, j}\right|$ (2)
where, r denotes the number of sampling trajectories. A larger value of μ* indicates that the corresponding parameter exerts a stronger influence on the engineering response variable.
The second index is the standard deviation of the elementary effects, σ, which measures the variability of the elementary effects across different sampling trajectories and is expressed as
$\sigma_i=\sqrt{\frac{1}{r-1} \sum_{j=1}^r\left(E E_{i, j}-E \bar{E}_l\right)^2}$ (3)
where, $E \bar{E}_l$ represents the mean elementary effect of the i-th parameter. High values of σ generally indicate nonlinear effects, parameter interactions, or both, whereas low values suggest that the parameter exhibits a relatively linear and independent influence on the model response.
In this study, Morris GSA was applied independently to each engineering response variable generated by the deterministic regional energy system model. The resulting $\mu^*$ values were used to rank the relative importance of uncertain input parameters, whereas the combined interpretation of $\mu^*$ and $\sigma$ provided additional insight into parameter interactions and nonlinear system behaviour. These sensitivity indices constitute the basis for the comparative ranking and visualization presented in the subsequent section.
2.4 Sensitivity analysis workflow
Following the deterministic model development and Morris GSA formulation, the proposed workflow was implemented to assess the influence of uncertain inputs on multiple engineering responses [35, 36]. It integrates uncertainty sampling, model evaluation, elementary-effect calculation, parameter ranking, and visualization to identify critical parameters and examine potential nonlinearities and interactions.
|
Algorithm 1. Integrated Morris GSA implementation workflow |
|
Input: Regional energy database; Baseline engineering parameters; Uncertainty ranges for all input parameters. Output: Morris sensitivity indices (μ*, σ); Parameter rankings; Comparative sensitivity evaluation. Procedure Model construction 1. Load and validate the regional energy database. 2. Construct the deterministic regional energy system model. 3. Verify the deterministic baseline model. Uncertainty characterization 4. Define uncertain input parameters. 5. Normalize parameter ranges. Morris sampling 6. Generate 30 random Morris sampling trajectories (p = 4, Δ = 2/3, random seed = 42). 7. For each Morris sampling point do Evaluate the deterministic model. Store engineering response variables. End for Sensitivity analysis 8. Compute elementary effects. 9. Calculate μ* and σ. 10. Rank uncertain parameters. 11. Compare parameter importance across engineering response variables. Visualization 12. Generate sensitivity rankings, μ*–σ interaction plots, and comparative visualizations. |
Algorithm 1 summarizes the computational implementation adopted in this study. Beginning with deterministic model construction and verification, the workflow proceeds through uncertainty characterization, Morris trajectory generation, deterministic model evaluation, elementary effect computation, sensitivity index calculation, parameter ranking, and comparative visualization. Together with the computational environment described in Section 2.5, the algorithm provides sufficient implementation details to facilitate reproduction of the proposed methodology by other researchers.
The computational configuration adopted in this study is summarized in Table 2. A total of 29 uncertain input parameters representing electricity demand, generation capacities, technical characteristics, economic variables, environmental factors, and interconnection attributes were considered. These parameters were evaluated against six engineering response variables, namely annual system cost, carbon emissions, renewable energy share, fossil generation share, external electricity supply share, and energy balance. Morris sampling was performed using 30 randomly generated sampling trajectories with four discrete sampling levels (p = 4), the standard perturbation step size of Δ = 2/3, and a fixed random seed of 42, resulting in 900 deterministic model evaluations and 841 elementary effects. The resulting elementary effects were subsequently used to calculate the μ* and σ for each input parameter–response variable combination.
Table 2. Configuration of the Morris Global Sensitivity Analysis (GSA)
|
Item |
Value |
|
Sensitivity analysis method |
Morris elementary effects |
|
Model type |
Deterministic regional energy system model |
|
Capacity representation |
Existing generation capacities |
|
Uncertain input parameters |
29 |
|
Model response variables |
6 |
|
Sampling levels (p) |
4 |
|
Perturbation step (Δ) |
2/3 |
|
Random seed |
42 |
|
Number of trajectories |
30 |
|
Total model evaluations |
900 |
|
Total elementary effects |
841 |
|
Baseline demand (GWh) |
1,990.70 |
|
Baseline cost (USD) |
15,966,784.41 |
|
Baseline emissions (tCO2) |
616,668.72 |
Following the computation of the Morris sensitivity indices, several complementary visualization techniques were employed to facilitate the interpretation of the results. The μ* was first used to rank the uncertain input parameters according to their relative influence on annual system cost. The combined interpretation of μ* and σ was subsequently illustrated using the Morris μ*–σ plot, allowing parameters with strong nonlinear behaviour or significant interactions to be identified. Finally, a normalized sensitivity matrix was constructed to compare parameter importance across all engineering response variables, thereby providing a comprehensive overview of the dominant uncertainty sources affecting regional energy system performance.
The overall workflow supports both quantitative sensitivity evaluation and engineering interpretation. By integrating parameter ranking, interaction assessment, and cross-response comparison within a single analytical framework, the proposed workflow provides a systematic basis for identifying influential uncertain parameters, prioritizing future measurement efforts, improving model calibration, and supporting evidence-based regional energy planning.
2.5 Computational implementation
The proposed engineering framework was implemented using Python 3.10.11 under the Microsoft Windows operating system. Numerical computation, data processing, and visualization were performed using NumPy 1.26.0, Pandas 2.1.1, and Matplotlib 3.8.0, respectively. The deterministic engineering model, uncertainty characterization, Morris GSA, sensitivity ranking, and comparative visualization were developed within a unified Python environment to ensure methodological consistency throughout the analysis. To facilitate reproducibility, the Morris sampling procedure employed a fixed random seed of 42, together with 30 sampling trajectories, four discrete sampling levels (p = 4), and the standard perturbation step size of Δ = 2/3. All computational experiments were executed on a workstation equipped with an AMD Ryzen 9 processor, 32 GB RAM, and a 1 TB solid-state drive (SSD).
The proposed engineering framework was evaluated using a deterministic regional energy system model integrated with Morris GSA to investigate the influence of uncertain input parameters on multiple engineering response variables. The analysis aims to identify the dominant uncertainty sources affecting regional energy system performance while providing complementary insights through parameter ranking, interaction assessment, and multidimensional visualization. The results are presented in four stages, including parameter ranking, interaction analysis, cross-response sensitivity evaluation, and comparative interpretation of the most influential engineering parameters.
3.1 Overall parameter importance
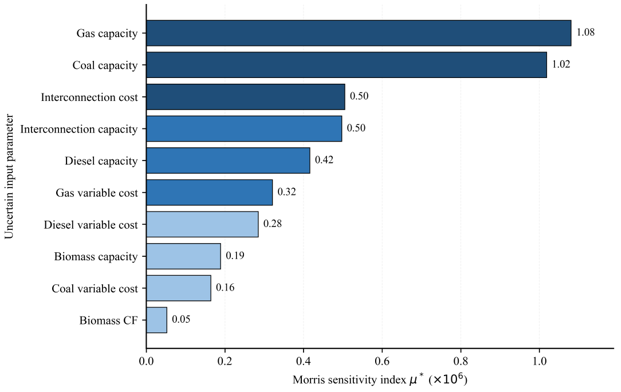
The first stage of the proposed sensitivity assessment examines the relative importance of uncertain input parameters using the Morris μ*. Larger values of μ* indicate that variations in an input parameter produce greater changes in the corresponding model response. In this study, parameter importance is evaluated from two complementary perspectives. Figure 2 presents the sensitivity ranking with respect to annual system cost, whereas Table 3 summarizes the overall parameter importance obtained by aggregating the normalized Morris sensitivity indices across all six engineering response variables. This dual representation enables both output-specific and system-level interpretations of parameter importance.
Figure 2. Morris sensitivity ranking of input parameters for annual system cost
Figure 2 shows that gas generation capacity is the most influential parameter affecting annual system cost, with a Morris sensitivity index (μ*) of 1.08 × 10⁶, followed by coal generation capacity (1.02 × 10⁶). The approximately 5.9% higher μ* value of gas generation capacity indicates that perturbations within its prescribed uncertainty range produce a measurably larger average variation in annual system cost than equivalent perturbations of coal generation capacity. Because μ* represents the mean absolute elementary effect obtained from multiple sampling trajectories, this result quantitatively confirms that uncertainty associated with gas generation capacity exerts the strongest average influence on the economic performance of the regional energy system. The substantial separation between these two parameters and the remaining variables indicates that uncertainties associated with dispatchable generation capacity dominate the economic performance of the regional energy system. Since coal- and gas-fired power plants supply the majority of electricity demand under the baseline operating conditions, changes in their available capacities directly alter generation dispatch, fuel consumption, and overall operating cost. Consequently, accurate characterization of these parameters is essential for improving the reliability of engineering measurements and reducing uncertainty in model-based economic assessments.
Table 3. Overall ranking of input parameters across all engineering response variables
|
Overall Rank |
Parameter |
Mean Normalized μ* |
Overall Importance |
|
1 |
Gas capacity |
0.596 |
Very High |
|
2 |
Demand |
0.557 |
Very High |
|
3 |
Coal capacity |
0.522 |
High |
|
4 |
Interconnection capacity |
0.514 |
High |
|
5 |
Biomass capacity |
0.229 |
High |
|
6 |
Biomass capacity factor |
0.205 |
Moderate |
|
7 |
Diesel capacity |
0.182 |
Moderate |
|
8 |
Interconnection emission factor |
0.085 |
Moderate |
|
9 |
Interconnection variable cost |
0.078 |
Moderate |
|
10 |
Coal emission factor |
0.071 |
Moderate |
The second group of influential parameters comprises interconnection cost and interconnection capacity, both exhibiting μ* values of approximately 0.50 × 10⁶, followed by diesel generation capacity (0.42 × 10⁶). The sensitivity indices of the interconnection-related parameters are less than one-half of that associated with gas generation capacity, indicating that although transmission-related uncertainties remain important, their average influence on annual system cost is substantially smaller than uncertainties in dispatchable generation capacity. These results indicate that the capability and economic conditions of electricity exchange with neighbouring systems also contribute substantially to annual system cost uncertainty. In contrast, gas variable generation cost, diesel variable generation cost, biomass capacity, coal variable generation cost, and biomass capacity factor exhibit considerably lower sensitivity indices, suggesting that uncertainties associated with these parameters produce relatively small variations in the economic response under the investigated operating conditions.
Although Figure 2 focuses exclusively on annual system cost, the overall ranking presented in Table 3 reveals a broader perspective of parameter importance across the entire engineering model. Gas generation capacity remains the most influential parameter, confirming its dominant contribution to system performance. However, the overall ranking also identifies electricity demand as one of the most influential variables because it simultaneously affects several engineering response variables, including renewable energy share, fossil generation share, external electricity supply, and energy balance. Similarly, biomass capacity and biomass capacity factor become more influential in the overall assessment than suggested by the cost-based ranking alone, reflecting their strong contributions to renewable energy penetration despite their relatively limited impact on annual system cost.
The comparison between the cost-specific ranking and the overall ranking demonstrates that parameter importance depends on the engineering response variable being considered. Parameters governing conventional generation capacities dominate the economic objective, whereas demand, renewable resource characteristics, and network-related variables become increasingly significant when multiple performance indicators are evaluated simultaneously. The combined use of absolute μ* values for annual system cost and normalized μ* values across multiple engineering responses enables both quantitative comparison of parameter influence within a specific objective and consistent evaluation of parameter importance across different performance indicators. These findings highlight the importance of multi-response sensitivity analysis for engineering applications, as relying on a single performance metric may overlook parameters that are critical for other aspects of system behaviour. From a practical perspective, the results provide a rational basis for prioritizing engineering measurements, improving parameter estimation, and allocating data collection efforts toward the variables that most strongly influence regional energy system performance.
3.2 Parameter interaction analysis
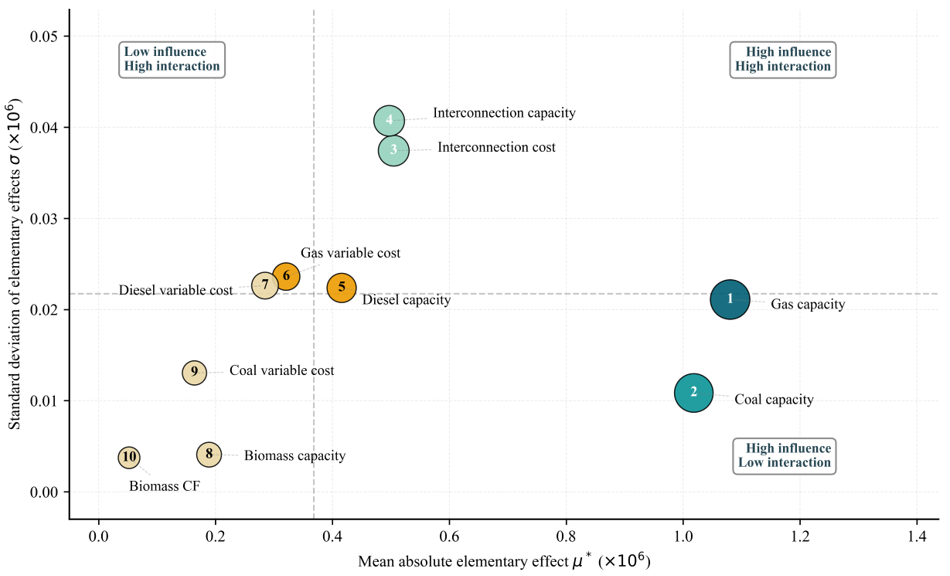
The Morris μ*–σ plot provides complementary information to the parameter ranking by simultaneously evaluating parameter importance and the variability of the corresponding elementary effects. While the μ* measures the overall influence of an uncertain parameter, the σ reflects the extent to which the parameter exhibits nonlinear behaviour or interacts with other uncertain inputs. Figure 3 presents the μ*–σ distribution of the ten most influential parameters for annual system cost.
Gas generation capacity exhibits the largest estimated Morris sensitivity index, with μ* = 1.080 × 10⁶ and σ = 0.021 × 10⁶, indicating that it is the most influential parameter for annual system cost within the adopted sampling design. Coal generation capacity follows closely with μ* = 1.018 × 10⁶ and a smaller interaction level (σ = 0.011 × 10⁶). The relatively high μ* values combined with moderate σ values indicate that variations in dispatchable generation capacities primarily influence system cost through direct effects rather than through strong nonlinear interactions. Consequently, accurate measurement and characterization of these capacity parameters are essential for improving the reliability of cost estimation.
Interconnection variable cost (μ* = 0.505 × 10⁶, σ = 0.037 × 10⁶) and interconnection capacity (μ* = 0.497 × 10⁶, σ = 0.041 × 10⁶) exhibit substantially larger σ values than the two highest-ranked parameters. Their locations in the upper-right region of Figure 3 indicate that these parameters participate in stronger interactions with other uncertain inputs. This behaviour suggests that the economic impact of interconnection resources depends not only on their individual values but also on simultaneous variations in demand, generation capacities, and system operating conditions.
Parameters with intermediate influence, including diesel generation capacity (μ* = 0.416 × 10⁶, σ = 0.022 × 10⁶), gas variable cost (μ* = 0.321 × 10⁶, σ = 0.024 × 10⁶), and diesel variable cost (μ* = 0.285 × 10⁶, σ = 0.023 × 10⁶), exhibit moderate sensitivity together with moderate interaction effects. Their influence on annual system cost remains important but is considerably smaller than that of gas and coal generation capacities. In contrast, biomass generation capacity (μ* = 0.189 × 10⁶) and biomass capacity factor (μ* = 0.052 × 10⁶) display both low μ* and low σ values, indicating that uncertainties associated with these parameters contribute only marginally to cost variability under the investigated operating conditions.
The μ*–σ analysis therefore extends the ranking results by distinguishing parameters dominated by direct effects from those influenced by nonlinear interactions. In particular, gas and coal generation capacities represent the most influential parameters with comparatively stable sensitivity behaviour, whereas interconnection-related parameters exhibit the strongest interaction effects. This additional information provides practical guidance for parameter characterization, uncertainty reduction, and measurement prioritization in regional energy system modelling.
3.3 Comparative sensitivity across engineering variables
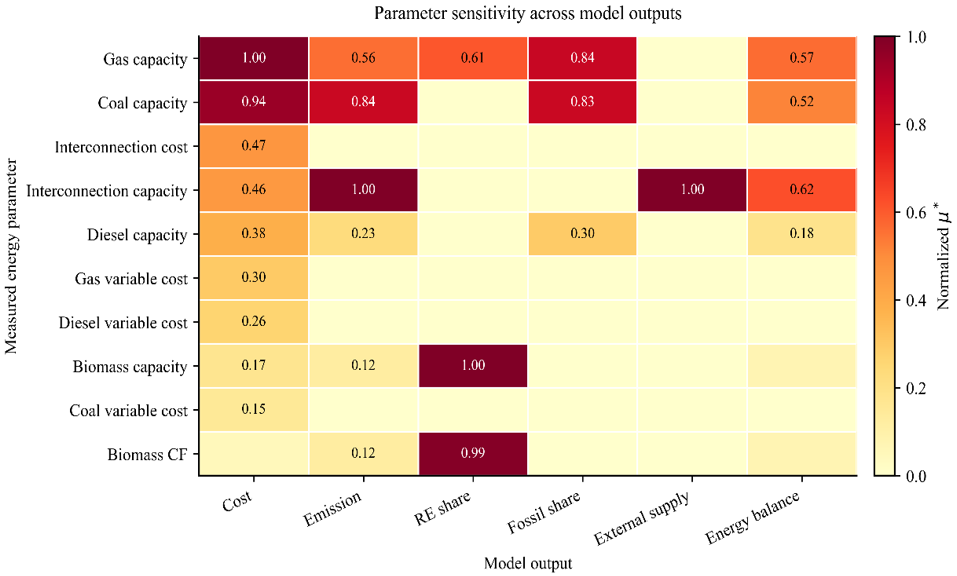
The sensitivity ranking and interaction analysis presented in the previous subsections focused exclusively on annual system cost as a representative engineering response. Although cost is one of the principal performance indicators in regional energy planning, practical decision making simultaneously considers multiple objectives, including carbon emissions, renewable energy penetration, fossil generation share, external electricity dependence, and overall energy balance. These engineering responses are governed by the same set of uncertain input parameters but often exhibit substantially different sensitivity characteristics. This highlights the need for evaluating sensitivity across multiple engineering response variables rather than relying on a single output. Figure 4 extends the Morris GSA by presenting the normalized μ* across all six engineering response variables, thereby enabling direct comparison of parameter importance throughout the entire regional energy system.
The comparative visualization reveals not only the dominant parameters for each response variable but also those that consistently influence several engineering objectives simultaneously.
Figure 4 demonstrates that gas generation capacity is the most consistently influential parameter across the investigated engineering responses. It achieves the highest normalized sensitivity for annual system cost with a value of 1.00, while maintaining relatively large sensitivities for fossil generation share (0.84), renewable energy share (0.61), energy balance (0.57), and carbon emissions (0.56). This behaviour indicates that variations in gas generation capacity propagate throughout multiple aspects of regional energy system operation rather than affecting only economic performance. From an engineering perspective, gas-fired generation serves as a flexible dispatchable resource in the studied regional energy system, where its generation output can be adjusted to accommodate demand fluctuations and complement less dispatchable generation sources. As a result, variations in available gas generation capacity directly influence dispatch scheduling, fuel allocation, renewable energy integration, and overall system balancing. Consequently, uncertainty associated with available gas capacity propagates simultaneously to several system outputs, making this parameter one of the primary drivers of overall model behaviour. The consistently high sensitivity values observed across multiple outputs also suggest that improving the accuracy of gas capacity estimation would contribute significantly to reducing uncertainty in regional energy planning models.
Figure 4. Normalized Morris sensitivity of input parameters across multiple model outputs
A similarly consistent pattern is observed for coal generation capacity, which represents the second most influential parameter overall. Coal capacity exhibits normalized sensitivities of 0.94 for annual system cost, 0.84 for carbon emissions, 0.83 for fossil generation share, and 0.52 for energy balance. These results indicate that coal-based generation continues to dominate both the economic and environmental characteristics of the regional power system. Unlike gas capacity, whose influence extends across operational flexibility, coal capacity primarily determines the amount of conventional electricity generation required to satisfy demand, thereby affecting fuel consumption, greenhouse gas emissions, and the proportion of fossil-based electricity within the generation mix. The comparable sensitivity magnitudes obtained for annual cost and emissions further demonstrate the strong coupling between economic and environmental objectives in systems where coal remains a major generating technology. This finding suggests that future planning strategies aimed at reducing both operational costs and emissions should prioritize uncertainties associated with dispatchable fossil generation capacity.
The influence pattern differs considerably for interconnection capacity and biomass-related parameters, indicating that several uncertain inputs primarily affect specific engineering objectives rather than the entire system simultaneously. Interconnection capacity exhibits the maximum normalized sensitivity (1.00) for external electricity supply and carbon emissions while also producing relatively high sensitivities for energy balance (0.62) and moderate influence on annual system cost (0.46). These results emphasize the critical role of transmission capability in determining electricity imports, system adequacy, and the resulting emission profile. In contrast, biomass generation capacity and biomass capacity factor dominate renewable energy share, with normalized sensitivities of 1.00 and 0.99, respectively. The almost identical sensitivity values indicate that both installed biomass capacity and resource availability contribute nearly equally to renewable energy penetration. Meanwhile, the normalized sensitivity of solar PV capacity for renewable energy share remains very small (0.02), suggesting that under the assumed planning scenario, uncertainty in existing PV deployment contributes relatively little to the overall variability of renewable energy penetration compared with biomass resources. These observations illustrate that the engineering significance of an uncertain parameter depends strongly on the specific performance indicator being evaluated.
Other uncertain parameters, including diesel generation capacity, gas variable cost, diesel variable cost, and coal variable cost, generally exhibit normalized sensitivity values below 0.40 for most engineering responses. Although these variables contribute to overall model uncertainty, their influence is considerably smaller than that of generation capacities and transmission-related parameters. The comparative analysis therefore demonstrates that parameter importance cannot be generalized using a single engineering objective because different response variables are governed by different subsets of uncertain inputs. Nevertheless, gas generation capacity, coal generation capacity, and interconnection capacity consistently remain among the dominant parameters across multiple engineering responses, indicating that these variables represent the principal sources of uncertainty within the regional energy system model. This multidimensional sensitivity evaluation constitutes one of the main contributions of the present study because it provides a comprehensive understanding of uncertainty propagation across several engineering performance indicators simultaneously. Such information is particularly valuable for uncertainty reduction, measurement prioritization, and future model calibration, where resources can be directed toward improving the characterization of parameters that exert the greatest influence on overall system behaviour.
3.4 Integrated interpretation of critical parameters
The preceding analyses examined parameter importance for individual engineering response variables. However, practical regional energy planning requires simultaneous consideration of multiple performance objectives, including economic efficiency, environmental impact, renewable energy integration, system adequacy, and electricity supply reliability. This necessitates an integrated comparison of sensitivity rankings across all model outputs is essential for identifying parameters that consistently influence overall system performance. Figure 5 summarizes the five most influential uncertain input parameters for each engineering response variable based on the normalized Morris sensitivity index (μ*), thereby providing a comprehensive overview of uncertainty propagation throughout the regional energy system.
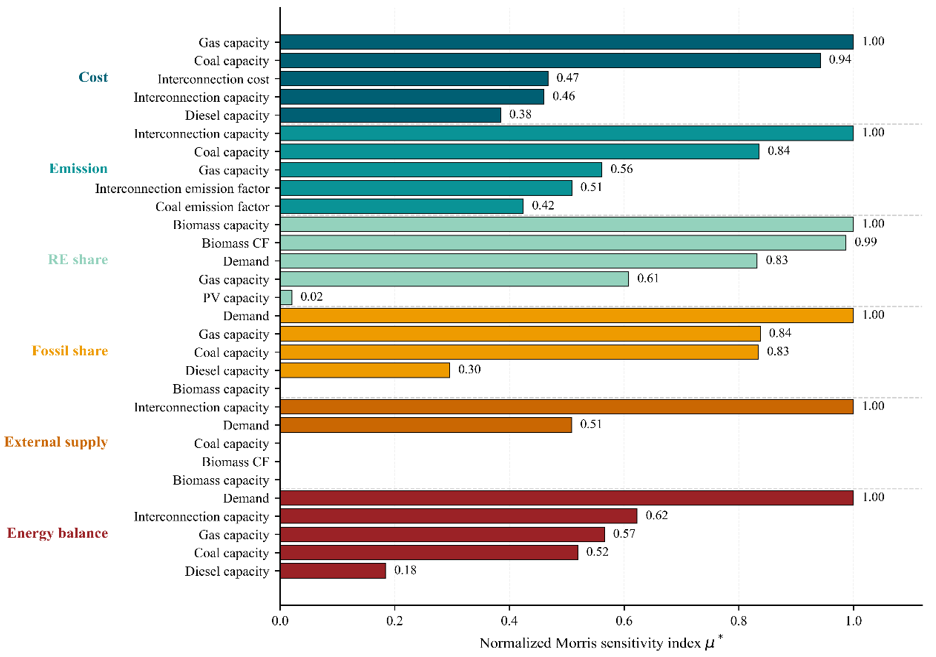
Figure 5 reveals that the dominant uncertain parameters differ considerably among engineering performance indicators, although several common patterns emerge. For annual system cost, gas generation capacity is identified as the most influential parameter with a normalized sensitivity of 1.00, followed by coal generation capacity (0.94), interconnection variable cost (0.47), interconnection capacity (0.46), and diesel generation capacity (0.38). This ranking indicates that economic performance is governed primarily by dispatchable generation resources, while transmission-related parameters contribute to a lesser extent. Because gas and coal generation constitute the principal dispatchable technologies within the baseline system, uncertainties associated with their available capacities directly affect generation scheduling and operating expenditure.
Figure 5. Comparative Morris sensitivity ranking across multiple engineering performance indicators
The sensitivity pattern differs for environmental and renewable energy indicators. Carbon emissions are primarily influenced by interconnection capacity, which reaches the maximum normalized sensitivity (1.00), followed by coal generation capacity (0.84), gas generation capacity (0.56), interconnection emission factor (0.51), and coal emission factor (0.42). These results indicate that uncertainties associated with electricity imports influence overall emissions more strongly than uncertainties in several generation technologies. In contrast, renewable energy share is dominated almost entirely by biomass-related parameters. Biomass generation capacity exhibits the highest normalized sensitivity (1.00), while biomass capacity factor reaches 0.99, demonstrating that both installed biomass capacity and resource availability contribute almost equally to renewable energy penetration. Demand (0.83) and gas generation capacity (0.61) exert secondary influence, whereas the sensitivity of solar PV capacity remains very small (0.02) under the present planning assumptions.
Different engineering characteristics are also observed for fossil generation share, external electricity supply, and energy balance. Fossil generation share is governed primarily by demand (1.00), followed by gas generation capacity (0.84) and coal generation capacity (0.83), indicating that electricity consumption remains the principal driver determining fossil fuel utilization. External electricity supply is almost entirely controlled by interconnection capacity, which attains the maximum normalized sensitivity (1.00), while demand contributes a moderate influence (0.51); the remaining parameters exhibit negligible sensitivity. Similarly, energy balance is dominated by demand (1.00), followed by interconnection capacity (0.62), gas generation capacity (0.57), and coal generation capacity (0.52). These results demonstrate that maintaining system adequacy depends primarily on accurate characterization of electricity demand together with the available dispatchable generation and transmission capability.
Overall, Figure 5 demonstrates that no single uncertain parameter dominates every engineering response variable. Instead, different performance indicators are governed by different combinations of uncertain inputs that reflect their underlying physical and operational characteristics. Nevertheless, several parameters, particularly gas generation capacity, coal generation capacity, interconnection capacity, and electricity demand, repeatedly appear among the most influential variables across multiple outputs. Their recurring dominance indicates that these parameters constitute the principal sources of uncertainty within the regional energy system model and therefore deserve priority in future measurement campaigns, parameter calibration, and data collection efforts.
From an engineering measurement perspective, the obtained sensitivity rankings provide a systematic basis for planning future measurement campaigns. Parameters exhibiting consistently high sensitivity should be prioritized for more accurate measurement, sensor deployment, calibration, and data acquisition because reducing uncertainty in these variables is expected to improve the reliability of multiple engineering response variables simultaneously. Conversely, parameters with consistently low sensitivity may require less intensive measurement effort, enabling more efficient allocation of measurement resources without substantially affecting model performance. This enables the proposed approach to support not only uncertainty quantification and parameter prioritization but also measurement-informed engineering planning by guiding where limited measurement resources can be deployed most effectively to reduce predictive uncertainty.
This study presented a systematic engineering approach for uncertainty-oriented sensitivity assessment using the Morris GSA method. The proposed approach combines uncertainty characterization, deterministic energy system modelling, and comparative multi-response sensitivity evaluation to quantify the influence of uncertain engineering input parameters on regional energy system performance. Unlike conventional sensitivity studies that evaluate individual performance indicators independently, the proposed methodology simultaneously assesses parameter influence across six engineering response variables, providing a more comprehensive understanding of how input uncertainty affects multiple engineering performance objectives through a unified analytical workflow.
The results demonstrate that parameter importance varies substantially across engineering response variables, confirming that no single performance indicator adequately represents overall system behaviour. Comparative sensitivity evaluation identifies gas generation capacity as the most influential parameter across all engineering responses, with a mean normalized sensitivity of 0.596, followed by electricity demand (0.557), coal generation capacity (0.522), and interconnection capacity (0.514). These findings demonstrate that economic, environmental, and operational objectives are governed by different subsets of uncertain parameters, highlighting the value of comparative multi-response sensitivity assessment over conventional single-response analyses.
From an engineering perspective, the proposed approach provides a practical basis for prioritizing measurement efforts, improving parameter estimation, reducing predictive uncertainty, and supporting sensitivity-informed engineering decision-making. The resulting sensitivity rankings can assist engineers and planners in allocating data collection and model calibration efforts toward the parameters that most strongly influence regional energy system performance while avoiding unnecessary effort on less influential variables. In this way, the proposed approach contributes not only to uncertainty quantification but also to improving model transparency, engineering interpretation, and evidence-based regional energy planning.
The proposed methodology is potentially transferable to other engineering systems involving complex computational models and multiple uncertain input parameters. It should be emphasized that the Morris GSA method is primarily intended as a global screening technique for identifying the relative importance of uncertain input parameters rather than for quantifying their individual contributions to output variance. Accordingly, the reported sensitivity rankings should be interpreted as relative measures for parameter prioritization within the predefined uncertainty ranges rather than as variance decomposition metrics. Furthermore, because the reported Morris sensitivity indices are estimated from a finite number of randomly generated sampling trajectories, they are inherently subject to sampling variability. Confidence intervals or standard errors of the estimated μ* values were not evaluated in the present study; therefore, the reported rankings should be interpreted as screening-based estimates of relative parameter importance rather than statistically precise sensitivity estimates. Because the present study focuses on parameter screening using bounded uncertainty intervals within the Morris GSA framework rather than probabilistic uncertainty propagation, future research may extend the proposed approach by incorporating correlated input uncertainties, probabilistic uncertainty representations, time-varying uncertainty models, Bayesian parameter updating, bootstrap-based uncertainty estimation for Morris indices, or variance-based global sensitivity methods, such as Sobol analysis. These extensions would enable complementary uncertainty propagation analysis while further strengthening uncertainty quantification, model reliability, and engineering decision support.
The authors gratefully acknowledge the financial support provided by Universitas Bangka Belitung through its 2026 publication support program under Assignment Letter No. 391/UN50/G.3/LL/2026, in support of the University's Key Performance Indicators (KPIs).
[1] Russo, G., Pompei, L., Giuzio, G.F., et al. (2025). Modelling the complexity of interconnected energy systems at different urban scales: A critical review. Renewable and Sustainable Energy Reviews, 223: 116007. https://doi.org/10.1016/j.rser.2025.116007
[2] Putrama, I.M., Martinek, P. (2024). Heterogeneous data integration: Challenges and opportunities. Data in Brief, 56: 110853. https://doi.org/10.1016/j.dib.2024.110853
[3] Kahagalage, S.D., Turan, H.H., Elsawah, S., Gary, M.S. (2024). Exploratory modelling and analysis to support decision-making under deep uncertainty: A case study from defence resource planning and asset management. Technological Forecasting and Social Change, 200: 123150. https://doi.org/10.1016/j.techfore.2023.123150
[4] Dhungana, A., Doyle, E.E., Prasanna, R., McDonald, G. (2025). From scientific models to decisions: Exploring uncertainty communication gaps between scientists and decision-makers. Environment Systems and Decisions, 45(3): 44. https://doi.org/10.1007/s10669-025-10039-w
[5] Azarhoosh, Z., Ghazaan, M.I. (2025). A review of recent advances in surrogate models for uncertainty quantification of high-dimensional engineering applications. Computer Methods in Applied Mechanics and Engineering, 433: 117508. https://doi.org/10.1016/j.cma.2024.117508
[6] Saltelli, A., Aleksankina, K., Becker, W., et al. (2019). Why so many published sensitivity analyses are false: A systematic review of sensitivity analysis practices. Environmental Modelling and Software, 114: 29-39. https://doi.org/10.1016/j.envsoft.2019.01.012
[7] Więckowski, J., Sałabun, W. (2023). Sensitivity analysis approaches in multi-criteria decision analysis: A systematic review. Applied Soft Computing, 148: 110915. https://doi.org/10.1016/j.asoc.2023.110915
[8] Haddouch, M., Hajjout, I., Boudi, E.M. (2025). An integrated approach to uncertainty and global sensitivity analysis in penstock structural modeling. Heliyon, 11(1): e41049. https://doi.org/10.1016/j.heliyon.2024.e41049
[9] Istiqomah, A., Fauzi, A., Mulatsih, S., Wijayanti, P., Nuva. (2026). Measuring regional resilience to disasters using a composite index: A case study of West Java Province. Challenges in Sustainability, 14(2): 360-379. https://doi.org/10.56578/cis140209
[10] Razavi, S., Jakeman, A., Saltelli, A., et al. (2021). The future of sensitivity analysis: An essential discipline for systems modeling and policy support. Environmental Modelling & Software, 137: 104954. https://doi.org/10.1016/j.envsoft.2020.104954
[11] Ginocchi, M., Ponci, F., Monti, A. (2021). Sensitivity analysis and power systems: Can we bridge the gap? A review and a guide to getting started. Energies, 14(24): 8274. https://doi.org/10.3390/en14248274
[12] Qin, C., Jin, Y., Tian, M., Ju, P., Zhou, S. (2023). Comparative study of global sensitivity analysis and local sensitivity analysis in power system parameter identification. Energies, 16(16): 5915. https://doi.org/10.3390/en16165915
[13] Wu, L., Yu, C., Shi, F., Ni, X. (2025). Local and global sensitivity analysis of key durability parameters of concrete under chloride environment. Results in Engineering, 26: 105385. https://doi.org/10.1016/j.rineng.2025.105385
[14] Newman, K.B., Naha, S., Jackson-Blake, L.A., Topp, C., Glendell, M., Butler, A. (2026). Global sensitivity analysis workflows and rankings: A practical comparison for researchers. Environmental Modelling & Software, 200: 106956. https://doi.org/10.1016/j.envsoft.2026.106956
[15] Todorov, V., Zhivkov, P. (2025). Efficient evaluation of Sobol’ sensitivity indices via polynomial lattice rules and modified Sobol’ sequences. Mathematics, 13(21): 3402. https://doi.org/10.3390/math13213402
[16] Asghari, H., Miller, L., Penta, R., Melnikov, A., Spitas, C., Merodio, J. (2025). The Sobol sensitivity analysis of the pressure, stresses, and displacement arising from poroelastic modelling of hard mechanical systems. Scientific Reports, 15(1): 44378. https://doi.org/10.1038/s41598-025-28109-z
[17] Raj, R., Tismer, A., Gaisser, L., Riedelbauch, S. (2024). A deep learning approach to calculate elementary effects of morris sensitivity analysis. Proceedings in Applied Mathematics and Mechanics, 24(4): e202400104. https://doi.org/10.1002/pamm.202400104
[18] Paleari, L., Movedi, E., Zoli, M., et al. (2021). Sensitivity analysis using Morris: Just screening or an effective ranking method? Ecological Modelling, 455: 109648. https://doi.org/10.1016/j.ecolmodel.2021.109648
[19] Cheng, K., Lu, Z., Zhang, K. (2019). Multivariate output global sensitivity analysis using multi-output support vector regression. Structural and Multidisciplinary Optimization, 59(6): 2177-2187. https://doi.org/10.1007/s00158-018-2184-z
[20] Torii, A.J., Begnini, R., Kroetz, H.M., Matar, O.M.I., Lopez, R.H., Miguel, L.F.F. (2023). Global sensitivity analysis for mathematical models comparison. Computational and Applied Mathematics, 42(8): 345. https://doi.org/10.1007/s40314-023-02484-7
[21] Wu, S., Yan, M., Zhang, L., Feng, L., Yang, N., Liu, H. (2025). Multi-objective global sensitivity analysis of shipborne equipment based on AGPSO-CNN-BiLSTM-attention. Scientific Reports, 15(1): 41085. https://doi.org/10.1038/s41598-025-24905-9
[22] Wang, C., Harrison, M.T., Brown, H., et al. (2025). Global sensitivity analyses prior to parameter calibration significantly improves prediction quality. Computers and Electronics in Agriculture, 238: 110750. https://doi.org/10.1016/j.compag.2025.110750
[23] Liu, D., Li, L., Rostami-Hodjegan, A., Bois, F.Y., Jamei, M. (2020). Considerations and caveats when applying global sensitivity analysis methods to physiologically based pharmacokinetic models. The AAPS Journal, 22(5): 93. https://doi.org/10.1208/s12248-020-00480-x
[24] Wang, A., Solomatine, D.P. (2019). Practical experience of sensitivity analysis: Comparing six methods, on three hydrological models, with three performance criteria. Water, 11(5): 1062. https://doi.org/10.3390/w11051062
[25] Feijoo, F., Prina, M.G., Mimica, M., Duić, N. (2024). Multi-scale energy planning for the global transition: Local, regional, and global insights. e-Prime-Advances in Electrical Engineering, Electronics and Energy, 10: 100841. https://doi.org/10.1016/j.prime.2024.100841
[26] Yazdanie, M., Dramani, J.B., Orehounig, K. (2025). Strengthening energy system resilience planning under uncertainty by minimizing regret. Renewable and Sustainable Energy Transition, 6: 100093. https://doi.org/10.1016/j.rset.2024.100093
[27] Zhang, K., Chen, N., Zeng, P., Liu, J., Beer, M. (2022). An efficient reliability analysis method for structures with hybrid time-dependent uncertainty. Reliability Engineering & System Safety, 228: 108794. https://doi.org/10.1016/j.ress.2022.108794
[28] Beaulac, A., Lalonde, T., Haillot, D., Monfet, D. (2024). Energy modeling, calibration, and validation of a small-scale greenhouse using TRNSYS. Applied Thermal Engineering, 248: 123195. https://doi.org/10.1016/j.applthermaleng.2024.123195
[29] Pemerintah Provinsi Kepulauan Bangka Belitung. (2019). Regional regulation (Perda) of Bangka Belitung Province number 13 of 2019 concerning the General Plan for Regional Energy 2019-2050 (in Indonesian). https://peraturan.bpk.go.id/Details/139887/perda-prov-bangka-belitung-no-13-tahun-2019.
[30] Danish Energy Agency. (2024). Technology data for the Indonesian power sector: Catalogue for generation and storage of electricity. Jakarta, Indonesia. https://www.ea-energianalyse.dk/wp-content/uploads/2025/05/technology-data-for-the-indonesian-power-sector-2024.pdf.
[31] Intergovernmental Panel on Climate Change (IPCC). (2023). Emission factor database: Carbon dioxide emission factors. https://archive.ourworldindata.org/20250624-125417/grapher/carbon-dioxide-emissions-factor.html.
[32] Fortela, D.L.B., Mikolajczyk, A.P., Hernandez, R., et al. (2024). Dynamic time warping as elementary effects metric for Morris-based global sensitivity analysis of high-dimension dynamical models. Mathematical and Computational Applications, 29(6): 111. https://doi.org/10.3390/mca29060111
[33] Akbari, E., Darvishi Boloorani, A., Verrelst, J., et al. (2024). How global sensitive is the AquaCrop model to input parameters? A case study of silage maize yield on a regional scale. Frontiers in Agronomy, 6: 1304611. https://doi.org/10.3389/fagro.2024.1304611
[34] Franczyk, A. (2019). Using the Morris sensitivity analysis method to assess the importance of input variables on time-reversal imaging of seismic sources. Acta Geophysica, 67(6): 1525-1533. https://doi.org/10.1007/s11600-019-00356-5
[35] Sunanda, W., Setyonegoro, M.I.B., Hadi, S.P., Sarjiya. (2025). Optimizing power sector decarbonization in Indonesia through an integrated policy modeling framework. Green Technologies and Sustainability, 4(2): 100276. https://doi.org/10.1016/j.grets.2025.100276
[36] Liu, S.F., Wang, C., Fu, H.B., Yang, S.M., Yu, L.J. (2026). Sensitivity analysis of the effects of building morphology on indoor–outdoor wind–light–thermal coupling processes. International Journal of Heat and Technology, 44(2): 777-792. https://doi.org/10.18280/ijht.440228