Majd A. Al Bayaty![]()
© 2024 The author. This article is published by IIETA and is licensed under the CC BY 4.0 license (http://creativecommons.org/licenses/by/4.0/).
OPEN ACCESS
Since the last century, Iraq has suffered from a shortage of water needed for irrigation and other essential uses for human existence. This water scarcity has affected the Tigris-Euphrates River basin, resulting in unusual variations in public activities in watershed areas due to rapid population growth and urban expansion. Therefore, the aim of this study is to evaluate and detect changes in Land Use/Land Cover (LULC) in the main regions of the Euphrates basin in central Iraq over a time scale from 1985 to 2022, focusing on the availability of built-up lands, vegetation, barren areas, and their relationship with water bodies. The changes in LULC have been studied based on a database and satellite data, indicating high-resolution geo-registered images supported by interpretation keys to detect the changes that have occurred over time. The detection process has been accomplished using Remote Sensing and ArcGIS V.9.3 software. Landsat TM and ETM+ satellite images from 1985, 1999, and 2022 were used to monitor Land Use classes to identify the drivers of this change. The results have shown that high-resolution satellite images, Remote Sensing, and GIS techniques are powerful analytical tools for conducting LULC change detection analysis. They classify the geographical location and type of changes, quantify the changes, and evaluate the accuracy of change detection. The information on LULC change detection will be helpful to experts and urban planners for improving future plans for the sustainable development of regional lands and cities, as it is one of the main forces driving global environmental change and sustainable improvement.
Land Use/Land Cover (LULC), Geographic Information System (GIS), Euphrates basin, change detection, Remote Sensing, Iraq
In recent years, the arid and semi-arid areas of the world have suffered from severe problems due to significant environmental degradation caused by conflicts and wars, human activities, and climate change [1]. Land Use and Land Cover (LULC) change is recognized as one of the fundamental procedures for managing natural resources and monitoring environmental changes [2, 3]. The term LULC refers to two different terminologies [4]. Land Cover can be defined as the physical features that cover an area, which include snow, water, grassland, deciduous forest, barren land, and other related features generated through anthropogenic activities [5]. Land Cover information is essential for agricultural crop production and watershed management [6]. Land Use refers to any regions used by humans for habitats or economic activities [7, 8]. Globally, the term Land Use describes how humans utilize land for socio-economic activities at any place and time, which may include examples such as agricultural lands, urban areas, management areas, and recreation areas [9].
In Iraq, there are direct and indirect effects on regional lands. Urban expansion has resulted in significant losses of agricultural lands and water bodies, which are associated with population growth and economic activity. The regions in the Euphrates River basin represent a good example of change detection in Land Use and Land Cover (LULC). Urban growth and human activities are primarily responsible for a variety of environmental issues, such as increased runoff and subsequent flooding, changing temperatures, decreased air quality, reduced groundwater, and water quality deterioration [10]. In most cases, this change is linked to climate change and global warming, which have essential impacts on the hydrological cycle and water supply [11, 12]. The management of river basins is necessary because it plays an important role from a socio-ecological perspective, and the exploration of LULC change is essential for planning, monitoring, and managing water resources. Overall, LULC change will continuously produce negative impacts on the interaction between hydrological components [13, 14]. Hence, the change in spatial and temporal aspects occurring in regions of the river basin over time will allow for better water management strategies to be formulated [10, 15]. Regardless, LULC change detection studies are fundamental in Iraq but tend to be limited and attribute the alterations to only one main factor: the population growth pattern and size, which have directly and indirectly contributed to LULC change [10, 16]. In recent years, several change detection techniques have been commonly applied, with ongoing debate about the advantages and disadvantages of each technique [11, 17, 18]. The techniques of Remote Sensing and Geographic Information System (GIS) have been used to map and recognize LULC alterations across a broad range with various data sets due to their high temporal frequency, digital format suitable for computation, synoptic view, and large-scale selection of spatial and spectral resolutions [19, 20]. Thus, this research is conducted to evaluate LULC change detection by using Landsat images and GIS in a part of the Euphrates River basin due to uncontrolled urban expansion, damage to infrastructure during the subsequent wars, poor maintenance worsened by economic sanctions, unmanageable river sewage discharge, changes in the river regime, active sediment deposition, and a shortage of vegetation cover. Additionally, the soil and plants have declined due to unsustainable practices [21, 22]. Recent studies have shown that 50% of Iraqi lands face serious issues due to degradation from climate change and global warming [22]. However, the aim of this research is to evaluate the changes in Land Use and Land Cover patterns for three of the most important districts in the Euphrates River basin from 1985 to 2022 in order to detect the changes that have taken place over the years. The general objectives of change detection include using Landsat data and GIS techniques to classify the types of changes, geographical locations, quantify the changes, and evaluate the change detection results.
2.1 Study area
The study region is selected around two sides of the Euphrates River, starting from the northern part of the Al Hindiyah Barrage to the Al Kifil mouth. This research focuses on the changes in LULC for three main sub-basins: two are located on the left side of the river (e.g., Al Mussiyab and Al Hillah Districts) within the Babylon governorate boundary, and one is on the right side (e.g., Al Hindiyah) within the Karbala governorate, as shown in Figure 1. The specific images of the three districts were downloaded from the USGS website: http://earthexplorer.usgs.gov/.
The Al Mussiyab District is located within longitude coordinates between 44°2'43" - 44°29'32"E, and latitude coordinates between 32°31'50" - 33°7'36"N. This district covers an area of 1,008 km2, which accounts for 19.80% of the total area of the Babylon Governorate, with a population of 42,901 habitants [23].
In recent years, this district has witnessed some development in Land Use and Land Cover, particularly in urban projects and water networks, alongside the emergence of several villages. On the other hand, the operations of the Al Hindiyah Barrage have affected the district by supporting irrigation lands during the dry season and increasing Haurs and flooded soils.
The Al Hillah District, another sub-basin area selected for study, covers an area of 908 km2, constituting 17.1% of the total area of Babylon Governorate. It is classified as the financial, political, and administrative capital of the Babylon Governorate. It is located between latitude 32°36'1"N - 32°8'45"N and longitude 44°14'9"E - 44°33'39"E, as represented in Figure 1. This district has the highest population density, with 289,709 habitants [24]. The third sub -basin at the right-side of Euphrates River is Al Hindiyah, it covers an area of 696 km2 and Euphrates River extended from North to South of this district. It is situated geographically on latitude 32°47′15″- 32°17′31″N and longitude 44°05′52″- 44°17′47″E, and covers an area of 696 km2 and the population with about 57,490 habitants, which accounted 26% of the governorate's population The Euphrates River has essential action as water source for public facilities and water supply services for all sub -basins residents due to rapid urban development and population growth [25].
Figure 1. Map of Iraq and studied districts
2.2 Data collection
In this study, four categories of LULC have identified studied (e.g, vegetation lands, urban area, barren area and water bodies) by using a geographic information system Table 1. Some reasons are led to change LULC in studied districts such as; rapid growth of population and developing standards of living connected with increasing levels of and industrial and commercial activities in urban areas, besides some categories are classified as a second level including topographical lands, hydrological, infrastructure, and social-cultural criteria [20, 26].
In order to perform the research study, the data are collected from different sources; historical data were collected from Iraq Geological Survey (GEOSURV) and Iraqi Ministry of Planning [25] and others from relevant authorities. The data are included topographic sheets and sub basins maps. In addition, several surveying companies for field investigation were carried out in 2022 to cover study area. Otherwise, to conduct the information for Land Cover and Land Use, there are two primary methods such as field survey and analysis of Remotely Sensing imagery. The acquired maps are careful examined methodically to identify the change detection in LULC. The satellite images for districts are downloaded from the USGS Earth Explorer composite bands for analysis to achieve required details [27]. Processing images and explanation for LULC improvement of maps is conducted in ERDAS Imagine of software 2013 which are processing systematically.
Table 1. The basis of supervised classification classes
|
ID |
Description |
Type of Lands Description |
|
1 |
Vegetation |
Consisting all agricultural area and low plants (<2 m) with multiple stems and green lands covered with temporary crops grown with rainfall |
|
2 |
Water body |
Consisting of all water bodies (e.g., stream, rivers, lakes, canals, and reservoirs) |
|
3 |
Barren areas |
Consisting areas with modicum or no vegetation cover including of exposed soil /rock and desert areas with sand dune |
|
4 |
Built-up areas |
Consisting all commercial, residential, transportation and industrial, area |
3.1 Statistical analysis
The organizing extracted values are input into Microsoft Office Excel software for principal component analysis (PCA). Generally, PCA can be expressed through original data reduced to the dominant components of factors (sources of variation) that influenced the observed data variance. The reference data are provided by analyzing random sample points using field surveys and archived data combined with satellite images.
3.2 Image preprocessing
The focus of this study is on both the spatial distribution and dynamics of LULC categories. The satellite images are established through a direct connection between the provided data and physical phenomena [16]. The analysis is required for image processing and image classification. In processing, firstly, the images are pre-processed in several steps, including image registration, calibration, and radiometric normalization. The view scenes are adjusted geometrically and then calibrated. The ground-truth data were adjusted regarding every classifier generated by its spectral signatures to produce a set of classification maps. These data were downloaded from the Landsat archive available on a free website: [http://earthexplorer.usgs.gov/] and [https://landcover.usgs.gov/landcoverdata.php] and [http;//edcsns17.crusgs.gov/glcc/glcc.html]. The images were processed using GIS V. 9.2 and ArcGIS V. 9.3 software programs for the development of LULC maps. Landsat TM and ETM+ satellite images from 1985, 1999, and 2022 were used for monitoring Land Use classes, handling digital images, geo-referencing, and sub setting the images for the area of study. The ERDAS Imagine software was implemented for image testing and analysis to provide a necessary flexible environment for change detection. The image processing included combining single-band images into six-band images, as well as generating and arranging data as layers for classification and detecting changes among different groups of classes. The ERDAS 2013 software was also implemented for image testing and analysis to provide a necessary flexible environment for change detection.
3.3 Image classification
Regarding classifications, there are two types: “Unsupervised” and “Supervised” methods. In “Unsupervised” classification, the ERDAS software depends on a clustering algorithm that classifies according to the required number of classes of digital data and the number of pixels available. In contrast, “Supervised” classification uses samples of unknown identification. The images are classified based on the signature sets provided by the user, which are based on field knowledge and image resolution. In this study, the selected procedure is “Supervised classification” for identification and sorting out strange and unknown samples. Real data and demand classes are prerequisites for the classification process and must be acquired from ground truths, maps, or photos to create a map of the samples. The collection of training data consists of gathering samples within an empty layer created in the previous step. This empty layer must be imported into ERDAS, and then the actual images should be loaded into various viewers of ERDAS, subsequently connecting both viewers with each other [4]. The identification is provided by the user and leads to classifying which classes of pixels should be chosen for special kinds of Land Cover. In the first stage, the training area was identified and developed for each Land Cover type of interest using a numerical description of each spectral attribute. In the second classification stage, the image data set is categorized into the Land Cover class for each pixel box. A pixel is usually labeled "unknown" if it is not similar to any training data set. The category label assigned to each pixel in this process is recorded in the corresponding cell of an interpreted data set. After then, several trials are conducted in supervised classification, the data set has been categorized, and the results are presented in the final output stage; these results may also be used in different ways [28]. The studied areas are tested for maximum supervised classification based on delineated classes: vegetation areas, built-up areas, water bodies, and barren areas as indicated in Table 1. For change detection analysis and comparison, two independently classified images are used to produce change information on a pixel basis. For analysis, the Landsat 8 images for 2022 indicate spatial treatment by using the panchromatic bands, resulting in images with a 15 m resolution. Meanwhile, the Landsat 5 images for 1985 and 1999 are at their original 30 m resolution. High-resolution image processing analysis is executed using ENVI 5, which includes two independently classified images to create comparisons that produce change information on a pixel basis for processing LULC change detection. The images are demonstrated in natural color using band combinations of 3, 2, and 1 for Landsat 5 and 4, 3, and 2 for Landsat 8. The studied areas are tested for maximum supervised classification based on delineated classes: vegetation areas, built-up areas, water bodies, and barren areas. The explanation between images provides changes in information from the classified images of two different datasets, which are compared using cross-tabulation to determine changes for the periods from 1985 to 1999 and from 1999 to 2022.
3.4 LULC change detection analysis
The detection is a system for classifying and quantifying the variation between images of the same scenes at different times by using a comparison between images taken on various dates to estimate the variation in Land Covers. The detection of LULC change is significant for recognizing the variations that occur in different classes, such as growth in built-up areas, reduction in vegetated lands, or changes in water bodies, and so on. Understanding the impact of human activities on the environment and natural resources is essential for managing land. Human activities have seriously affected the Euphrates basin areas during the past three decades. The riparian area of the Euphrates River is a suitable environment for farming and domestic use. Agricultural areas depend on the productivity of land as one of the most important natural resources, and any deviations from this may result in unrecorded Land Use change. Monitoring the surface from space provides more specific information about human actions and landscape changes. All the information for classifying images is prepared to explain LULC change detection using GIS And Remote Sensing techniques.
4.1 Magnitude and percentage of LULC changes between 1985-1999 and 1999-2022
The statistical analysis is important for identifying the alterations occurring in Land Use, such as the decrease in agricultural lands and the expansion of built-up areas over time. This depends on the results of classification and calculations of the urban growth rate. The reference data are supplied using archived databases from Iraqi authorities and field knowledge, along with the analysis of sample points. The magnitude and percentage of LULC change in different land categories during the periods from 1985 to 1999 and from 1999 to 2022 in the study sub-basins are presented in Tables 2-7. The results indicate that the pattern of LULC has changed significantly due to economic development and critical changes in vegetation. It is clearly shown that Land Cover is affected by human activities and climate change. A brief account of these results is discussed in the following paragraphs.
Before the 1980s, the water flowing into the Euphrates River was excessive due to good seasonal rains, fertile agricultural lands, and low population growth, which was concentrated only in city centers without expansion. However, after this period, marked by a duration of heavy rain, it became evident that water bodies were extending at the expense of agricultural lands. By 2001, some of those bodies had turned into barren lands, alongside a considerable population growth.
In 2006, there was a reduction in farming areas due to the circumstances in Iraq during that period, in addition to the development of urban areas at the expense of agricultural lands. This expansion included the peripheries of cities and their environs, as well as the areas that had been reclaimed for agriculture.
In recent years, the Euphrates River has experienced radical reductions in water flow because Turkey and Syria have constructed many dams, causing a sharp decrease in downstream flow. The quantity of water entering Iraq fell by 25%, which affected water bodies and most agricultural productivity [29, 30]. Additionally, most water resources in Iraq have suffered from serious mismanagement, particularly the Euphrates River, which has caused significant changes in the river system, such as the development of more islands and sandbars, consequently reducing the river's capacity [31]. Over the last few decades, areas in Iraq have experienced hydrological drought events as a result of global climate change [32]. The most notable natural hazards in Iraq, in addition to the arid climate, are extreme temperatures, low humidity, little precipitation, and strong sand-dust winds. While global climatic changes are the most dangerous natural factor, evaporation also has an impact as a climatological factor, which is strongly related to temperature, strong winds, Land Use, and other water resources. Another factor is the large population growth in Iraq, estimated at 24%, and this rapid increase will put great pressure on the land and available water resources.
In more details for change of LULC classes in Al Hillah District, the magnitude of agricultural lands and water bodies into built-up area and open space during period from 1985 to 2022 are represented in Tables 2 and 3.
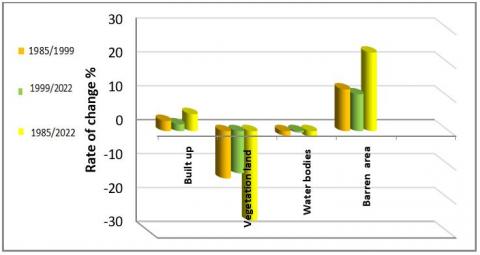
Generally, the variation in environmental, demographic, political, and social conditions have a direct impact on LULC. The district is due to demand and ongoing water management program. The agriculture areas are rapidly dropped from about 62.03% to 35.63% where a wide parts of agriculture areas were cleared to develop infrastructure facilities and expanded in towns and villages. Broader in barren areas because the drought and climate change. The contrast of areas and rate of change to the LULC categories are presented in Tables 2 and 3 and Figure 2.
In 1985, the district was dominated by vegetation land of 563.24 km2 (62.03%) followed by unused lands 162.78 km2 (17.92%) and urban area 113.53 km2 (12.5%). While, in 1999, only built-up area and barren area have increased, by about 113.53 km2 (12.51%), and 162.78 km2 (17.92%) to become the total 140.74 km2 (15.51%) and 274.52 km2 (32.23%) respectively. Otherwise, agriculture lands and water space are minimized by about 12.43% and 0.44% respectively, which resulted in the total area of 436.40 km2 and 56.34 km2 respectively. In other hand, built-up areas have continuously increased by about 5.02% to provide a total area of 158.94 km2 (e.g., official, commercial, educational, cultural, sport, and so on). A barren area also increases 23.17%. The basin was demonstrated barren area of 373.16 km2 (41.09%) followed by vegetation land of 323.56 km2 (35.6%), and built up of 158.94 km2 (17.52%). Nevertheless, water coverage continues to decrease by 1.77%, resulted in total area of 52.34 km2 (5.76%).
Generally, the studied districts have been affected by different wars (Iraq -Iran war from 1980 to 1988, and both first and second Gulf Wars in 1991 and 2003). Anthropogenic factors may have a role in land change in this area.
Meanwhile, the effect of drought on behavior of water bodies by a drop in percentage of change from 7.53% to 5.76%. The detect of LULC after 37 years verify river contributions from sub-basins and Figure 2 is illustrated LULC classification to the reference time for data of catchment area. The area of study is affected by global warming, the highest records of rainfall were found in 1991 which of 154.2 mm. After this period the rains was declined frequently until years of 2001 and 2002 which reached only 109.5 mm; however, this record is still lower from the record of the year 1992. According to Mason [33], the mean annual rainfall in Euphrates basin until recent period is 94.4 mm.
Table 2. The change detection in LULC of Al Hilla District
|
Area and Percentage Change |
||||||
|
Land Use Categories |
Area, km2 |
% |
Area, km2 |
% |
Area, km2 |
% |
|
1985 |
1999 |
2022 |
||||
|
Built up area |
113.53 |
12.50 |
140.74 |
15.51 |
158.94 |
17.52 |
|
Vegetation land |
563.24 |
62.03 |
436.40 |
48.06 |
323.56 |
35.63 |
|
Water bodies area |
68.45 |
7.53 |
56.34 |
6.20 |
52.34 |
5.76 |
|
Barren area |
162.78 |
17.92 |
274.52 |
32.23 |
373.16 |
41.09 |
|
Total |
908 |
100 |
908 |
100 |
908 |
100 |
Table 3. The rate of change for LULC categories in 1985, 1990 and 2022 within Al Hillah District
|
Land Use Categories |
Rate of Change in Area km2/year (1985-2022) |
Rate of Change % (1985-1999) |
Rate of Change % (1999-2022) |
Rate of Change % (1985-2022) |
|
Built up area |
+1.51 |
+3.010 |
+2.010 |
+5.020 |
|
Vegetation land |
-7.980 |
-13.970 |
-12.43 |
-26.40 |
|
Water bodies area |
-0.537 |
-1.330 |
-0.440 |
-1.770 |
|
Barren area |
+7.012 |
+12.310 |
+10.86 |
+23.17 |
Figure 2. The percentage and magnitude of change in LULC categories within Al Hillah District
In another case, the Land Use categories to Al Mussiyab District is indicated in Tables 4 and 5. The Land Use was dominated by the agricultural areas in Al Mussiyab District have decreased from 662.24 km2 (65.71%) in 1985 to end up total area of 573.43 km2 (56.88%) in 2022.
On the other hand, only built-up and barren area are growing with about 35.56 km2 (3.52%) and 281.75 km2 (27.95%) to become of total 73.23 km2 (7.32%) and 335.76 km2 (33.32%) respectively in 2022. The Landsat image of 2022 was used in addition to the Tables 4 and 5 to detect Land Use change in Al Mussiyab area where some agriculture projects are implemented such as a large ‘Al Mussiyab project’. The change of LULC is extended to recent year further to that some parts of the change in Al Mussiyab urban area which includes variation in the residential, commercial and industrial areas as represented in Figure 3. The magnitude and total percentage of change in built up and barren areas were about 0.19% and 2.1% in 1985 and rise in 2022 for 3.80% and 5.35% respectively. The barren area is showed a growth rate in total area 1.83 km2/year. However, declining in vegetation lands was occurred by a rate 3.57 km2/year (8.83%). In 1985, water bodies were 0.31% and increased in 1999 to 5.73%, but it reduced to the 0.28% to 2022. The period post- 1999 indicating a vast reduction in water quantity and utmost shift in the Euphrates River flow system. This clearly shows the impact of global warming on water scarcity, the climate data have recorded a decrease in the amount of rain and an increase in temperature for the same period, and it has noted that the temperature increased and the amount of rainfall also decreased in the same period which reached its peak in in two years 2007 and 2008.
Lastly, the detection changes in LULC in Al Hindiyah District during past three decades are shown in Tables 6 and 7. The principle frequent variation was transformed the barren lands to the built-up area. The built-up regions equal 102.34 km2 (14.7%) in 1985 and 129.63 km2 (18.62%) in 1999. Then, with over 23-year, a wide growth in social, economic, and political processes has effect as important factor to increase total areas of built up of 184.40 km2 (19.31%) during time scale from 1999 to the 2022. The details in Table 7 demonstrated the LULC change in levels of specified Land Use in Al Hindiyah District between 1985 and 2022. The data in the table is shown that urban lands growth by 11 times as much 1985. The trend in barren lands with about 91.65 km2. The analysis demonstrates that urban regions are 184.40 km2.
This table demonstrates clutter and abnormality in construction sites and incretion in population density within district during past three decades. In addition, a major change has occurred in vegetation lands and orchards regions as results of lack in supervision and official’s demerit. It can be seen that agriculture lands have increased from 445.34 km2(63.98%) to 478.64 km2 (68.77%) from 1985 to 1999, while decreased drastically to the total area of 383.89 km2 (55.87%) in 2022.
Between 1985 and 1999, the vegetation lands have increased with rate of 4.8% in particular the orchards, the palm trees, and fruits, while decreased the percentage of 12.88% in 2022. Also, the barren area is decreased from 4.8% to 0.85%, The lack of proper management of urban lands have resulted in use of rough lands which are not suitable for urban use and construction sites. The comparison of the change percentage in different LULC classes is classified in Figure 4. The total change in water bodies is decreased to 3.92% between 1985 and 1999, and the next time has raised up to be 1.06% in 2022.
In general, a wide parts of vegetation lands have reduction because effect of poor management, agricultures lands clearance, the expanding in urbanization, as well as the effect of drought c and shortage of water. In addition, the changes in the amount of natural flow and in the conveyance, systems are the key to sediment problems the change in water bodies is associated with seasonal weather patterns of the region of study is encounter of a hot desert climate the with an average temperature as high as 40℃ and a lack in rainfall quantity, besides movable Aeolians sand storm which have a direct impacted on the Land Cover and Land Cover. These results agree with Al Zamili et al. [34] who studied urban area in Al-Nasiriyah city between the year 1989 and 2014 and predict its probable future growth using Remote Sensing which provides an insight into understanding of urban growth and aids in subsequent infrastructure planning and management). While El Naggar et al. [35] provided an accurate assessment of the agricultural areas in Babil governorate between 1985 to 2015. The obtained results indicated that agricultural areas were significantly decreased in the studied area from 1985 to 2015 based on the three studied vegetation indices (NDVI, TNDVI and SAVI).
Table 4. The change detection in LULC of Al Mussiyab District
|
Area and Percentage Change |
||||||
|
Land Use Categories |
Area, km2 |
% |
Area, km2 |
% |
Area, km2 |
% |
|
1985 |
1999 |
2022 |
||||
|
Built up area |
35.56 |
3.52 |
47.36 |
3.71 |
73.23 |
7.32 |
|
Vegetation land |
662.24 |
65.71 |
626.40 |
62.14 |
573.40 |
56.88 |
|
Water bodies area |
28.45 |
2.82 |
31.34 |
3.13 |
25.61 |
2.54 |
|
Barren area |
281.75 |
27.95 |
322.9 |
32.05 |
335.76 |
33.32 |
|
Total |
1008 |
100 |
1008 |
100 |
1008 |
100 |
Table 5. The rate of change for LULC categories in 1985, 1990 and 2022 within Al Mussiyab District
|
Land Use Categories |
Rate of Change in Area km2/year (1985-2022) |
Rate of Change% (1985-1999) |
Rate of Change% (1999-2022) |
Rate of Change% (1985-2022) |
|
Built up area |
+1.25 |
+0.19 |
+3.61 |
+3.80 |
|
Vegetation land |
-2.98 |
-3.57 |
-5.26 |
-8.83 |
|
Water bodies area |
+0.09 |
+0.31 |
+5.73 |
-0.28 |
|
Barren area |
+1.83 |
+2.10 |
+3.25 |
+5.35 |
Figure 3. The percentage and magnitude of change for LULC categories within Al Mussiyab District
Table 6. The change detection in LULC in Al Hindiyah District
|
Land Use Categories |
Area and Percentage Change |
|||||||
|
Area, km2 |
% |
Area, km2 |
% |
Area, km2 |
% |
|||
|
1985 |
1999 |
2022 |
||||||
|
Built up area |
102.34 |
14.7 |
129.63 |
18.62 |
184.42 |
26.50 |
||
|
Vegetation land |
445.34 |
63.98 |
478.64 |
68.77 |
388.89 |
55.87 |
||
|
Water bodies area |
56.67 |
8.14 |
28.84 |
4.24 |
36.92 |
5.32 |
||
|
Barren area |
91.65 |
13.17 |
58.34 |
8.38 |
85.72 |
12.32 |
||
|
Total |
696 |
100 |
696 |
100 |
696 |
100 |
||
Table 7. The rate of change for LULC categories in 1985, 1999 and 2022 within Al Hindiyah District
|
Land Use Categories |
Rate of Change in Area km2/year (1985-2022) |
Rate of Change % (1985-1999) |
Rate of Change % (1999-2022) |
Rate of Change % (1985-2022) |
|
Built up area |
+1.07 |
+3.92 |
+7.88 |
+11.8 |
|
Vegetation Land |
-2.07 |
+4.80 |
-12.88 |
-8.11 |
|
Water bodies area |
0.78 |
-3.92 |
+1.06 |
-2.84 |
|
Barren area |
+1.54 |
-4.80 |
+3.92 |
-0.85 |
Figure 4. The percentage and magnitude of change for LULC categories in Al Hindiyah District
4.2 Image classification and creating Land Use-Land Cover map
The research is accomplished to capture as accurate as possible four categories of Land Use change through time scale. Processing satellite images is established by direct connection between collected data and physical phenomena. The detection technologies and GIS tools were exploited to estimate areas, Land Uses, and analyze LULC detection in various time intervals. Then figures are generated to analyze environment of geographic details, and their area are established. The data are collected through analysis multi-temporal satellite imageries. There are two fundamental issues to perform this stage, the first issue; properly might not be distinguished the exact boundaries of polygons due to lack of precision. Second issue; is occurs when some elements will not be distinguished properly due to lack of resolution or lack of precision in detachment of their locations. It is used aerial photos for 2022 were utilized as main data for estimation Land Use change and the advancement in urban areas. The results are illustrated the change in Land Use/ Land Cover to each category within study districts from satellite data of high resolution in 1985 and 2022 by using GIS and demonstrate the magnitude of change are illustrated in the Figures 5-7. Built-up and urban areas are in general take in consideration as a quantitative parameter which explain the whole expansion in urbanization. The class of built-up area consist trade centers, residential areas which consisting a single house, industrial and commercial facilities, main roads, highways and green space. Agricultural areas in river basin are consisted farms and lands, clump of shrubs and bushes land without orchards area, villages and their characteristics with livestock. The water bodies refer to regions where Euphrates River stream and its canals, ponds and branches situated in the southern and eastern parts of river and sandy regions is unutilized lands constitute barren lands. While the unused lands category was sorted as a hard region because the climate change and bad management which included; desert area, saline lands and swamps.
The channels have been prepared after taking a clip from the shape of Babylon Governorate’s map. Each category is drawn in polygon form in an individual shapefile based on 2022 satellite images [23]. For Al Hillah District, the digital images are presented with details that quantify variations in LULC at two different dates. The comparisons are clarified in Figures 5a and 5b. For estimating Land Use change, aerial photos from 2022 are utilized as the main data. The results illustrate irregular development and demonstrate abnormality and chaos in population and construction density over the last three decades. On the other hand, the sites of built-up areas and population density are not appropriate in most parts. The unused spaces between empty urban areas and built-up regions are the major parts that have been filled with construction density.
Figure 5. LULC classification of Al Hillah District (a) LULC classification in 1985 and (b) LULC classification in 2022
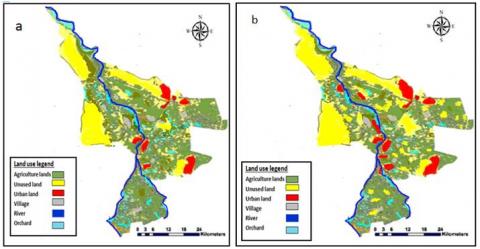
Figure 6. LULC classification at Al Mussiyab District (a) LULC classification (1985) and (b) LULC classification in 2022
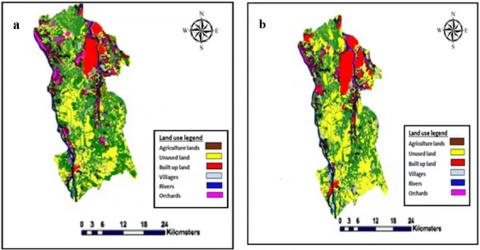
Figure 7. LULC classification at Al Hindiyah District (a) LULC classification 1985 and (b) LULC Classification in 2022
The map for the Al Mussiyab District is prepared based on the data from internal reports to the Iraqi Ministry of Water Resources. It is then checked by analyzing satellite images from IMMPW in 2022. The relevant information regarding changes in agricultural lands, urban areas, and barren lands within the study catchment was obtained for two different time scales.
The satellite images from 1985 and 2022 are used, in addition to Tables 4 and 5, to detect Land Use changes in the Al Mussiyab area. A comparison of Land Use and Land Cover changes for these years is indicated in Figures 6a and 6b. There is also a notable variation in agricultural areas distinguished in the Al Mussiyab District, with a slight increase in agricultural areas, particularly in the southeastern parts of Al Mussiyab District and the northwestern parts of Al Hillah District, as a result of land reclamation projects in areas close to water bodies. The presence of water resources and their good quality make it easier to cultivate these areas.
The detection analysis in Al Hindiyah District is explained the variations in quantifies among lands uses in 1985 and 2022. The contrast between results is classified in the two dates can described in the Figure 7a and 7b. The image is identified the alteration in different classes of Land Use like the growth in built-up area and barren area because of disturbed in Land Use is illegal conversion of urban areas as results of rapid population growth. besides the decrease in agricultural lands with time scale, there is an alteration in the expansion of agricultural lands due to a lack of support and possibilities for irrigation systems, as well as farmers' reliance on old methods. Additionally, the weakness in reclaiming saline lands is evidenced by the appearance of water during the rainy season. This impact is clearly visible in 2022 in the orchards of palm trees and fruits, while the seasonal and cultivated areas that produce crops such as rice and corn (wheat) have not been largely affected by this transformation. This variation is evident in approximately 25 km2 in the southern part of the district. The classification indicates that the influence of Land Use change on hydrologic evaluation is due to the effects of drought on the behavior of channels diverted from the Euphrates River. Furthermore, the increase in deposited sediment has a significant effect on changing the behavior of the area.
This research primarily highlights the changes in Land Use and Land Cover patterns in three main regions around the Euphrates River in Iraq over the last three decades. Land Use/Land Cover change has been studied from different aspects to recognize the drivers of this change, their processes, and consequences. The study includes the use of Remote Sensing and Geographic Information System (GIS) techniques to detect the types of changes, their geographical locations, quantify the changes, and evaluate the accuracy of the results. The results demonstrate the robustness of these techniques in capturing spatial-temporal data with high accuracy and high temporal frequency, as well as spatial and spectral resolutions. In addition, the results indicate that the main reason for LULC change is rapid population growth and the violation of Land Use, along with the illegal conversion of farmland to urban areas, desertification, and climate change. This problem needs to be studied seriously through multi-dimensional fields to preserve and detect changes. The progress of technology, the availability of historic spatio-temporal data, and high-resolution satellite images are very helpful for conducting LULC change detection analysis and predicting future scenarios. Based on this study, the analysis of the results leads to future findings that the continuous expansion of urban areas and the infringement of Land Use will produce negative impacts and great pressure on the desired areas and available water resources. The LULC change detection provides a proper background and database for environmental planning, land management, and water resources management.
[1] Butt, A., Shabbir, R. Ahmad S., Aziz, N. (2015). Land use change mapping and analysis using Remote Sensing and GIS: A case study of Simply watershed, Islamabad, Pakistan. Egyptian Journal of Remote Sensing and Space Science, 18(2): 251-259. https://doi.org/10.1016/j.ejrs.2015.07.003
[2] Muttitanon, W., Tripathi, N.K. (2005). Land use/land cover changes in the coastal zone of Ban Don Bay, Thailand using Landsat 5 TM data. International Journal of Remote Sensing, 26(11): 2311-2323. https://doi.org/10.1080/0143116051233132666
[3] Zhang, K., Kimball, J.S., Running, S.W. (2016). A review of remote sensing based actual evapotranspiration estimation. Wiley Interdisciplinary Reviews: Water, 3(6): 834-853. https://doi.org/10.1002/wat2.1168
[4] Rawat, J.S., Kumar, M. (2015). Monitoring land use/cover change using remote sensing and GIS techniques: A case study of Hawalbagh block, district Almora, Uttarakhand, India. The Egyptian Journal of Remote Sensing and Space Science, 18(1): 77-84. https://doi.org/10.1016/j.ejrs.2015.02.002
[5] Boori, M.S., Vozenilek, V. (2014). Land cover disturbance due to tourism in Jeseniky mountain region: A remote sensing and GIS based approach. In Earth Resources and Environmental Remote Sensing/GIS Applications V, 9245: 183-193. https://doi.org/10.1117/12.2065112
[6] Goudie, A. (2000). The Human Impact on the Natural Environment. 5th Edition. The MIT Press, Cambridge, Massachusetts.
[7] Bunch, M.J., Kumaran, T.V., Joseph, R. (2012). Using Geographic Information Systems (GIS) for spatial planning and environmental management in India: Critical considerations. International Journal of Applied Science and Technology, 2(2). https://doi.org/10.1061/(ASCE)CP.1943-5487.0000296
[8] Amna Butt, A.B., Rabia Shabbir, R.S., Ahmad, S.S., Neelam Aziz, N.A., Mohammad Nawaz, M.N., Shah, M.T.A. (2015). Land cover classification and change detection analysis of Rawal watershed using remote sensing data. 6(1): 236-248. https://innspub.net/wp-content/uploads/2022/11/JBES-V6-No1-p236-248.pdf.
[9] Fisher, P., Comber, A.J., Wadsworth, R. (2005). Land Use and Land Cover: Contradiction or Complement. John Wiley & Sons.
[10] Al-Taei, A.I., Alesheikh, A.A., Darvishi Boloorani, A. (2023). Land use/land cover change analysis using multi-temporal remote sensing data: A case study of Tigris and Euphrates Rivers Basin. Land, 12(5): 1101. https:/doi.org/10.3390/land12051101
[11] Mahmud, A., Achide, A.S. (2012). Analysis of land use/land cover changes to monitor urban sprawl in Keffi-Nigeria. Environmental Research Journal, 6(2): 130-135. https://doi.org/10.5555/20123249583
[12] Mohammed, M.G. (2023). Land use land cover changes detection of Erbil city using GIS and remote sensing. Polytechnic Journal, 13(1): 5. https://doi.org/10.59341/2707-7799.1729
[13] Wright, C.K., Wimberly, M.C. (2013). Recent land use change in the Western Corn Belt threatens grasslands and wetlands. Proceedings of the National Academy of Sciences, 110(10): 4134-4139. https://doi.org/10.1073/pnas.121540411
[14] Mohammed, E.A., Hani, Z.Y., Kadhim, G.Q. (2018). Assessing land cover/use changes in Karbala city (Iraq) using GIS techniques and remote sensing data. In the Sixth Scientific Conference "Renewable Energy and its Applications", Karbala, Iraq, p. 012047. https://doi.org/10.1088/1742-6596/1032/1/012047
[15] Al Jabbari, M., Hassen, Q., Emad, M. (2002). National Program in the best used of Water Resources Within Euphrates Basin. Ministry of Agriculture, Baghdad, pp. 520.
[16] Pradhan, B., Suleiman, Z. (2009). Land cover mapping and spectral analysis using multi-sensor satellite data: A case study in Tioman Island, Malaysia. Journal of Geomatics, 3(2): 71-78.
[17] Lin, F.T. (2000). GIS-based information flow in a land-use zoning review process. Landscape and Urban Planning, 52(1): 21-32. https://doi.org/10.1016/S0169-2046(00)00110-9.
[18] Sankhala, S., Singh, B. (2014). Evaluation of urban sprawl and land use land cover change using remote sensing and GIS techniques: A case study of Jaipur City, India. International Journal of Emerging Technology and Advanced Engineering, 4(1): 66-72.
[19] Coops, N.C., Wulder, M.A., White, J.C. (2006). Identifying and describing forest disturbance and spatial pattern. In Understanding Forest Disturbance and Spatial Pattern. Boca Raton: CRC Press, 1st Edition. https://doi.org/10.1201/9781420005189
[20] Chen, G., Hay, G.J., St-Onge, B. (2012). A GEOBIA framework to estimate forest parameters from lidar transects, Quickbird imagery and machine learning: A case study in Quebec, Canada. International Journal of Applied Earth Observation and Geoinformation, 15: 28-37. https://doi.org/10.1016/j.jag.2011.05.010
[21] Ashraf, A. (2013). Changing hydrology of the Himalayan watershed. In Current Perspectives in Contaminant Hydrology and Water Resources Sustainability. BoD - Books on Demand. https://doi.org/10.5772/54492
[22] Al-Ansari, N. (2013). Management of water resources in Iraq: Perspectives and prognoses. Engineering, 5(6): 667-684. https://doi:10.4236/eng.2013.58080
[23] IMoMPW (Iraqi Ministry of Municipalities and Public Works). (2022). Records of Directorate of Babylon Municipalities, Babylon.
[24] IMoP (Iraqi Ministry of Planning). (2022). Records of Directorate of Census Babylon. Internal Reports, Iraqi Ministry of Planning, Baghdad.
[25] IMoE (Iraqi Ministry of Education). (2023). Data of the Directorate General. Internal Reports, Department of Scientific Affairs, Baghdad.
[26] Selmy, S.A., Kucher, D.E., Mozgeris, G., Moursy, A.R., Jimenez-Ballesta, R., Kucher, O.D., Fadl, M.E., Mustafa, A.R.A. (2023). Detecting, analyzing, and predicting land use/land cover (LULC) changes in arid regions using landsat images, CA-Markov hybrid model, and GIS techniques. Remote Sensing, 15(23): 5522. https://doi.org/10.3390/rs1523552
[27] ESRI. (2008). What’s new in ArcGIS 9.3. ArcGIS Server 9.3 Help. Environmental Systems Research Institute, Redlands, California, USA. https://webhelp.esri.com/arcgisserver/9.3/dotNet/index.htm#whats_new_93.htm.
[28] Kumar, P., Sharma, L.K., Pandey, P.C., Sinha, S., Nathawat, M.S. (2012). Geospatial strategy for tropical forest-wildlife reserve biomass estimation. IEEE Journal of Selected Topics in Applied Earth Observations and Remote Sensing, 6(2): 917-923. https://doi.org/10.1109/JSTARS.2012.2221123
[29] Adamo, N., Al-Ansari, N., Sissakian, V.K., Knutsson, S., Laue, J. (2018). Climate change: Consequences on Iraq’s environment. Journal of Earth Sciences and Geotechnical Engineering, 8(3): 43-58.
[30] Abbas, L.K. (2021). Mapping land cover/land use for change derivation using remote sensing and GIS technique. Iraqi Journal of Science, 62(10): 3772-3778. https://doi.org/10.24996/ijs.2021.62.10.3
[31] UN-ESCWA and BGR (United Nations Economic and Social Commission for Western Asia). (2013). Euphrates River Basin. Inventory of Shared Water Resources in Western Asia. Beirut. https://archive.unescwa.org/publications/inventory-shared-water-resources-western-asia.
[32] Al Bayaty, M., Al Mousawi, E. (2020). The impact of land use change on perform (soil-water) system in middle part of Mesopotamian Plain. Revista de Chimie, 71(10): 137-179. https://doi.org/10.37358/Rev.Chim.1949
[33] Mason, M. (2022). Infrastructure under pressure: Water management and state-making in southern Iraq. Geoforum, 132: 52-61. https://doi.org/10.1016/j.geoforum.2022.04.006
[34] Al Zamili, H.H., El-Mewafi, M., Beshr, A.M. (2015). Monitoring urban growth and land use change detection with GIS and remote sensing techniques in Al-Nasiriyah city in Iraq. International Journal of Scientific and Engineering Research, 6(7): 2229-5518.
[35] El Naggar, A., Elmwafi, M., Ismael, M. (2016). Evaluating the role of natural resources in sustainable development in Babil Governorate, Iraq by using GIS and remote sensing. International Journal of Scientific & Engineering Research, 7(6): 55-66. https://www.researchgate.net/publication/316526756.