Mouloud Tizzaoui*![]() | Belkacem Draoui
| Belkacem Draoui![]()
© 2024 The authors. This article is published by IIETA and is licensed under the CC BY 4.0 license (http://creativecommons.org/licenses/by/4.0/).
OPEN ACCESS
Hot and dry environments may adversely affect the efficiency and performance of vapor compression refrigeration systems, increasing energy consumption and operating challenges. This experimental investigation examines the thermodynamic aspects of solar electric-vapor compression refrigeration systems built in southwest Algeria's ADRAR province's climate. For this, a reliable monitoring and recording device on the testing bench records one-minute data intervals. An example assessment on a sample test day in July 2023. At 2:05 PM, the outdoor weather was 49.4℃, 1-3% RH, and 1020 w/m2 global solar GHI, coinciding with high cooling requirements. About 100 kg of tomatoes is introduced into storage space at 11:16 AM with a thermostat setting at 8-12℃. In the first transient regime, the results indicate that the compressor functions at 25 bar with a compression ratio of about 5 for 67 minutes. The store's chill temperature is reduced to 15℃, whereas the internal relative humidity is between 70% and 90%. The condensation temperature and pressure are high, so the distributions are within the manufacturer's limit. These circumstances enable refrigeration unit efficiency to approach an average COP value of 1.08. The high irreversibility between indoor and outdoor environments frequently impacts expansion and evaporation temperatures. In contrast, with a recommended choice of specific technical criteria, this solar PV refrigeration facility is an alternate sustainable solution for unreliable or distant grids and remote Saharan farmlands.
vapor compression refrigeration systems, measurement data, performance COP, condensing phenomenon, ambient temperature, pressure level, cold storage, solar PV, Saharan environment, remote areas
Refrigeration facilities and the support of various domestic and industrial activities are essential, especially in storing post-harvest vegetables. According to the International Institute of Refrigeration (IIR) (2002) [1], around half a billion refrigeration systems operate globally, accounting for 20% of global electricity consumption. A suitable approach for improved refrigeration technology is necessary to assess energy efficiency and can significantly reduce electrical power consumption. However, refrigeration systems operate differently due to pressure loss and other variations, reducing efficiency and requiring more compressed energy. The VCR system proves successful at medium ambient temperatures, but its effectiveness decreases drastically in hot climates with increasing outdoor temperatures. A trend towards more significant cooling requirements in hot areas challenges conventional vapor compression refrigeration systems. It is also crucial to understand the effects of outdoor weather conditions on plant performance to improve energy efficiency and minimize operating losses [2]. Ambient temperature and humidity typically fluctuate based on location, and changes in the outdoor environment significantly influence the coefficient of performance (COP) of the air conditioning unit [3]. Indeed, factors such as refrigerant type, outdoor temperature, evaporator, compressor, condenser, and other parameters must be considered when selecting the most suitable cooling package. Prior research shows that vapor compression refrigeration systems experience severe strain in hot areas, and greater ambient temperatures may slope system effectiveness, increase compressor energy consumption, and increase operating pressures. Their study [4] discusses the experimental findings of a refrigerator system that switches on and off, investigating distinct ambient temperatures, charge quantities, and expansion device capacities. For an altered ambient temperature, the revealed about the ideal system charge increased as the ambient temperature decreased. According to this study, the efficiency ratio is at its highest level in the liquid-vapor heat exchanger and lowest in the condenser for all the refrigerants under consideration. Moreover, R 507A is a superior alternative to the rest. The authors conducted a research experiment to evaluate the efficiency of a refrigeration unit operating on the fluid HFO-1234YF [5]. The cabin interior conditions were kept at 50% relative humidity and 20℃, while the ambient temperatures were changed to 25℃, 35℃, and 45℃, respectively. Based on the findings, the system's performance (COP) drops are notably elevated compared to the standard scenario, particularly when the ambient temperatures exceed 30℃. Indeed, the reduction in cooling efficiency is more pronounced than in the standard case, particularly when contrasted with outdoor conditions of 35℃ and 45℃. A research study was conducted [6] to investigate the effect of implementing a secondary subcooling cycle on energy efficiency using a single vapor compression residential refrigeration system. R22 fluid is utilized in the primary cycle, whereas R12 is working fluid in the secondary subcooling cycle. Moreover, applying the additional subcooling cycle boosted the cycle's efficiency about the second law by roughly 21%. Furthermore, the findings showed that the proportion increase corresponds to the ambient temperature fluctuations. The study [7] showed the influence of the ambient air temperature and the mass quantity of the refrigerant charge on thermodynamic performance. The refrigeration cycle system studied was a split-type air conditioner. The energy efficiency rate fell by around 30% when setting the ambient temperature from 27 to 45℃. The research [8] recently examined how a VCR system performs with twelve refrigerants at varying ambient temperatures. The results indicate that R245fa demonstrated superior performance with a COP of 4.753 at 35℃, whereas R410A and R507A exhibited less effectiveness at higher ambient temperatures. R600a and R290 failed to develop a saturated liquid state for gases at all ambient temperatures ranging from 35℃ to 55℃. On the other hand, much study development and work attention to modify the refrigeration vapor compression cycle. Exciting research on exploring techniques such as dual evaporators [9], cascade refrigeration [10], microchannel heat exchangers [11], magnetic fields [12], and nanofluids [13]. These innovative approaches can potentially develop the refrigeration industry, as the new replacement refrigerants should possess favorable characteristics like non-flammability, sustainability, and a high coefficient of performance (COP). Previous research has shown promising results, with alternative refrigerants to commercial R22 being successfully utilized [14]. In a recent study [15], researchers conducted experiments and demonstrations to evaluate various refrigerants and mixtures as potential alternatives to commercial refrigerants like R134a in vapor compression refrigeration systems. By examining heat transfer criteria, scientists predicted low-GWP refrigerants' energy and exergy efficiency in the HFO and HFC categories, further fueling our optimism for the future of refrigeration technology. The advantageous integration of the potential of solar energy sources in various domestic and industrial domains, such as cooling and air conditioning, is an alternative solution. The solar refrigeration system generally consists of three parts: the solar energy conversion process, the refrigeration cycle, and the refrigeration load. The appropriate cycle for each purpose will depend on the cooling demand, power, and temperature levels of the refrigerated object and its outside environment. Sustainable agriculture product preservation in solar refrigerated warehouses has numerous practical and technical challenges. Various experiments and studies have analyzed the VCR operation based on solar PV-electric supply [16, 17]. Adrar, Algeria's warmest Saharan province, has an average annual sunshine duration of over 3500 hours. This site is favorable for testing the main uses of solar PV energy for cooling purposes. In this context, the performance of VCRs, especially in hot climates, specific criteria are more relevant, and searching for an economic optimum may lead to different choices of refrigeration devices [18]. Moreover, expertise in understanding the performance of refrigeration systems in this region is crucial for ensuring self-efficiency and sustaining cold storage facilities. In contrast, knowledge of various thermodynamic steps in a VCR apparatus is vital to efficient implementation and optimization. By adopting the laws of thermodynamics, analyzing the thermal aspects of refrigeration systems contributes to process progress and improvement. This method also allows evaluating the energy and exergy used and expended during the thermodynamic cycle. An extensive first law of thermodynamic analysis is necessary for the optimal design of engineering appliances. As discussed above, Research in Algeria primarily centers on numerical simulation and theoretical analyses of refrigeration processes. The studies often utilize open-source code, the EES program, and MATLAB. In the work [19], the authors simulate and design an SE cooler to safely store quality and tasty dates. By optimizing the storage parameters and cooling gas with less energy consumption, R152a is a reliable refrigerant that can own high critical temperatures, sufficient specific heat capacity, and potential cost-effectiveness of compression. Safe packaging in Tolga-Algeria-Dates food company can be achieved by safe cooling systems aimed at a wide variation of energy storage and delivery requirements of the manufacturing process. The only study [20] on preserving fresh tomatoes harvested from the Touat region in Adrar was done using an indirect solar dryer, not a cooling process. The experiment was carried out for three temperature values: 40℃, 50℃, and 60℃. The dried tomatoes were then subjected to microbiological and physicochemical analysis to assess their quality and compliance with commercial legislation in Algeria. To the best of our knowledge, under extreme desert climatic conditions, no research on a thorough evaluation of the thermodynamic efficiency of VCRS has yet been carried out. The analysis focuses on the transient regime, making it relevant to investigations in this area. To gain a thorough understanding of the thermodynamic aspect, particularly in the context of the technical challenge presented by the Saharan environment, we need to accumulate and synthesize exhaustive knowledge. This study attempts to fill this knowledge gap by providing evidence of the impacts of desert hot climate on the thermal behavior of a small-scale solar PV-powered cold storage based on a VCR system installed at the URER-MS center in Adrar, Algeria. We specifically offer proof of the effects on ambient temperature, pressure level, mass flow rate, COP, and other parameters. We apply a theoretical thermodynamic analysis of the fourth VCR cycle process of compression, condensation, expansion, and evaporation. The research exploited measurement data collected during the July sample test day. This study presents the results of the thermal behavior, providing an overall view of compressor operation, focusing mainly on the initial transient phase of an on/off compressor cycle. This study contributes to the experiment procedures in our previous design, involving a site survey, climatic condition assessment, load energy consumption, and component sizing [21-23]. This study contributes indirectly [24, 25] to the literature by emphasizing the thermodynamics of solar cold storage facilities. The general format of this paper is organized in a way that Section 1 describes the research background related to the paper's title. Section 2 discusses the preparation of the theoretical framework and the modeling methods of the R22 refrigerant cycle. Section 3 presents the experimental apparatus. Further, Section 4 depicts the result and discussion. Finally, section 5 describes the Conclusion and Future Recommendations for future work.
2.1 Single-stage vapor compression cycle
The vapor compression refrigeration system represents an advancement in air cooling. It utilizes a specific chemical compound as a refrigerant. The refrigerant circulates within the system, undergoing condensation and evaporation at various temperature and pressure levels without leaving.
The solar PV refrigeration system based on vapor compression has been modeled using the principles of conservation of mass and the first law of thermodynamics for each cycle element.
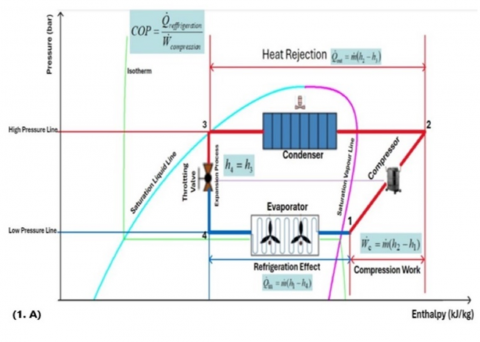
Figure 1 illustrates the typical sequence of a simple vapor compression refrigeration system according to the P-H diagram. It comprises of four processes:
Figure 1. Vapor compression cycle
Theoretical framework cycle
2.2 Real vapor compression cycle
Accurate or actual vapor compression refrigeration systems differ from the ideal theoretical one in different manners, with certain deviations being inevitable during operation. Whenever relating to this issue, the following viewpoints take place:
The system's performance is described using a mathematical depiction of the first law of thermodynamics. Figure 2 displays the Actual VCR cycle on the P-H diagram. Below are the equations that present numerous processes:
− Process (a’-b): The compressor power
$\dot{W}_{\text {comp }}=\dot{m}\left(h_{18}-h_{14}\right)$ (1)
where,
$\dot{m}$: Mass flow rate of refrigerant (kg/s);
$h_{18}$: Specific enthalpy at the exit of the compressor (kJ/kg);
$h_{14}$: Specific enthalpy at the inlet of the compressor (kJ/kg).
Figure 2. Real vapor compression cycle
P-H chart on selected state at p=25bar
The Tecumseh Europe company proposes a performance equation that calculates the compressor's cooling capacity, power, and current consumption concerning distinct coefficients, allowing for greater flexibility. This equation is derived from the compressor Model-AJ5515E-FZ 220-2240V 1~50 Hz datasheet in the manufacturer's standard instruction manual [26].
$\begin{gathered}X=C_0+C_1 * T_{\text {evp }}+C_2 * T_{\text {cond }}+C_3 * T_{\text {evp }}^2+C_4 * T_{\text {evp }} * \\ T_{\text {cond }}+C_5 * T_{\text {cond }}^2+C_6 * T_{\text {evp }}^3+C_7 * T_{\text {cond }} * T_{\text {evp }}^2+C_8 * \\ T_{\text {evp }} * T_{\text {cond }}^2+C_9 * T_{\text {cond }}^3\end{gathered}$
where, Tevp and Tcond are the evaporation and condensation temperatures and Constants Ci, respectively.
Table 1. Technical datasheet of the compressor model
|
X = Refrigeration Capacity (Qin) |
X= Absorbed Power of Compressor (Wcomp) |
|
|
C0 |
6.435023E+03 |
9.460280E+02 |
|
C1 |
2.148263E+02 |
-1.544614E+01 |
|
C2 |
-9.335502E+01 |
1.937699E+00 |
|
C3 |
2.290732E+00 |
2.372043E-01 |
|
C4 |
-2.088771E+00 |
7.008685E-01 |
|
C5 |
6.775029E-01 |
1.441639E-01 |
|
C6 |
-4.000000E-16 |
-2.000000E-16 |
|
C7 |
-1.818345E-02 |
-6.818563E-03 |
|
C8 |
5.420000E-03 |
-9.300000E-04 |
|
C9 |
-3.940000E-03 |
-8.840000E-04 |
According to the Table 1, the mass flow rate value obtained from the following equation:
$X=\dot{W}_{comp \ absorbed }=\dot{m}\left(h_{18}-h_{14}\right)$ (2)
$\dot{m}=\dot{W}_{comp \ absorbed} /\left(h_{18}-h_{14}\right)$ (3)
For the isentropic compression process, the deviation on compressor work is estimated as follows:
$\dot{W}_{c, isentropic}=\dot{m}\left(h_{18 \ isen}-h_{14}\right)$ (4)
h18 isen: Specific isentropic enthalpy state at the exit of the compressor (kJ/kg);
The isentropic ratio is defined as:
$\eta_{i s}=\frac{\left(\dot{W}_c / \dot{m}\right)_{isentropic }}{\dot{W}_c / \dot{m}}=\frac{\left(h_{18 \ isen}-h_{14}\right)}{\left(h_{18}-h_{14}\right)}$ (5)
$h_{18 \ isen }=h_{14}+\eta_{i s}\left(h_{18}-h_{14}\right)$ (6)
According to the correlation formula [27], this ratio can be expressed as:
$\eta_{\text {is }}=0.874-0.0135\left(\frac{P_{cond}}{P_{evp}}\right)$ (7)
where, Pevp and Pcond are the evaporation and condensation pressures, respectively.
The ratio of compression is also done as follows:
$\tau=\left(\frac{P_{High \ Pressur \ Line}}{P_{Low \ Pressure \ Line }}\right)=\left(\frac{P_{cond }}{P_{evp}}\right)$ (8)
− Process (b-c): The heat rejection of the condenser
According to the scholar manual of Air Conditioning and Refrigeration textbook, the $\dot{Q}_{cond}$ expressed as:
$\dot{Q}_{cond}=\dot{m}\left(h_{19}-h_{10 \ liquide}\right)$ (9)
where,
h10: Specific enthalpy at the exit of the condenser (kJ/kg);
h19: Specific enthalpy at the inlet of the condenser (kJ/kg).
− Process (c-d): The expansion of the liquid refrigerant state by throttling from the condenser's high-pressure line to the evaporator's low-pressure line.
$h_4=h_{10 \ liquide}$ (10)
− Process (d-a): The refrigerant mixture (liquid-vapor) flows in the evaporator from the entrance to the exit point, and that path produces a refrigeration effect in the enclosed space.
$\dot{Q}_{refrigeration}=\dot{m}\left(h_{12}-h_{10\ liquide}\right)$ (11)
− Process (a-a’): The superheat of the refrigerant from the saturation vapor state to additional heat before the entrance to the compressor.
$\Delta T=T_{14}-T_{12}$ (12)
The COP of a VCR-based solar PV cold storage is estimated by contrasting the cooling capacity with the electrical power required for the refrigeration unit [28]. The COP of the system is given by:
$COP=\frac{\left(\dot{Q}_{cooling \ capacity}\right)}{\left(\dot{W}_{electrical}\right)}=\frac{\left(\dot{Q}_{refrigeration\ effect}\right)}{\left(\dot{W}_c\right)}$ (13)
$COP=\frac{\left(h_{entrance \ before \ compressor}-h_{liquid \ exit \ condenser}\right)}{\left(h_{exitcompressor}-h_{entrance \ compressor}\right)}$ (14)
The P-H diagrams of the actual vapor compression refrigeration cycle are shown in Figure 2, based on the selected data points at the state:
$P_{L P L}=P_{evp}=5bar$ and $P_{H P L}=P_{evp}=25bar$
The set points segment describes the COP as follows:
$COP=\frac{\left(h_a-h_d\right)}{\left(h_b-h_{a^{\prime}}\right)}$ (15)
Finally, a formula calculation of cop is done as follows:
$COP=\frac{\left(h_{12}-h_{10}\right)}{\left(h_{18}-h_{14}\right)}$ (16)
3.1 Pilot scale bench test
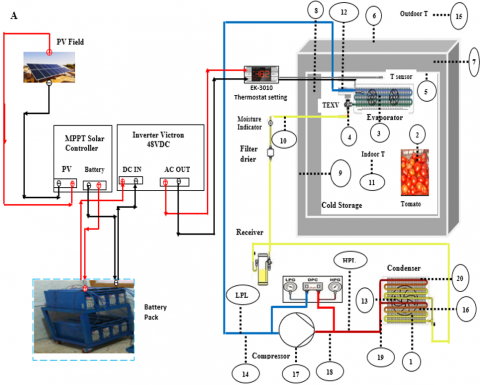
The drawing in Figure 3 illustrates the critical components of the pilot-scale test bench of the VCR system under experiment. The system consists mainly of a stand-alone solar PV conversion apparatus that supplies an AC output for a refrigeration unit's compressor and fan operation. The arrangement of the temperature, humidity, and pressure sensors is established by evaluating the thermo-mechanical chiller, which includes determining the compressor operation time, thermostat capabilities, and refrigeration effect on the inside of the chamber. Table 2 shows the different components of the cold storage refrigeration system. Our previous works provided advanced specifications for the solar PV refrigeration system [21-23].
Figure 3. Pilot scale test bench stand-alone solar PV energy source and Refrigeration unit
Table 2. Experimental device specification [21-23]
|
System |
Device |
Specification |
|
Refrigeration System |
Cold storage |
Volume= 7.5 m3 |
|
compressor AJ5515E |
220-240/ 50 Hz $\dot{W}_{absorbed}=1337 w$ |
|
|
Evaporator HEC 250-212-4D |
Cooling capacity 3kw |
|
|
thermostatic expansion valve |
Danfoss type N°01- 068-2010 |
|
|
Thermostat setting |
EK3010 |
|
|
Refrigerant Fluid |
R22 |
|
|
Solar PV system |
inverter |
Multiplus Victron 48VDC/5000VA/75 |
|
Charge Controller |
Blue Solar 150VDC-85A MPPT |
|
|
PV Field |
15-panel type Mono-Crystalline P=250w |
|
|
Battery |
Eight batterie’s model FIAM 12VFIT201AH |
3.2 Measurement uncertainty
Uncertainty is associated with the accuracy of the experimental instruments and systematic errors in the data. Research [29] provides a more advanced method for estimating experimental data's uncertainty (U) on thermal measurement. The current experimental investigation used thermocouples to measure the refrigerant temperatures at the inlets and outlets of the compressor, condenser, evaporator, and other locations. The manufacturer initially calibrated these thermocouples with an uncertainty of 1-2%. Additionally, the manufacturer used pressure gauges with uncertainty measurements ranging from 0.5 to 1% to measure the refrigerant pressure at the desired position. The humidity uncertainty is about 1-4% RH. The various sensors used in the experiments have a 96% confidence level of uncertainty. The standard deviation should be pretty slight. In this case, the experimental values are closer to the mean value, making measurements credible and consistent.
3.3 Data recording instrument
The subsequent statements describe the experimental instrument devices (shown in Figure 4) and the specifications for data collection.
Figure 4. Pilot scale test bench instrument data recording
In combination with a stand-alone solar PV-cooling system, an experimental measurement of the operation of the vapor compression cycle of each device under a load of 100 kg of tomatoes was carried out in July 2023. This occurred on a hot summer's day in the Algerian desert, along the Adrar province. This investigation enabled the first regime cooling process concerning the impact on the surrounding environment. In all the tests, the temperature inside the cold store was maintained between 8 and 12℃. The results examined the variation in thermodynamic parameters over the first stage of transient time when the ON/Cycle compressor was running. We then studied specific measurement points recorded on temperature, pressure, and humidity. Then, we calculate the specific enthalpy and mass flow rate. Moreover, we give the coefficient of performance of the refrigerant cycle for the state of the highest-level temperature in the compressor exit. Finally, the variation of COP in the ON/compressor stage and the effect of ambient temperature are shown in the graphical illustration.
4.1 Climatic constraints
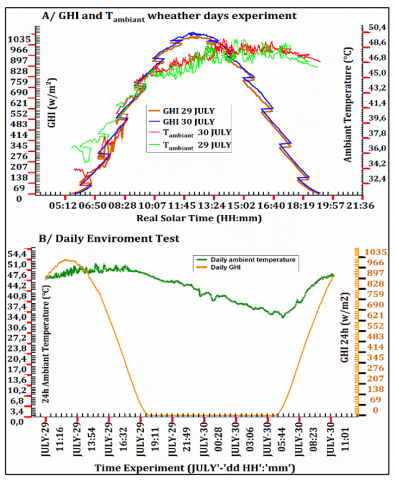
The territory of Adrar is located southwest of Algiers (28◦ N, -0.2◦ W) with an altitude of 276 m above sea level. Adrar possesses a hot-dry climate with an average insolation of 6.565 kWh/m2/day and an average wind speed of 2 to 3 m/s. Summer and winter have been the only seasons in this environment. A meteorological station at the Saharan Renewable Energy Research Unit (URER-MS) in Adrar site weather data (solar radiation, ambient temperature, and wind speed) experimentally recorded these data at 1-minute intervals. Figure 5a shows the two-day climatic constraint under the cold storage experiment analysis. Both 29 and 30 July days justify the same harsh climatic conditions with the peak temperature and GHI with corresponding times at 14h and 13h, respectively. Furthermore, the sunrise time is 6:20 AM., and the sundown time is 7:55 PM. The solar PV output starts at 6:50 AM. and extends to 7:30 PM, resulting in 13 hours of adequate sunshine. Figure 5b depicts the daily test weather data (solar radiation, ambient temperature). In this figure, the 29th of July 2023 is considered the warmest day in the measurements statement. At the beginning of the test at 11:16 AM, the average outdoor temperature was around 45℃, and global irradiance reached over 1019 w/m2 at 12:55 AM. A very high maximum temperature is observed, reaching 49,54℃ at 14:08 AM.
Figure 5. Climatic constraint test validation
4.2 Thermal overview in transient regime ON/cycle operation
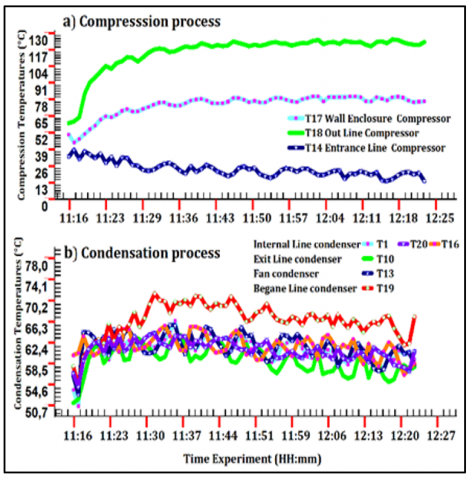
In the first transient regime (ON/Cycle) compressor running, the experimental results reflect the thermal processes of the vapor compression cycle (compression, condensation, expansion, and evaporation). The following figures show the measurement variation for such cold storage devices during the start-up (ON/Cyle) operation. It was noticed that the compressor's function frame time is from 11:16 AM to 12:23 PM, which means a continuous 67-minute operation. Figure 6 presents the data variation from the compression and condensation process. Figure 6a shows the distribution of temperatures for isentropic compression. The compressor's work depends mainly on the inlet conditions of the refrigerant, i.e., its specific volume. It also depends on external weather conditions. The temperature at which the compressor leaves depends on how much work has been done. Furthermore, evolution increases the compressor work with time, increasing the compressor exit temperature and reaching a maximum value of T18 equal to 125℃ at 12:03 PM. The compressor inlet is almost near the exit temperature of the evaporator and also drops with time. The T17 temperature of the cover of the wall compressor increases over time. It reaches a high level of around 80℃ at 12:03 PM, close to the temperature expected during the limit recommendations for manufacturing. In these harsh climatic conditions, the choice of this device is well-made for the cooling requirement. Figure 6b shows the distribution of temperatures along the condenser. The measurements occur at set positions of the beginning, center, and exit thermocouples (T19, T20, T16, T1, T10). Meanwhile, the thermocouple T13 is near the fan of the condenser. The beginning line condenser refrigerant temperature is close to the exit compressor T18 range. The high-level temperature recorded at value T 19 was equal to 71.54℃ at 11:32 AM. For others, point measurements of T20, T16, and T1 in the internal line condenser show the temperature distribution, which has the same profile evolution during refrigeration. Moreover, for the air velocity of the condenser fan, the T13 temperature variation occurs in the same range. For T10, the exit condenser temperature occurs at an average level of 60℃.
Figure 6. Temperature variation in (ON/Cyle running compressor) of the first continuous transient regime: a) Compression process; and b) Condensation process
In conclusion, this results in less heat drop in the condenser, so the refrigerant temperature is still high. The condenser exit temperature mainly depends on how much subcooling the refrigerant undergoes, which depends on the surrounding environment. Higher condenser temperatures have an immediate effect on the rate of heat rejection.
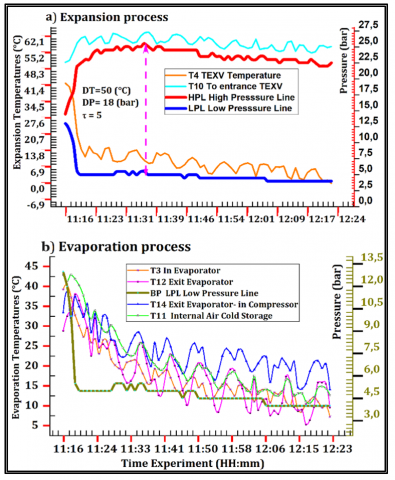
Nevertheless, ensuring that the resulting rise collapses within the suggested layout range of 40-45℃ is crucial. Operating outside the assigned range can have adverse effects, such as higher compressor work and more significant thermal losses, resulting in improved system performance [30]. The distribution of both temperatures and pressure lines for the expansion and evaporation phases is shown in the Figure 7. After the isentropic expansion in TEXV, the temperature reduces to low values as the pressure drops from the high-pressure line to the low-pressure line (Figure 7a). So, the refrigerant enters the expansion valve (from set point T10 with an average temperature of 60℃ and 23 bar to point measurement T4 with an average temperature of 8℃ and 5 bar). In this condition of the expansion process, the reduction between the entrance and exit is roughly T 50℃, and a pressure ratio of 5 bar. The temperature of the evaporator reflects its capacity to maintain the desired temperature in a given space or for a particular amount of load. As the loads grow, the temperature of the evaporator also rises, resulting in the need for additional power to cool the system back to its equilibrium state. Hence, it is necessary to emphasize achieving an average low temperature for the evaporator during the construction and assessment of the system. The holy cooling effect is continuously transiently to obtain the desired thermostat setting. The graph in Figure 7b shows the evaporation phase measurement of temperature (T3, T12, T14, T11, and low-pressure line). The distribution evolution decreases from the ambient external environment to the internal thermostat setting condition of cold storage. The average range is about 17℃ and 23℃ for the exit evaporators T12 and T14, respectively. As T14 is at the same time as the entrance of the compressor, there is a superheat from T12 to T14 of about 6K. Meanwhile, the average pressure is about 5 bar, and the average evaporation temperature, T3, is about 12℃.
Figure 7. Temperature and Pressure variations in (ON/Cyle running compressor) first continuous transient regime: a) Expansion process; b) Evaporation process
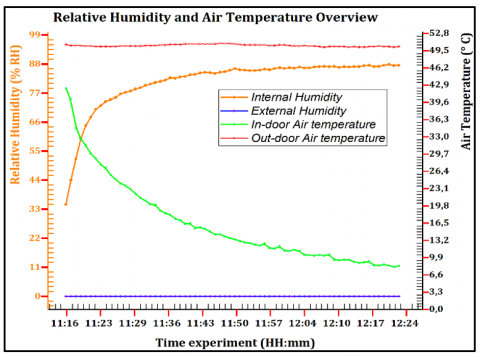
Figure 8 displays an overview of the refrigerated facility's relative humidity (RH%) and air temperature for the selected frame of the experiment. At first, the indoor cold storage has a humidity level approximately 25% higher than the external environment. Starting at 11:16 AM, the internal humidity (Rhint) gradually increases to 70-90%. Meanwhile, the external humidity (RHext) remains low, with a constant value of 0% on a harsh and dehydrated day). Moreover, the outdoor temperature still had a high level of path distribution with a constant value of 50.3℃ in this test period. On the contrary, the indoor air temperature changed from the ambient condition (42℃) to the (OFF monitoring EK-3010 thermostat setting temperature) after 67 minutes of continuous operation, about a drop of 34℃.
Figure 8. Relative humidity and air temperature distribution in (ON/Cyle running compressor) first continuous transient regime
The evolution of those parameters continues to be beneficial for tomato preservation. The graphical illustration in Figure 9 shows the distribution of tomato cooling and evaporation temperatures, respectively. The data measurement of evaporative air temperature reaches the thermostat setting after 67 minutes of continuous operation within a 34℃ decrease from the ambient start point. In contrast, the hot tomato product is introduced into the cold store at a harsh ambient temperature with distinct variation, as shown in Figure 10. The initial phase of the cooling process of tomato goods decreases around 15℃, with a temperature range of 43℃ to 28℃. The product temperature significantly affects the efficiency of cold storage units compared with refrigeration under vacuum conditions, primarily due to their specific respiration heat.
Figure 9. Tomato product and Evaporator temperatures distribution in (ON/Cyle running compressor)
4.3 Performance calculation in transient regime ON/cycle operation
The current section reports the performance calculation obtained through the measurement data. The unit's performance is assessed regarding the vapor compression cycle process, such as the refrigeration effect, heat rejection of the condenser, and COP calculation for critical temperature.
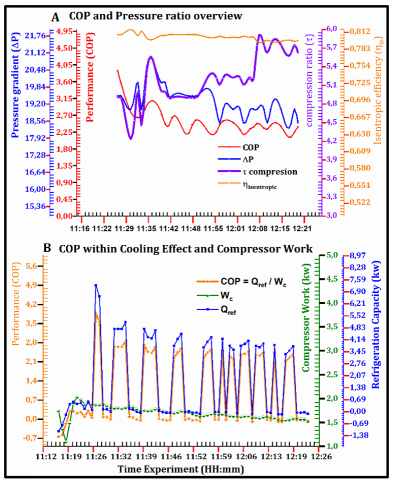
Figure 10. COP overview in first continuous transient regime (ON/Cyle running compressor): a). COP Versus pressure ratio; and b). COP Versus refrigeration effect and compressor work
The graphical illustration in Figure 10 shows the distribution of COP in (the ON/Cyle running compressor) of the first continuous transient regime. Figure 10a shows the COP variation over the pressure gradient, compression ratio, and isentropic compression efficiency. The mean COP range value is about 2.53, the DP =19.18 bar, the compression ratio =5.2, and the isentropic efficiency his =0.80. In addition, the COP distribution within the refrigeration effect is shown in (figure 10b). The variation of both COP and Qref paths is in reciprocal evolution. The high corresponding value recording at 11:26 AM about a cooling capacity of 7 kw and COP 3.89, respectively. Meanwhile, in some frame time, both low cooling effect and COP were obtained regarding the surrounding environment constraint. The compressor work profile after the startup period is within the range of 1.6kw.
As discussed in Section 2, the steps were calculated using the first law equation to obtain COP based on the REFPROP program [31]. The following value represents the calculation for the selected cycle point state based on the highest exit compressor temperature at 12:17 PM. Table 3 illustrates the state selected. We found a medium cop value with the highest compression ratio of 5.62.
Table 3. Cycle state of highest exit compressor temperature
|
State |
Point (a’) |
Point (b) |
Point (d) |
Point (a) |
|
Pressure (bar) |
4 |
22.5 |
22.5 |
4 |
|
Temperature (℃) |
15,56 |
125,21 |
55,92 |
5,32 |
|
Enthalpy (kJ/kg) |
423,08 |
472.71 |
283.03 |
423,95 |
|
COP formula |
$C O P=\frac{\left(h_a-h_d\right)}{\left(h_b-h_{a \prime}\right)}$ |
|||
|
Cop value |
2.87 |
|||
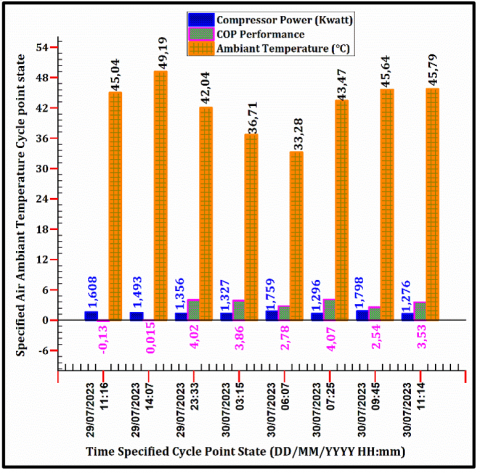
Column illustration in Figure 11 shows the values of COP and compressor power versus air ambient temperature for the different time-specified cycle point states. The ambient temperature selected at frame time (ON/Cycle) operation from starting the experiment, high-level cooling requirement, night period, rising sunlight, and 24-hour period finishing of the running compressor, respectively. The COP overview of the selected period ambient temperature illustrates the constraint climatic influence in starting the test at 11:16 AM and the high-level temperature at 14:07 with low COP and high energy consumption. We noted an exception represented in selected data of low COP values of 2.78 under the low ambient temperature of 33℃. This paradoxical case may agree with the high electrical power start-up compressor after the OFF cycle. In contrast, a high value of COP was recorded in the night period at roughly 4.02 at 11:33 on 29 July and in the morning at about 4.07 at 7:25 on 30 July. This result indicates the high performance of a refrigeration system that corresponds within the nominal power range of compressor operation under ambient temperatures of 42℃ and 43℃, respectively.
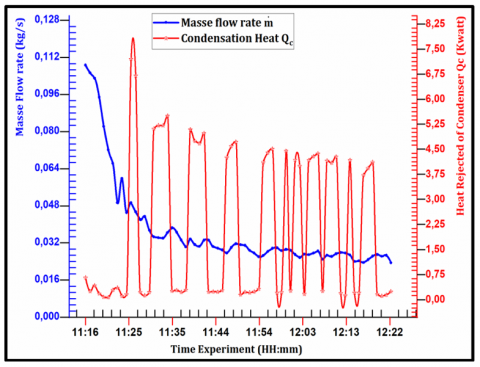
The mass flow rate distribution and the heat rejection of the condenser in the ON/Cycle running compressor of the first continuous transient regime are shown in Figure 12. The variation of Qc (Figure 12) paths is in the reciprocal evolution of COP, as discussed in Figure 10b. The high corresponding value recorded at 11:26 is about a heat rejection of 7.20 kW and COP 3.89, respectively. On the contrary, in some frame time, low efficiency of the condenser on heat rejected into the surrounding environment was obtained. In those conditions, the condensation phenomenon is a challenging fact regarding the subcooling temperature of the refrigerant. The variation of the mass flow rate in the refrigeration system starts at a high value and continues to reach an average value of 0.03 kg/s.
Figure 11. COP and compressor power versus ambient temperature for the different time-specified cycle point state
Figure 12. Masse flow rate and Condensation heat distribution in the first continuous transient regime
At the same time, our paper endorses the decisive role of the high ambient temperature in the overview and modeling of the VCR cycle process. Indeed, the results in Figure 6 validate this decision's effect on the compression and condensation processes. The condenser's high compression ratio and low heat drop mainly depend on the refrigerant subcooling. In contrast, according to the study [32], carefully controlling the condensation system's temperature must be within a specific. The main benefit of this case study is that it uses a sustainable and easily accessible solar PV energy source to overcome complex failures in the grid electricity network. Nevertheless, we must interpret these results with caution, considering several limitations. For this research, we chose the refrigeration fluid R22 primarily because of its compatibility with our VCRS compressor. However, we do not recommend using this specific refrigerant in the future due to its classification as a hydrofluorocarbon (HFC) with high global warming potential (GWP), as per the Kyoto Protocol's regulations [33]. Another option is to conduct investigations using distinct natural fluids, such as propane R290 or isobutane R600a. In future research, introducing different product charges may result in varying outcomes. Furthermore, to analyze advanced thermodynamics, we must test supplementary data measurements for various repetitive days of experiments in the hot season design range, typically around 40-45℃. According to the experimental setup [34], adding an extra condenser and the geothermal cooling method improves the system's thermal performance by lowering the condenser's temperature, raising its cooling capacity, and increasing its COP by 25% and 21.5%, respectively. Our results illustrate the technical challenge of implementing the VCR system in the Adrar climate compared to previous field studies and theoretical frameworks. On the other hand, we have selected a design range of cold storage facilities spanning 43 to 65℃ for this specific region. Therefore, the feasibility of this prototype indicates that it can operate with a lower efficiency improvement ratio.
This study assesses the performance parameters in solar PV electric-vapor compression refrigeration systems through experimental tests conducted in a critical Saharan climate. It also explores the initial cooling process versus the surrounding environment. The findings analyzed the fluctuations in thermodynamic parameters during the first stage of transient time as the (ON/Cycle) compressor experienced operation. The primary knowledge from the results indicates that the VCR system operates within a limited range of manufacturer-standard datasheets and that high ambient temperature drastically affects the VCR system performance. It is concluded from the above funding analysis that:
Thus, this subject is open to further exploration and necessitates additional research. Implementing an additional subcooling cycle may enhance VCRS improvement. Moreover, the irreversibility of exergy analysis is expandable and requires more investigations in future works.
The authors acknowledge all the assistance from the Renewable Energy Research Unit in the Saharan Medium (URER/MS), Renewables Development Centre (CDER)' of Adrar, Algeria, in completing this work.
|
T |
Temperature, ℃ |
|
P |
pressure, bar |
|
H |
Specific Enthalpy, kJ kg-1 |
|
$\dot{m}$ |
Mass flow rate, kg s-1 |
|
RH |
Relative air humidity (%) |
|
$\dot{Q}_{refrigeration }$ |
Cooling capacity of the evaporator (Kwatt) |
|
$\dot{W}_{comp}$ |
Power of compressor (Kwatt) |
|
$\dot{Q}_{cond}$ |
Heat release of condenser (Kwatt) |
|
COP |
Coefficient of Performance |
|
VCRS |
Vapor Compression Refrigeration Systems |
|
GHI |
Global Horizontal Insolation (kWh/m2/day) |
|
TEXV |
Throllting Expansion Valve |
|
Time |
HH:mm |
|
ODP |
ozone depletion potential |
|
GWP |
global warming potential |
|
Greek symbols |
|
|
$\eta$ |
efficiency |
|
$\tau$ |
Compression ratio |
|
ρ |
density, kg m-3 |
|
λ |
thermal conductivity, W m-1 K-1 |
|
Subscripts |
|
|
evp |
Evaporator |
|
cond |
Condenser |
|
com |
compressor |
|
is |
isentropic |
|
int |
internal |
|
ext |
external |
|
in |
indoor |
|
out |
outdoor |
|
i |
component indicator |
[1] Dupont, J.L., Domanski, P., Lebrun, P., Ziegler, F. (2019). The role of refrigeration in the global economy. 38th Informatory Note on Refrigeration Technologies. http://doi.org/10.18462/iif.NItec38.06.2019
[2] Barbosa Jr, J.R., Ribeiro, G.B., de Oliveira, P.A. (2012). A state-of-the-art review of compact vapor compression refrigeration systems and their applications. Heat Transfer Engineering, 33(4-5): 356-374. https://doi.org/10.1080/01457632.2012.613275
[3] Mohd Yunus, H., Nasution, H., Abdul Aziz, A., Sumeru, Dahlan, A.A. (2016). The effect of ambient temperature on the performance of automotive air-conditioning system. Applied Mechanics and Materials, 819: 221-225. http://doi.org/10.4028/www.scientific.net/amm.819.221
[4] Björk, E., Palm, B. (2006). Performance of a domestic refrigerator under influence of varied expansion device capacity, refrigerant charge and ambient temperature. International Journal of Refrigeration, 29(5): 789-798. https://doi.org/10.1016/j.ijrefrig.2005.11.008
[5] Mathur, G.D. (2010). Experimental investigation of AC system performance with HFO-1234yf as the working fluid. SAE Technical Paper, 2010-01-1207. https://doi.org/10.4271/2010-01-1207
[6] Qureshi, B.A., Inam, M., Antar, M.A., Zubair, S.M. (2013). Experimental energetic analysis of a vapor compression refrigeration system with dedicated mechanical sub-cooling. Applied Energy, 102: 1035-1041. https://doi.org/10.1016/j.apenergy.2012.06.007
[7] Gardenghi, Á.R., Lacerda, J.F., Tibiriçá, C.B., Cabezas-Gomez, L. (2021). Numerical and experimental study of the transient behavior of a domestic vapor compression refrigeration system–Influence of refrigerant charge and ambient temperature. Applied Thermal Engineering, 190: 116728. https://doi.org/10.1016/j.applthermaleng.2021.116728
[8] Khalaf, D.Z., Ahmed, G.M., Kareem, F.A. (2022). Influence of variation ambient temperature on vapor-compression system performancewith-12-types-of-ferion. International Journal on Technical and Physical Problems of Engineering, 14(4): 340-347.
[9] Liu, Y., Liu, J., Yu, J. (2020). Theoretical analysis on a novel two-stage compression transcritical CO2 dual-evaporator refrigeration cycle with an ejector. International Journal of Refrigeration, 119: 268-275. https://doi.org/10.1016/j.ijrefrig.2020.08.002
[10] Salhi, K., Korichi, M., Ramadan, K.M. (2018). Thermodynamic and thermo-economic analysis of compression–absorption cascade refrigeration system using low-GWP HFO refrigerant powered by geothermal energy. International Journal of Refrigeration, 94: 214-229. https://doi.org/10.1016/j.ijrefrig.2018.03.017
[11] Sohel, M.R., Saidur, R., Sabri, M.F.M., Kamalisarvestani, M., Elias, M.M., Ijam, A. (2013). Investigating the heat transfer performance and thermophysical properties of nanofluids in a circular micro-channel. International Communications in Heat and Mass Transfer, 42: 75-81. https://doi.org/10.1016/j.icheatmasstransfer.2012.12.014
[12] Monfared, B., Furberg, R., Palm, B. (2014). Magnetic vs. vapor-compression household refrigerators: A preliminary comparative life cycle assessment. International Journal of Refrigeration, 42: 69-76. https://doi.org/10.1016/j.ijrefrig.2014.02.013
[13] Bi, S.S., Shi, L., Zhang, L.L. (2008). Application of nanoparticles in domestic refrigerators. Applied Thermal Engineering, 28(14-15): 1834-1843. https://doi.org/10.1016/j.applthermaleng.2007.11.018
[14] Devotta, S., Padalkar, A.S., Sane, N.K. (2005). Performance assessment of HCFC-22 window air conditioner retrofitted with R-407C. Applied Thermal Engineering, 25(17-18): 2937-2949. https://doi.org/10.1016/j.applthermaleng.2005.03.002
[15] Prasad, U.S., Mishra, R.S., Das, R.K., Soni, H. (2023). Experimental and simulation study of the latest HFC/HFO and blend of refrigerants in vapour compression refrigeration system as an alternative of R134a. Processes, 11(3): 814. https://doi.org/10.3390/pr11030814
[16] Kaushik, S.C., Hans, R., Manikandan, S. (2016). Theoretical and experimental investigations on solar photovoltaic driven thermoelectric cooler system for cold storage application. International Journal of Environmental Science and Development, 7(8): 615-620. https://doi.org/10.18178/ijesd.2016.7.8.850
[17] Chen, Y., Liu, Y., Wang, Y., Wang, D., Dong, Y. (2017). The research on solar photovoltaic direct-driven air conditioning system in hot-humid regions. Procedia Engineering, 205: 1523-1528. https://doi.org/10.1016/j.proeng.2017.10.427
[18] Dadhich, S.M., Dadhich, H., Verma, R. (2008). Comparative study on storage of fruits and vegetables in evaporative cool chamber and in ambient. International Journal of Food Engineering, 4(1). https://doi.org/10.2202/1556-3758.1147
[19] Afif, B., Merabet, B., Inc, M., Menni, Y., Alsharif, S., Althobaiti, A., Aly, A.A. (2022). An improved solar cooling system for date safety and storage under climate of the Maghreb. International Journal of Photoenergy, 2022(1): 4799841. https://doi.org/10.1155/2022/4799841
[20] Loumani, A., Larbi, A.A., Mediani, A., Chaouch, W.B., Moungar, H., Tigani, C., Meriama, F., Djaber, A., Bekada, A.M.A. (2020). Experimental measurement of isothermal sorption, microbiological and physicochemical analysis of dried tomatoes cultivated in Adrar, Algeria. International Journal of Design & Nature and Ecodynamics, 15(5): 721-728. https://doi.org/10.18280/ijdne.150514
[21] Tizzaoui, M., Soualmi, H., Allaoui, M., Mansouri, A., Saadi, Z., Menacer, D., Chadli, S. (2020). Solar PV power driven cold room storage for Saharan rural area. In 2019 International Conference on Power, Energy and Electrical Engineering, London, UK, 152(E3S): 01004. https://doi.org/10.1051/e3sconf/202015201004
[22] Tizzaoui, M., Soualmi, H., Meguellati, F. (2022). Analysis consideration of a solar PV drive cold storage in Saharan environment. In International Conference on Advanced Renewable Energy Systems (ICARES 2022), BouIsmail-Tipaza, Algeria, pp. 1-10. https://doi.org/10.1007/978-981-99-2777-7_1
[23] Tizzaoui, M., Soualmi, H., Mguellati, F. (2023). Energy monitoring on stand-alone solar PV driven cold storage in the rural desert area. In International Conference on Artificial Intelligence in Renewable Energetic Systems (IC-AIRES 2023), Tipasa, Algeria, pp. 438-448. https://doi.org/10.1007/978-3-031-60629-8_42
[24] Alammar, A.A., Rezk, A., Alaswad, A., Ruhumuliza, J., Gasana, Q.G. (2021). Solar cooling modelling utilising for cooling agro-products cold store under Rwandan environmental conditions. IOP Conference Series: Materials Science and Engineering, 1067(1): 012111. https://doi.org/10.1088/1757-899X/1067/1/012111
[25] Meyer, J., von Solms, S. (2022). Design considerations for reducing battery storage in off-grid, stand-alone, photovoltaic-powered cold storage in rural applications. Energies, 15(9): 3468. https://doi.org/10.3390/en15093468
[26] TSelect. (2024). Compressor Model-AJ5515E-FZ 220-2240V 1~50 Hz datasheet. https://tselect.tecumseh.com, accessed on August 9, 2024.
[27] Özgoren, M., Erdoğan, K., Kahraman, A., Solmaz, O., Köse, F. (2010). Calculation of dynamic cooling load capacity of a building air-conditioning powered by wind or solar energy. In International Ege Energy Symposium and Exhibition (IEESE-5), Denizli, Turkey, pp. 27-30.
[28] Prabakaran, R., Sidney, S., Lal, D.M., Harish, S., Kim, S.C. (2022). Experimental performance of a mobile air conditioning unit with small thermal energy storage for idle stop/start vehicles. Journal of Thermal Analysis and Calorimetry, 147: 5117-5132. https://doi.org/10.1007/s10973-021-10863-7
[29] Moffat, R.J. (1988). Describing the uncertainties in experimental results. Experimental Thermal and Fluid Science, 1(1): 3-17. https://doi.org/10.1016/0894-1777(88)90043-X
[30] Ali, H.M., Kadhim, S.A., Ibrahim, O.A.A.M. (2023). Evaluating refrigerant purity characteristics: An experimental approach to assess impact on vapor-compression refrigeration system performance. International Journal of Heat and Technology, 41(4): 883-890. https://doi.org 10.18280/ijht.410410
[31] Lemmon, E.W., Huber, M.L., McLinden, M.O. (2007). NIST Standard Reference Database 23: Reference Fluid Thermodynamic and Transport Properties-REFPROP, Version 8.0. National Institute of Standards and Technology, Gaithersburg, MD.
[32] Bansal, P.K., Chin, T.C. (2003). Modelling and optimisation of wire-and-tube condenser. International Journal of Refrigeration, 26(5): 601-613. https://doi.org/10.1016/S0140-7007(02)00044-0
[33] United Nations Framework Convention on Climate Change (UNFCCC). (1997). Kyoto Protocol to the United Nations Framework Convention on Climate Change, in Kyoto Climate Change Conference, Kyoto, Japan.
[34] Ismael, M.A., Yahya, S.G., Azzawi, I.D.J. (2022). Experimental investigation of performance of conventional vapor compression refrigeration cycle using geothermal cooling in extreme hot weather conditions. International Journal of Heat and Technology, 40(2): 449-456. https://doi.org/10.18280/ijht.400212