Auns Q. Al-Neami*![]() | Ahmed F. Hussein
| Ahmed F. Hussein![]() | Haider K. Raad
| Haider K. Raad![]() | Noor Kamal Al-Qazzaz
| Noor Kamal Al-Qazzaz![]()
© 2024 The authors. This article is published by IIETA and is licensed under the CC BY 4.0 license (http://creativecommons.org/licenses/by/4.0/).
OPEN ACCESS
Tooth carious is a harmful and enduring hurt to parts of the teeth’ rigid surface that seem like small holes and cavities. Caries is caused by a summation of factors, such as creating bacteria between teeth, eating soft foods frequently, drinking sweaty drinks, and not brushing the teeth right. The present study aims to design and implement an electrical circuit for measuring the electrical impedances of healthy and carious teeth. Besides, the LCR meter analyser was employed to calculate the electrical average impedance and phase shift of healthy and carious teeth with different frequencies ranging from 0.01 Hz to 10 MHz. The presented study is supported by the scanning electron microscopy (SEM) and the Energy Dispersive X-ray spectroscopy (EDX) test for analysis of the teeth' structure and detect the elements and chemical characteristics of the teeth. The X-ray and imaging tests are done using dental radiography X-ray equipment in Al-Karkh General Hospital with the help of dentists. The results of the study showed that with the wide spectrum of frequencies, the electrical impedance averaged value for carious teeth is less than its value in the healthy teeth since the impedance real part is (3.63E+03 to 2.59E+06) Ω and (82.567 to 1.27E+05) Ω for the healthy and carious teeth respectively, with increasing in the frequency range (1.00E-02-8.89E+06) Ω and reducing the phase shift. Since healthy teeth have fewer chemical elements than carious teeth, the EDX test showed the chemical elements of the tooth, including Antimony, Calcium, Phosphorous, Carbon, and Chlorine, in different concentrations. The promising results show that the proposed method is sufficient and reliable to differentiate the carious in early stages, giving a chance to recover and maintain the teeth' health.
healthy teeth, carious teeth, bioimpedance, SEM test, EDX test, dental X-ray imaging
Caries of the enamel is a disease that still affects billions of people all over the world. This is primarily because of the consumption of fermentable sugars and poor hygiene practises, which allow oral bacteria to self-organize in biofilms (dental plaque) and produce acid as part of the acidogenic bacteria metabolism [1]. Enamel consists of hydroxyapatite (HAp), accounting for around 85 percent of its volume, together with water and a minor yet essential quantity of binding proteins. The components are organised in an intricate configuration [2, 3].
The capacity of biological tissue to impede the passage of an electric current is referred to as bioimpedance, or bioelectrical impedance. The bioimpedance spectroscopy (BIS) method can be used to measure the impedance of living tissue over a wide frequency range [4]. This is done by combining the two ways. Electric impedance spectroscopy (EIS) is a common method for characterising material electrical characteristics. BIS is methodologically comparable to EIS. EIS is a low-cost, non-destructive method for characterising electrical characteristics of different materials. Having said that, BIS is where the method is most often used on biological tissues [5]. The process involves measuring the impedance magnitude and phase difference at each frequency point while delivering a weak alternating current (AC)-like that present in human tissue-through the biological sample [6]. In some cases, like a full-body analysis, the "tissue" can be enormous; in others, like a microscopic section of the target tissue, like the mucosa, it could be incredibly tiny. In direct contact with the external environment, the mucosal membrane, also known as mucosa, borders several body cavities. When observed within the mouth, this membrane is known as the oral mucosa or oral mucous layer [7].
Spectral cameras work by detecting the light that is reflected off of an item after it has been illuminated by a light source [8]. Alternately, the object may be illuminated with a monochromatic light, and the light that is reflected back can then be filtered to identify certain wavelengths [9]. The kind of information that one seeks to extract from the item being investigated dictates the selection of the appropriate filter [10]. Imaging a sample's surface with a focused electron beam allows scanning electron microscopy (SEM) to produce images of the sample [11]. Scientists use these signals to study the sample in depth, determining surface shape, composition, and crystal structures through electron interactions with atoms in the sample. Elements and chemical compounds in a sample can be identified using chemical microanalysis techniques like EDS [12]. With a search engine optimization (SEM) tool, it is commonplace. Because each element has its own atomic structure, each X-ray signal created when blasted with electrons is unique, the characterisation capabilities of this technique are based on this basic premise. Micrometrical elemental compositions of a sample may be studied using this method [13]. A number of studies have been achieved recently that focuses the bioimpedance spectroscopy characteristics and importance. Emran et al. [1] developed a method for measuring electrical impedance utilising five distinct depth settings across a frequency range of 1 kHz to 1MHz. The impact of impedance magnitude and phase spectra is investigated by Lackovic and Stare [14] from 30Hz to 1MHz. Besides, Pathiraja et al. [15], Tatullo et al. [16] use the measurable impedance magnitude to identify the healthy teeth.
The LCR-meter electrical impedance analyzer was used in this study to measure the impedance change of various teeth with and without carious over a wide range of frequency [17-21]. The results demonstrated that the range of impedance value when the teeth are healthy is greater than when the teeth are carious. In addition, the SEM test was used to scan the surface characteristics of teeth.
2.1 Sample preparations
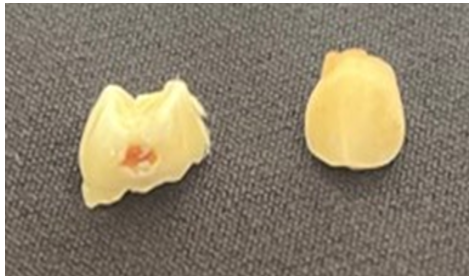
Twenty teeth were used in the present study, ten of them are healthy and the others are not, some of them are depicts in Figure 1. In order to keep them for a long time, all teeth were saved in saline solution. As for the samples, 20 teeth were examined from normal, healthy, recovered people who do not suffer from chronic diseases or bone diseases, and their ages are similar. The results were compared with the dental x-ray machine located in the hospital, and the results were presented to specialist dentists to evaluate the results.
Figure 1. Healthy and carious teeth samples
2.2 The electrical impedance measurements
It's possible to conduct electrical impedance studies using a variety of different approaches, including two, three, and four electrode techniques [17, 18]. In bioimpedance analysis, two and four-electrode procedures are the most prevalent [19-21]. In the present study to measure a bioimpedance, the two-electrode approach “bipolar method” which uses two electrical connections to inject a known.
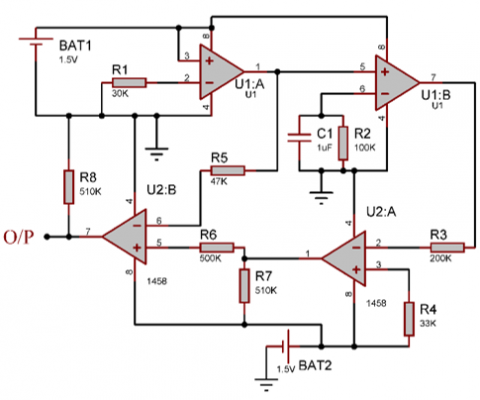
Current and measure the subsequent voltage drop between those two contacts. In the present study the proposed electrical circuit of the measurement of electricity was shown in Figure 2 and carried out by using an appropriate computer controlled soft-ware, also another approach was used for measuring the bio impedance by using the LCR-8110G electrical impedance analyser (GW INSTEK, Taiwan). A frequency range of (0.01Hz to 10MHz) for providing consistent and repeatable findings was used. Under open circuit conditions, the supplied AC voltage amplitude was 100mV rms. Coaxial leads were utilized to link the specimen to the impedance testing apparatus in order to reduce stray capacitance, and these connections were maintained as short as feasible (15 cm).
Figure 2. The proposed electrical circuit design
Figure 3. The electrical bioimpedance measuring process
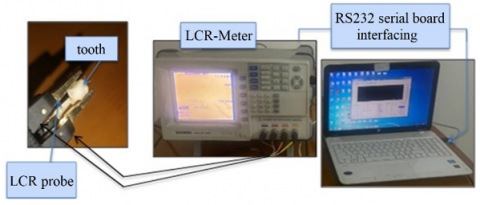
On one day, five measurements of impedance were taken on a specimen from each tooth group to test the technique's short and long-term repeatability, as well as it’s fit to the suggested equivalent circuit. Furthermore, a specimen from each group was measured on each of five distinct days, and the average impedance of all measurements, was calculated. The process for measuring (EIS) using an impedance analyser LCR-meter is shown in Figure 3.
The bioelectrical impedance measurement is achieved by two main methods: The first by applying an AC current with a constant value through the teeth, then measure the resultant voltage drop across the tooth and determine the impedance components. Second the use of the LRC system for calculating the resistance (R), reactance (inductive reactance XL and capacitive reactance XC), so calculate the impedance (Z). The interface of the present measurement including the personal computer electrical bioimpedance meter interfacing, since during the measurement by the LCR, the measured data is processed by the signal processing techniques and applying an algorithms and programs to measure and analyse the average bioimpedance of the healthy and carious teeth and their phase shift. The transmission of data from the bioimpedance meter to the computer was constructed according to the standard RS-232C interface, which is easy control and downloadable results to the PC. The proposed connection which is used to interface as shown in Table 1 is the RS-232C to connect to the USB converter.
Table 1. PC to LCR analyser connections
|
PC Pins |
Bioimpedance LCR-8110G Analyser Pins |
|
TxD (Pin2) |
RxD (Pin2) |
|
RxD (Pin3) |
TxD (Pin3) |
|
GND (Pin5) |
GND (Pin5) |
|
RTS (Pin7) |
RTS (Pin7) |
|
CTS (Pin8) |
CTS (Pin8) |
2.3 SEM and EDX experimental conditions
Dentine specimens were fractured and analysed under scanning electron microscopy (Inspect S50 SEM) at a regular vacuum was used for the investigation to obtain high spatial resolution. Figure 4 depicts the SEM that used in this study which is a multi- use SEM with a tungsten light filament. The analysis performed by this SEM can do with high or low vacuum, which permits the imaging process without using any not conductive materials. Also, the SEM can map the crystalline alignment of the surface of the material.
Figure 4. Inspect S50 SEM
Accurate information on the distribution of elements in a small region requires high spatial resolution. A lot of effort was put into optimizing the SEM-EDX experimental parameters in order to improve the spatial resolution [22, 23].
An electron beam is focused on the specimen, and this produces the SEM-EDX results. There are a number of various signals that may be generated when incident electrons interact with atoms in a specimen [24, 25]. For example, secondary and backscattered electrons, and characteristic X-rays. When using the EDX technique, the spatial resolution is determined by the interaction volume's size, which is dependent on a number of different parameters, including the material's physical properties and instrument-related parameters like density, atomic number, accelerating voltage, and electron beam size [26, 27].
Besides, The EDX spectroscopy (BRUKER, Germany) was employed to identify the chemical elements of healthy human teeth and carious as well. Moreover, it shows the different between them and the concentration of each element that present in both type of teeth [28, 29]. The present manuscript was written based on the most prominent rules and instructions for writing discreet international researches [30-32].
The measurement in the present SEM system in Ministry of Science and Technology is achieved by the following steps:
(1) Apply high energy electrons as abeam of (11,200 eV)
(2) Formulation the image by select a large focused area based on an appropriate lenses and optical elements, the selected area is 8 nm to reach the depth of 0.85 µm
(3) Scanning the gun of the beam to all the surface of the teeth with difference magnification values (500, 200, 100, 50, 10, 5, and 1 µm) to obtain the information of healthy and carious teeth surface in details.
(4) Detect the response from the teeth by a detector of the system and from gathering these responses can formulate the corresponding image.
(5) Display the image in the desirable form with determination of intensity, resolution, and brightness of an image which indicate the surface information and details [33-35].
2.4 X-ray and imaging test
The entry of radiology and X-ray technology into the world of dentistry is a very important in classifying healthy and carious teeth, diagnosing different dental conditions and the position of the tooth. The present X-ray test applied in the dental radiography equipment in Al- Karkh General Hospital which is shown in Figure 5 for the previous healthy and carious teeth.
Figure 5. Dental radiography X-ray equipment (a) the overview of the system (b) central and X-ray controller (c) tube head and X-ray generator (d) dental X-ray unit specification
Electrochemical impedance spectroscopy has been shown to be a powerful approach for evaluating the electrical properties of dentine, but in order to yield relevant data, it requires thorough sample processing and experimental set-up. The average impedance and phase shift of two from the carious teeth are shown in Table 2.
Table 2. Impedance and phase shift values of carious teeth
|
Frequency Hz |
AVG Impedance of Tooth 1 Ω |
Phase shift of Tooth 1 |
AVG Impedance of Tooth 2 Ω |
Phase shift of Tooth 2 |
|
100 |
1.27E+5 |
-2.86 |
1.07E+5 |
-4.86 |
|
1.11E+6 |
1.05E+3 |
-75.22 |
1.08E+3 |
-78.61 |
|
2.22E+6 |
464.27 |
-76.32 |
7640.27 |
-78.94 |
|
3.33E+6 |
317.2 |
-76.77 |
6170.2 |
-82.82 |
|
4.44E+6 |
224.67 |
-75.9 |
4240.67 |
-84.30 |
|
5.56E+6 |
177.36 |
-76.59 |
4770.36 |
-85.03 |
|
6.67E+6 |
140.71 |
-76.21 |
3400.71 |
-85.20 |
|
7.78E+6 |
115.52 |
-77.13 |
1450.52 |
-85.20 |
|
8.89E+6 |
95.93 |
-78.27 |
1000.93 |
-85.03 |
|
1.00E+7 |
82.567 |
-79.04 |
970.56 |
-84.52 |
Figure 6. The real part of average impedance changes of carious teeth
Figure 7. Imaginary part of the average impedance changes of carious teeth
Figure 6 shows the real part of the average electrical impedance change of carious teeth. The results show that the impedance located in the range of (82.567 to 1.27E+05) Ω with increasing of the frequency for the range of (1.00E-02-1.00E+07) Hz, and decreasing in the phase shift of the tooth. Figure 7 shows an imaginary part of the average change of electrical impedance of the carious teeth which represent the measuring electrode of the bioelectric impedance meter of carious tooth for ten sub- jects by the relation between the phase shift angle of the teeth and the frequency of the meter. In the other hand, Table 3 shows the average impedance and phase shift of some of healthy teeth.
Table 3. Impedance and phase shift values of healthy teeth
|
Frequency Hz |
AVG Impedance of Tooth 3 Ω |
Phase Shift of Tooth 3 |
AVG Impedance of Tooth 4 Ω |
Phase Shift of Tooth 4 |
|
100 |
1.69E+6 |
-172.24 |
2.59E+6 |
-125.5 |
|
1.11E+6 |
1.95E+5 |
-71.44 |
3.27E+5 |
-68.62 |
|
2.22E+6 |
6.78E+4 |
-78.69 |
9.00E+4 |
-76.35 |
|
3.33E+6 |
5.09E+4 |
-83.25 |
7.11E+4 |
-81.58 |
|
4.44E+6 |
2.81E+4 |
-86.00 |
3.47E+4 |
-83.97 |
|
5.56E+6 |
1.61E+4 |
-86.48 |
1.88E+4 |
-84.61 |
|
6.67E+6 |
9.57E+3 |
-86.60 |
1.06E+4 |
-85.17 |
|
7.78E+6 |
5.85E+3 |
86.47 |
6.30E+3 |
-85.20 |
|
8.89E+6 |
3.63E+3 |
-86.02 |
3.83E+3 |
-85.02 |
Figure 8. The average impedance changes of healthy teeth for real part
Figure 9. The average impedance changes of healthy teeth for imaginary part
Figure 8 shows the real part of the healthy teeth. The results show the average impedance located in range of (3.63E+03 to 2.59E+06) Ω which are larger than the range of carious teeth. While the Figure 9 illustrates the imaginary part of the average impedance of the healthy teeth. With increasing the frequencies (1.00E-02-8.89E+06) Hz and decreasing in the phase shift.
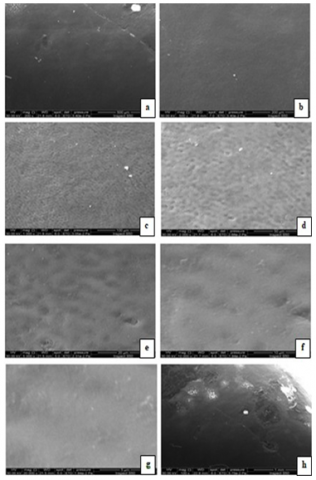
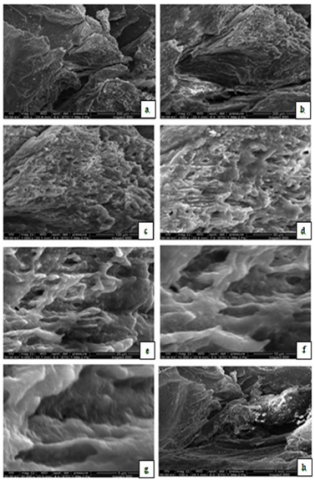
The SEM results of healthy tooth surface with different range of magnification (500 µm-5 µm) are shown in Figure 10 which clearly shows the surface morphology of healthy tooth were very smooth and there is no wrinkles and holes appear on the surface. In contrast the SEM results of carious tooth were shown in Figure 11. The SEM surface morphology of carious tooth at different magnification show the surface has numerous of holes, grooves, and wrinkles due to the carious of tooth.
The EDX analysis of tooth surface before and after carious are illustrated in Table 4 and Table 5, also shown in Figure 12, and Figure 13 respectively.
Figure 10. SEM image of healthy tooth at different magnification (a) at 500 µm, (b) at 200 µm, (c) at 100 µm, (d) at 50 µm, (e) at 20 µm, (f) at 10 µm (g) at 5 µm and (h) at 1 µm
Figure 11. SEM image of carious tooth at different magnification (a) at 500 µm, (b) at 200 µm, (c) at 100 µm, (d) at 50 µm, (e) at 20 µm, (f) at 10 µm (g) at 5 µm and (h) at 1 µm
Table 4. The measurement of the EDX test on the healthy teeth
|
El |
AN |
Series |
unn. C [wt.%] |
C norm. [wt.%] |
C Atom. [at.%] |
C Error (1 Sigma) [wt.%] |
|
Sb |
51 |
L-series |
72.91 |
54.22 |
21.38 |
2.39 |
|
Ca |
20 |
K-series |
30.00 |
22.31 |
26.73 |
1.07 |
|
P |
15 |
K-series |
22.09 |
16.42 |
25.46 |
1.05 |
|
C |
6 |
K-series |
8.59 |
6.39 |
25.53 |
4.16 |
|
Cl |
17 |
K-series |
0.89 |
0.66 |
0.90 |
0.12 |
Table 5. The measurement of the EDX test on the carious teeth
|
El |
AN |
Series |
unn. C [wt.%] |
C norm. [wt.%] |
C Atom. [at.%] |
C Error (1 Sigma) [wt.%] |
|
Sb |
51 |
L-series |
59.72 |
48.81 |
21.38 |
2.39 |
|
Ca |
20 |
K-series |
27.02 |
15.22 |
13.73 |
0.81 |
|
P |
15 |
K-series |
22.09 |
2.1 |
4.46 |
0.56 |
|
C |
6 |
K-series |
21.08 |
1.3 |
2.32 |
0.45 |
|
Cl |
17 |
K-series |
2.03 |
0.99 |
1.90 |
0.17 |
Figure 12. EDX spectrum of healthy tooth
Figure 13. EDX spectrum of carious tooth
In Figure 12, EDX of healthy tooth shows the concentrations of chemical elements, which contain 54.22% of Antimony (Sb), 22.31% of Calcium (Ca), 16.42% of Phosphorus (P), 6.39% of Carbon (C), and 0.66% of Chlorine (Cl) which confirm the chemical composition of tooth. In contrast, EDX analysis of carious tooth show in Figure 13, which contains 40.82% of Antimony (Sb), 16.27% of Calcium (Ca), 18.47% of Phosphorus (P), 15.23% of Carbon (C), 2.16% of Chlorine (Cl), 3.02% of Sodium (Na), 1.70% of Aluminum (Al), 1.39 of Magnesium (Mg), and 0.94% of Silicon (Si). In this case, the error can be determined by using the formula:
$\operatorname{Error}(\%)=\mp 3 \frac{\sigma}{N} \times 100=\mp 3 \frac{\sqrt{N}}{N} \times 100$ (1)
where, N is the X-ray counts number after background subtraction in the peak. Generally, the increasing N is, the decreasing the error in the EDX analysis. And $\sigma=\sqrt{N}$.
The X-ray imaging test for healthy and diseased teeth is a fast and painless way to get images of the tooth structure for diagnosing issues with the jaw, mouth, or teeth. For the simple reason that a visual examination can't always reveal issues like cavities, tumours, bone loss, or hidden dental structures like wisdom teeth; X-ray scans can. Different densities of materials absorb X-rays to varying degrees as they travel through the tooth. Bone and metal, both of which are dense, seem white on X-ray pictures. It looks like the air within the lungs is dark. Muscle and fat show up as different colours of grey. Any physical measurement worth its salt will always be an average.
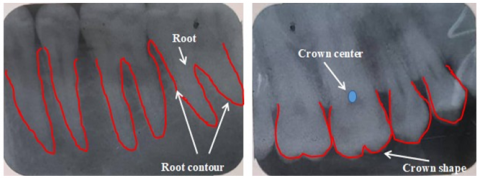
A few examples of the healthy teeth are shown in Figure 14. If a function f of one variable x describes the system's state, then the average of over a 2δ interval is:
$M_{\tilde{\delta}}(f)(x)=\frac{1}{2 \delta} \int_{x-\bar{\delta}}^{x+\bar{\delta}} f(y) d y$ (2)
Figure 14. The X-ray test of the healthy tooth
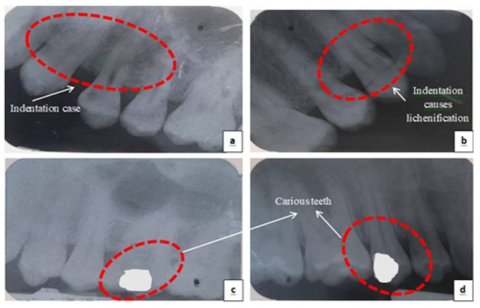
Figure15. The X-ray test of the carious tooth
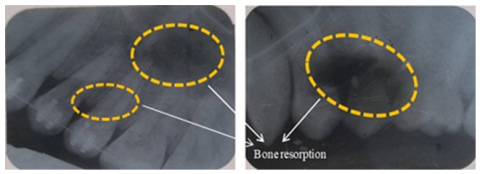
Figure 16. The X-ray test of the bone resorption
Tooth decay caused by acid produced by bacteria is known as carious teeth or dental caries. The buildup of bacterial debris and the subsequent development of caries are both caused by poor oral hygiene and the consumption of sugary foods and drinks. From yellow to black, there's a rainbow of possible cavity colours. Discomfort in eating and other related symptoms are possible. Tooth loss, inflammation of the tissues surrounding the tooth, infection, and abscess formation are all potential complications.
Figure 15 demonstrates different types of caries. In the subgraph (a) of Figure 15, The presence of spaces and indentation between the teeth, which leads to the accumulation of foods and the formation of bacteria that led to tooth decay and pain in the gums. For subgraph (b) of Figure 15, this tooth requires orthodontics or extraction because its indentation causes latensification in the adjacent tooth, pain in the gums, and erosion in the external texture, while the teeth in subgraph (c) of Figure 15 represent proximal caries mesial four and distal caries. Subgraph (d) of Figure 15 illustrates evidence of bone formation and bone resorption and change in periodontal with association.
In the other cases the X-ray test detect the bone resorption as in Figure 16 which demonstrates periodontics with lateral bone resorption caries on proximal surface of radiograph of mandibular teeth.
One of the most significant factor effects on the interpretation of the image and the diagnosis is the density of the teeth. Density is different in human teeth and according to the age, it is certain that in children it is less dense, and in adults it is a higher and constant amount, and sometimes there is a slight discrepancy according to the size of the tooth. What determines the dark and light colours is the duration of the X-ray radiation the present duration in this study is between 0.6-0.8 depending on the patient's circumstances or the condition of the tooth.
Also, another factor is the acidification period which is passing in three stages: Fixation, Cleaning, and Watering. Each stage has a specific time that is inversely proportional to the duration of the exposure that the film is exposed to it, that also gave us additional information about the reflection of rays from minerals such as the filling or orthodontic and the minerals of the tooth and the lack of its reflection in caries due to bacteria that feed on the ray-reflecting minerals.
This research consists of implementing a new method to diagnose the condition of teeth, whether they are healthy or decayed, through the use of electrical impedance, and it was compared with the traditional method through the use of a dental X-ray device.
The current system consists of available components, is easy to use, is low in cost, is safe for the patient, can be easily navigated, and its results are accurate through testing it on several patients and comparing it with other traditional methods, and by consulting a group of dentists. The discussion also clarified the reasons for using the frequency ranges shown in the research due to their effective effect on the teeth and the possibility of recording the response of the teeth and diagnosing their condition. This method was used because it is safe for the patient and radiation-free.
Applying other dental tests to obtain other conclusions. In the future, it is possible to increase the number of samples and apply different statistical methods. Packaging the device and trying to market it. Submitting an international patent using the current system.
In this work, the electrical impedance analyser was used to measure the impedance changes of different teeth with and without carious over a wide range of frequency, since the average electrical impedance change of healthy teeth is larger than the electrical impedance of the carious teeth with the increasing in the wide range of frequencies and decreasing of the phase shift of the tooth. Further investigations including measurements or simulations of dental tissues are expected to benefit from use of electrical impedance analyser.
The SEM test also used for studying and scanning the surface morphology and characteristics of teeth. The surface of healthy teeth was very smooth in contrast with the surface of carious teeth which show a number of holes and grooves. The EDX applied to test and analysed the teeth. The number of chemical elements that found in healthy tooth is lower than of element that found carious tooth. There are some common elements between healthy and carious teeth, such as antimony, calcium, phosphorous, carbon, and Chlorine. The antimony and calcium percentage in healthy teeth is larger than in carious teeth, while the percentage of phosphorous, carbon, and Chlorine is lower. In the carious teeth there are additional elements that are not found in healthy teeth such as, Sodium, Aluminium, Magnesium, and Silicon.
As for the X-ray images measurements which are taken for samples of the teeth, they are important to indicate the condition of the tooth and its position, whether it is healthy, carious or bone resorption. The discrepancy in the colour of the images is due to on the radiographs, the teeth appear in a lighter colour than the surrounding tissues due to their resistance to penetration of rays, and the presence of any cavities or carious in the teeth will appear in the images in a different dark colour due to the low density of that material.
As future work, we will increase the number of samples for different cases in order to apply advanced methods and statistics.
[1] Emran, S., Lappalainen, R., Kullaa, A.M., Myllymaa, S. (2018). Concentric ring probe for bioimpedance spectroscopic measurements: design and ex vivo feasibility testing on pork oral tissues. Sensors, 18(10): 3378. https://doi.org/10.3390/s18103378
[2] Pan, Y., Chen, Y., Chen, J., Ma, Q., Gong, T., Yu, S., Zhang, Q., Zou, J., Li, Y. (2021). The Adc regulon mediates zinc homeostasis in Streptococcus mutans. Molecular Oral Microbiology, 36(5): 278-290. https://doi.org/10.1111/omi.12350
[3] Lei, X., Wu, Z.F., Wang, Y., Wang, S., Shu, C., Duan, Z.H., Deng, S.L. (2021). High-throughput sequencing identifies salivary microbiota in Chinese caries-free preschool children with primary dentition. Journal of Zhejiang University - Science B, 22(4): 285-294. https://doi.org/10.1631%2Fjzus.B2000554
[4] Li, W., Matsuhisa, N., Liu, Z., Wang, M., Luo, Y., Cai, P., Chen, G., Zhang, F., Li, C., Liu, Z., Lv, Z., Zhang, W., Chen, X. (2021). An on-demand plant-based actuator created using conformable electrodes. Nature Electronics, 4(2): 134-142. https://doi.org/10.1038/s41928-020-00530-4
[5] Kim, H.J., Ho, J.S. (2022). Wireless interfaces for brain neurotechnologies. Philosophical Transactions of the Royal Society A, 380(2228): 20210020. https://doi.org/10.1098/rsta.2021.0020
[6] Bisquert, J. (2021). A frequency domain analysis of the excitability and bifurcations of the Fitzhugh-Nagumo neuron model. The Journal of Physical Chemistry Letters, 12(45): 11005-11013. https://doi.org/10.1021/acs.jpclett.1c03406
[7] Maithani, Y., Choudhuri, B., Mehta, B.R., Singh, J.P. (2021). Self-adhesive, stretchable, and dry silver nanorods embedded polydimethylsiloxane biopotential electrodes for electrocardiography. Sensors and Actuators A: Physical, 332: 113068. https://doi.org/10.1016/j.sna.2021.113068
[8] Gerasimenko, T., Nikulin, S., Zakharova, G., Poloznikov, A., Petrov, V., Baranova, A., Tonevitsky, A. (2020). Impedance spectroscopy as a tool for monitoring performance in 3D models of epithelial tissues. Frontiers in Bioengineering and Biotechnology, 7: 474. https://doi.org/10.3389/fbioe.2019.00474
[9] Cheng, Z., Schwaner, K.L., Dall’Alba, D., Fiorini, P., Savarimuthu, T.R. (2021). An electrical bioimpedance scanning system for subsurface tissue detection in robot assisted minimally invasive surgery. IEEE Transactions on Biomedical Engineering, 69(1): 209-219. https://doi.org/10.1109/TBME.2021.3091326
[10] Śmietana, M., Koba, M., Sezemsky, P., Szot-Karpińska, K., Burnat, D., Stranak, V., Niedziółka-Jönsson, J., Bogdanowicz, R. (2020). Simultaneous optical and electrochemical label-free biosensing with ITO-coated lossy-mode resonance sensor. Biosensors and Bioelectronics, 154: 112050. https://doi.org/10.1016/j.bios.2020.112050
[11] Dung, B.X. (2021). Human issues in the philosophical thought of Ho Chi Minh. Review of International Geographical Education Online, 11(4): 1440-1452.
[12] Paschoini, V.L., Ziotti, I.R., Neri, C.R., Corona, S.A.M., Souza-Gabriel, A.E. (2021). Chitosan improves the durability of resin-dentin interface with etch-and-rinse or self-etch adhesive systems. Journal of Applied Oral Science, 29: e20210356. https://doi.org/10.1590/1678-7757-2021-0356
[13] Deniz, Y., Aktaş, Ç., Misilli, T., Çarıkçıoğlu, B. (2021). Effects of radiotherapeutic X-ray irradiation on cervical enamel. International Journal of Radiation Biology, 97(12): 1667-1674. https://doi.org/10.1080/09553002.2021.1987560
[14] Lackovic, I., Stare, Z. (2007). Low-frequency dielectric properties of the oral mucosa. In 13th International Conference on Electrical Bioimpedance and the 8th Conference on Electrical Impedance Tomography: ICEBI 2007, Graz, Austria. Berlin, pp. 154-157. https://doi.org/10.1007/978-3-540-73841-1_42
[15] Pathiraja, A.A., Weerakkody, R.A., von Roon, A.C., Ziprin, P., Bayford, R. (2020). The clinical application of electrical impedance technology in the detection of malignant neoplasms: A systematic review. Journal of Translational Medicine, 18: 1-11. https://doi.org/10.1186/s12967-020-02395-9
[16] Tatullo, M., Marrelli, M., Amantea, M., Paduano, F., Santacroce, L., Gentile, S., Scacco, S. (2015). Bioimpedance detection of oral lichen planus used as preneoplastic model. Journal of Cancer, 6(10): 976. https://doi.org/10.7150%2Fjca.11936
[17] Saleh, Z.S., Al-Neami, A.Q., Raad, H.K. (2021). Pressure ulcer prediction, prevention and assessment using biomedical system design. In 2021 IEEE International Biomedical Instrumentation and Technology Conference (IBITeC), Yogyakarta, Indonesia, pp. 104-108. https://doi.org/10.1109/IBITeC53045.2021.9649071
[18] Abdullah, A.D.A., Al-Neami, A.Q. (2021). Performance evaluation of a new dry-contact electrode for EEG measurement. In 2021 IEEE International Biomedical Instrumentation and Technology Conference (IBITeC), Yogyakarta, Indonesia, pp. 119-123. https://doi.org/10.1109/IBITeC53045.2021.9649333
[19] Saleh, Z.S., Al-Neami, A.Q., Raad, H.K. (2021). Smart monitoring pad for prediction of pressure ulcers with an automatically activated integrated electro-therapy system. Designs, 5(3): 47. https://doi.org/10.3390/designs5030047
[20] Alneami, A.Q., Khalil, E.G., Mohsien, R.A., Albeldawi, A.F. (2018). Effect of electrical current stimulation on pseudomonas aeruginosa growth. Journal of Physics: Conference Series, 1003(1): 012112. https://doi.org/10.1088/1742-6596/1003/1/012112
[21] Abdullah, A.D.A., Al-Neami. A.Q. (2021). Performance evaluation of a new 3D printed dry-contact electrode for EEG signals measurement. Indonesian Journal of Electrical Engineering and Computer Science, 24(1). https://doi.org/10.11591/ijeecs.v24.i1.pp287-294
[22] Gong, L., Petchakup, C., Shi, P., Tan, P.L., Tan, L.P., Tay, C.Y., Hou, H.W. (2021). Direct and label‐free cell status monitoring of spheroids and microcarriers using microfluidic impedance cytometry. Small, 17(21): 2007500. https://doi.org/10.1002/smll.202007500
[23] Goh, G.L., Tay, M.F., Lee, J.M., Ho, J.S., Sim, L.N., Yeong, W.Y., Chong, T.H. (2021). Potential of printed electrodes for electrochemical impedance spectroscopy (EIS): Toward membrane fouling detection. Advanced Electronic Materials, 7(10): 2100043. https://doi.org/10.1002/aelm.202100043
[24] Held, M., Schwaller, P., Vaihinger, M., Denkel, C. (2017). Local impedance spectroscopy: A potential tool to characterize the evolution of emulsions and foams. Journal of Food Science and Engineering, 7(5): 249-261. http://doi.org/10.17265/2159-5828/2017.05.003
[25] Söldner, C.A., Socher, E., Jamali, V., Wicke, W., Ahmadzadeh, A., Breitinger, H.G., Burkovski, A., Castiglione, K., Schober, R., Sticht, H. (2020). A survey of biological building blocks for synthetic molecular communication systems. IEEE Communications Surveys & Tutorials, 22(4): 2765-2800. https://doi.org/10.1109/COMST.2020.3008819
[26] Abbas, A., Khleif, A.A. (2023). The influence of angled electrodes on various characteristics in EDM process-review article. Tikrit Journal of Engineering Sciences, 30(2): 1-9. http://doi.org/10.25130/tjes.30.2.1
[27] Berg, C., Unosson, E., Riekehr, L., Xia, W., Engqvist, H. (2020). Electron microscopy evaluation of mineralization on peritubular dentin with amorphous calcium magnesium phosphate microspheres. Ceramics International, 46(11): 19469-19475. https://doi.org/10.1016/j.ceramint.2020.04.295
[28] Salih, A.A., Al-Neami, A.Q. (2015). Design and implementation of medical system for measuring glottal activity (Electroglottography). International Journal of Biological Engineering, 5: 1-10. https://doi.org/10.5923/j.ijbe.20150501.01
[29] Noy, A.F., Zilberman, U., Regev, N., Moskovitz, M. (2020). Drinking desalinated water that lack calcium and magnesium has no effect on mineral content of enamel and dentin in primary teeth. Journal of Clinical Pediatric Dentistry, 44(1): 47-51. https://doi.org/10.17796/1053-4625-44.1.8
[30] Orilisi, G., Monterubbianesi, R., Notarstefano, V., Tosco, V., Vitiello, F., Giuliani, G., Putignano, A., Orsini, G. (2021). New insights from Raman MicroSpectroscopy and scanning electron microscopy on the microstructure and chemical composition of vestibular and lingual surfaces in permanent and deciduous human teeth. Spectrochimica Acta Part A: Molecular and Biomolecular Spectroscopy, 260: 119966. https://doi.org/10.1016/j.saa.2021.119966
[31] Llena, C., Esteve, I., Forner, L. (2018). Effects of in-office bleaching on human enamel and dentin. Morphological and mineral changes. Annals of Anatomy-Anatomischer Anzeiger, 217: 97-102. https://doi.org/10.1016/j.aanat.2018.01.003
[32] Hasan, J.A., Bachache, L.N., Al-Neami, A.Q. (2021). Noninvasive glucose sensing system based on modified SPO2 sensor. In AIP Conference Proceedings. AIP Publishing, 2372(1). https://doi.org/10.1063/5.0065363
[33] Azhar, S., Alneami, A.Q., Alzubeidy, H.H. (2023). A novel technique for intra-aortic balloon catheter tip localization based on sensing system design. In AIP Conference Proceedings. AIP Publishing, 2839(1). https://doi.org/10.1063/5.0171076
[34] Abd-ul-Amir, D.Q., Hashim, A.Q., Ameer, A.H. (2019). Design and implement an exoskeleton arm for reinforcement the human muscles after stroke. Al-Nahrain Journal for Engineering Sciences, 22(4): 252-258. http://doi.org/10.29194/NJES.22040252
[35] Shukur, E.A., Al-Neami, A.Q., Mohsin, F.Y. (2023). Advanced sensor-based cap cooling system for mitigating chemotherapy-induced hair loss. Instrumentation Mesure Métrologie, 22(5): 193-200 https://doi.org/10.18280/i2m.220502