Shyam T. Venkatesulu*![]() | Archana Sharma | Vaibhav H. Patankar | Ankur Kaushik | Abhishek Basak | Sunil K. Sinha
| Archana Sharma | Vaibhav H. Patankar | Ankur Kaushik | Abhishek Basak | Sunil K. Sinha
© 2024 The authors. This article is published by IIETA and is licensed under the CC BY 4.0 license (http://creativecommons.org/licenses/by/4.0/).
OPEN ACCESS
Due to limited space constraints, the creep measurement of test specimens in material testing reactors is done mostly by time consuming offline techniques viz.: air gauges, diameter gauges, etc. A new compact sensor based on pulsed eddy current testing technique is designed for online creep measurement during mechanical properties testing of metallic alloy specimens for future nuclear reactors. The pulsed eddy current sensors that are positioned opposite to the test specimen measure gaps to estimate creep, by analyzing the slopes of the signals near the Lift-off point of Intersection (LOI) region. The paper discusses the temporal shifts in pulsed eddy current signals when operated at room and high temperatures. Experiments were carried out at room temperature to study the effect of geometry change on test specimens on the linearity and sensitivity of the signals. Similarly, the effect of magnetic test specimens on measurement methodology and sensitivity is also briefed. The results of the study have provided us with confidence in using the online creep measurement sensor technology in material testing reactors with a molten metal coolant medium environment. This technology will help us evaluate the mechanical properties of metallic alloy test specimens, which are intended for use in future generation nuclear reactors.
Lift-off point of Intersection, pulsed eddy current testing, creep, metallic alloys, high-temperature operation, future generation nuclear reactors
It is essential to test exotic metallic alloys before deploying them as structural materials in future-generation nuclear reactors to ensure their safety and reliability. Material testing reactors (MTR) are utilized to expedite material testing under hostile nuclear reactor conditions. When materials are subjected to high stress, temperature, and radiation, they undergo creep, which causes an expansion in both axial and radial dimensions. It is essential to assess this parameter to determine the suitability of potential materials for future generation reactors in the future. Measuring the creep of test specimens [1-3] in material testing reactors is a difficult task due to limited space and hostile conditions like high temperature and nuclear irradiation. Offline creep measurement techniques are mostly deployed in material testing reactors, which are time-consuming as the reactor has to be shut down while carrying out measurements. The available options for measuring things online are currently limited to techniques based on electromagnetic testing. The pulsed eddy testing technique, as described in references [4-7], has been chosen for the measurement due to its ability to induce higher eddy current density and resolve surface and in-depth features by selecting appropriate time zones from the acquired pulsed eddy current (PEC) signals. The pulsed eddy current testing technique uses pulsed current excitation in the sending coil to generate pulsed electromagnetic energy that bombards the test specimen. The higher frequency components attenuate near the surface of the specimen, whereas lower frequency components percolate deeper into the specimen. The reflected energies from the test specimen induce voltage in the receive coil, carrying rich information. Lift-off is termed as the gap between the PEC sensor face and the test specimen. The signal traces obtained from pulsed eddy current testing for different Lift-off settings intersect at the Lift-off point of Intersection (LOI). The proposed scheme for the measurement of creep of the test specimen, kept in a molten metal medium, is to be carried out by placing two pulsed eddy current probes diametrically opposite to the test specimen [8, 9]. The schematic depicting the concept of measurement is shown in Figure 1.
This paper presents an experimental study characterizing the impact of operating temperature on PEC signals. The research aims to assist in the calibration of signals when operating in high-temperature environments. Further study was carried out to analyze the behaviour of Lift-off point of Intersection and evolve a methodology for creep measurement while using ferromagnetic type test specimens. The paper describes how the shape of test specimens have a bearing on the signal features of PEC sensor.
Figure 1. Sketch depicting the concept for the proposed scheme for the measurement of creep of the test specimen
The bi-axial creep measurement needs to be conducted in a challenging environment where space is limited. To accomplish this, advanced electromagnetic techniques, such as the pulsed eddy current technique, are required. This method increases the eddy current density on the test specimen and is also a broadband technique. The higher current density results in better measurement sensitivity, especially when the sensor coils are canned with metallic enclosures [9]. The broadband spectrum of frequencies in the response signal encodes rich information about the test specimen features. For actual creep measurement, it is proposed to use two sensors diametrically opposite to the cylindrically shaped specimen submerged in the molten metal medium. By measuring the gaps for two PEC sensors between the PEC sensor face and the test specimen, it would be possible to derive the change in diameter (radial creep) of the test specimen. Since the said gaps are filled with molten metal medium, it makes measurement a formidable task due to the high temperature and corrosive medium. The PEC sensor comprises a set of send coil and receive coil wound concentrically over a bobbin former [9]. The PEC sensor is to be protected by metallic enclosures, but this impedes the magnetic flux densities emerging from the send coil of the sensor and linking with the test specimen. One of the critical issues in sensor design is to make the probe size small enough to fit within a 6mm annular gap of the MTR test setup. This requires optimizing and reducing the number of turns in both the send coil and the receive coil through electromagnetic modeling. To ensure the sensor's protection in a Sodium potassium-type environment, it needs to be encapsulated with SS316 enclosures. This can hamper the sensitivity of the measurement due to the inherent Lift-off contributed by the enclosure thickness. To generate a pulsed magnetic field, a send coil is excited by a current pulse that has a rectangular shape. The magnetic flux density arising from the send coil, having a broad spectrum of frequencies [10, 11], couples with the test specimen and induces eddy currents [12, 13]. The eddy currents generate opposing magnetic flux density—the resultant magnetic flux density couples back to the receive coil, resulting in pick-up voltages. Figure 2 depicts the principle of the pulsed eddy current testing technique. Generally, pulsed eddy current signals are analysed for many signal features like peak amplitude, peak arrival time, zero crossing time etc. The LOI-based methodology [8, 14-17] estimates the signal slopes near the Lift-off point of Intersection (LOI) and correlates them to the gap between the sensor face and the test specimen. The LOI-based methodology is preferred over other signal features such as peak amplitude, peak arrival time, and zero crossing time because it is largely immune to changes in electrical conductivity [14]. The canned PEC sensors were fabricated and tested at room temperature with varying gaps using stacks of thin SS foils.
Figure 2. Schematic depicting the principle of pulsed eddy current testing sensor
An experimental study was conducted to analyze the signal features of the sensor at high temperatures. To evaluate the performance of the canned pulsed eddy current probe with varying shim stack thickness on SS 304 test specimen, experiments were carried in a Miniature furnace with controlled temperature provision. The experiment used stacks of SS 304 shims, with each shim having a thickness of approximately 50 microns, to simulate varying gaps between the test specimen and the sensor face in a molten metal medium. The small variation in furnace temperature, only a few degrees Celsius, results in an insignificant change in electrical conductivity. This is unlikely to cause any significant bias in the measurements.
Figure 3. Schematic of the high temperature testing setup for canned PEC probe with varying shim stack thickness on SS 304 test specimen
A canned pulsed eddy current probe was fabricated with high temperature winding wire that is serviceable up to 225℃. The canning enclosure was fabricated with SS304 alloy. The winding former was fabricated out of Teflon. The probe and test specimen SS304 were fastened with Teflon clamps and sand witched with stack of SS shim foils placed between probe face and test specimen to simulate the molten metal coolant medium. The furnace was given inert Argon gas environment. The schematic of the high temperature testing setup for canned PEC probe is shown in Figure 3. The furnace temperature was controlled with PID controller driving a single-phase SCR drive connected to heater coils within an accuracy of +/- 2℃ The furnace housed a borosilicate dome in the centre of the furnace where test specimens and canned PEC probes were bottom loaded for experimental study. Initially, the furnace was evaluated for its temperature control performance while it was empty.
First, the test specimen and sample were loaded into the centre chamber crucible. SS 304 sheathed K-type thermocouples were connected to the test specimen and the other ends were hooked to a PID controller and an external temperature indicator. The PID set point temperature was at 150℃. The furnace was operated up to 150℃.
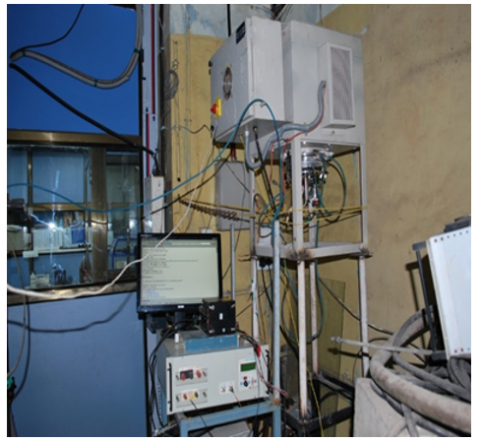
The picture of high temperature experimental test setup for canned PEC probe testing is shown in Figures 4 and 5. The pictures of canned PEC probe with test specimen and sand witched SS 304 shims are shown in Figures 6 and 7. Suitable data acquisition code was devised to run the data acquisition system in PXI system.
Figure 4. Picture of a full view of high temperature experimental test setup for canned PEC probe testing
Figure 5. Picture of a different perspective view of high temperature experimental test setup for canned PEC probe testing
Figure 6. Picture of canned PEC probe with test specimen and sand witched SS shims in crucible
Figure 7. Different perspective view of canned PEC probe with test specimen and sand witched SS shims in crucible
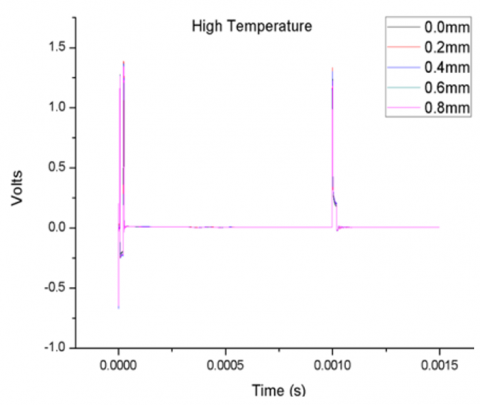
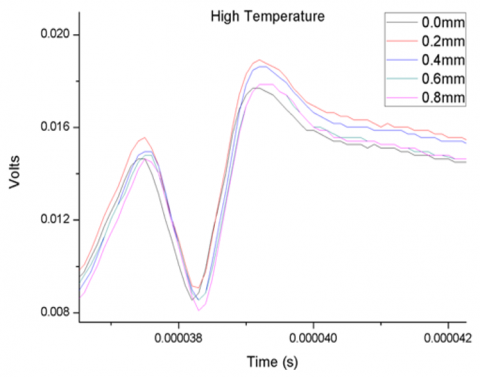
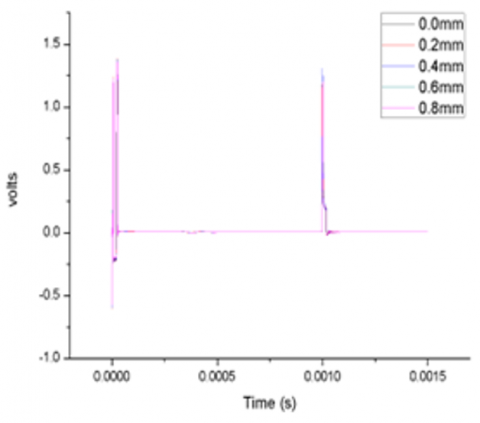
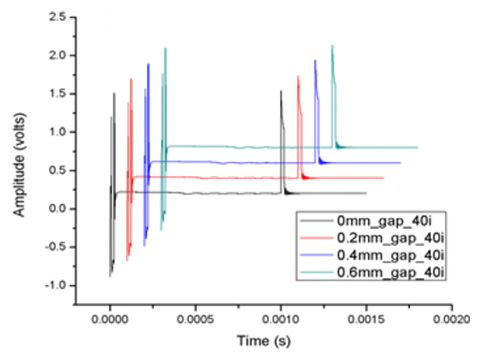
Experimental tests were carried out on a canned PEC probe to assess its performance in different temperature environments. The probe was excited with pulsed current at both room temperature and high temperatures. The tests involved varying the SS 304 medium between the canned PEC probe and the test specimen. For the experiment, SS 304 foils with a foil thickness of around 50 microns were used to maintain the required distance between the PEC probe and test specimen. The current setting was set for 1 ampere. The pulsed eddy signals were sampled for 15,000 samples at a sampling rate of 107 Hz. The acquired PEC signals for excitation 1 ampere with varying SS 304 medium between the canned PEC probe and the test specimen at high temperature conditions is shown in Figure 8. The pulse width was for 1 millisecond and pulse repetition rate was 1 Hz. The sensor signals were acquired by Adlink make PXI based High speed Data acquisition system mounted with PXI 9816 Data acquisition card. MATLAB® code was devised to configure the Data acquisition system for acquiring signals at specified sampling rate and number of samples. The PointR technology make current pulser model no. ACP500X30 generated external triggers in sync with the leading edges of exciting current pulses, to initiate the acquisition. The signals were acquired for 2,000 signal traces and dynamically median signals were derived. The median signals for different SS 304 medium gaps were plotted with MicroCal Origin software. The slopes were derived from the fit coefficients obtained through linear fitting. The slopes were derived in the vicinity of Lift-off point of Intersection, as these zones were sensitive to slope versus lift off and at the same time largely insensitive to electrical conductivity variation. The zoomed view of the acquired PEC signals is shown in Figure 9. The zoomed view of acquired PEC signals for excitation 1 ampere with varying SS medium between the canned PEC probe and the test specimen at room temperature conditions is shown in Figure 10.
Figure 8. PEC signals for excitation 1 ampere with varying SS medium between the canned PEC probe and the test specimen at high temperature conditions
Figure 9. Zoomed view of PEC signals for excitation 1 ampere with varying SS medium between the canned PEC probe and the test specimen at high temperature conditions
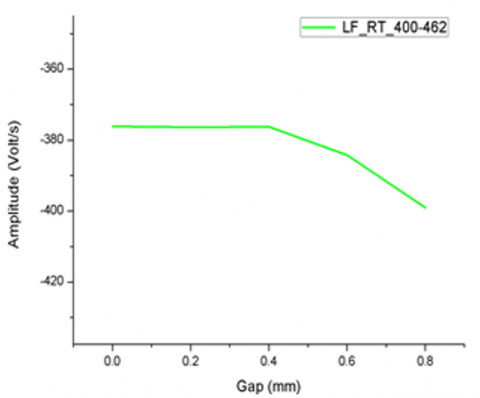
Linear curve fitting was carried out for signals obtained in high-temperature experiments with time samples from the range of 400 to 462 corresponding to 40.0 microsecond and 46.2 microsecond, respectively. The slopes were derived and plotted versus varying SS medium between the canned PEC probe and the test specimen at high temperature conditions. The slope characteristic is shown in Figure 11.
Linear curve fitting was carried out for signals obtained in room temperature experiments with time samples from range 400 to 462 corresponding to 40.0 microsecond and 46.2 microsecond respectively. The slopes were derived and plotted versus varying SS medium between the canned PEC probe and the test specimen at room temperature conditions. The slope characteristic is shown in Figure 12.
Figure 10. Zoomed view of PEC signals for excitation 1 ampere with varying SS medium between the canned PEC probe and the test specimen at room temperature conditions
Figure 11. The slope characteristics of linear fitting of signals from range 40.0 micro second and 46.2 micro second of PEC signals for excitation 1 ampere with varying SS medium between the canned PEC probe and the test specimen at high temperature conditions
Figure 12. The slope characteristics of linear fitting of signals from range 40.0 micro second and 46.2 micro second of PEC signals for excitation 1 ampere with varying SS medium between the canned PEC probe and the test specimen at room temperature conditions
Observations and discussion: It is noted that slopes are more distinct in the falling zone of signals viz.; for time samples from range 400 to 462 corresponding to 40.0 microsecond and 46.2 microsecond, respectively. Good sensitivity for measurement is observed in high temperature zones, while the sensitivity of measurements is reduced in room temperature conditions. It may be noted that velocity of propagation of eddy current density [18] in the test specimen can be given by the expression in Eq. (1).
$v_z=\frac{2}{\sqrt{\pi \mu \sigma t}}$ (1)
where ‘vz’ denotes the downward velocity of eddy current density, ‘µ’ is magnetic permeability of the test specimen, ‘σ’ is electrical conductivity of the test specimen and ‘t’ is the time of propagation. This implies that when electrical conductivity reduces due to high temperature, the downward velocity increases. The transient PEC signal trace is the capture of this eddy current density in the test specimen. So, it can be clearly seen the temporal shift to left side of the order of 100 nano second in signal traces obtained at high temperature condition to left side compared to that of signal traces obtained in case of room temperature conditions. This can be attributed to the change in slope due to a small temporal shift in the waveforms, caused by a change in electrical conductivity in relation to temperature.
To evaluate the performance of the canned PEC probe with different shapes of the specimen, experiments were carried out in an experimental set-up on a canned PEC probe with pulsed excitation current excitation at room temperature conditions at 25℃ for varying air medium between the canned PEC probe and the test specimen. Performance variation was observed between the flat-shaped specimens that could fit into larger lattice locations of MTR, and the cylindrical-shaped specimens that could fit into smaller lattice locations of MTR. For simulating air medium, stacks of cut paper sheets were placed between the sensor face and test specimen. The paper sheets behave similar to air medium for the low frequency operation regime of the pulsed eddy current testing setup. Paper sheets facilitate evaluating and demonstrating a sensor's capability in an air medium. It was difficult to bend the SS 304 medium over the curved surface of the test specimen. By evaluating the sensor's performance in air, it is possible to judge its performance in SS 304 medium to a large extent [12]. The experiment aimed to assess how the shape of the specimen affects sensitivity and linearity of sensor performance. Two types of test specimen were used a). Flat specimen b). Cylindrical sleeve (having 10mm OD and 9mm ID) shaped specimen both having 0.5mm wall thickness. The specimens were selected to have a thickness of 0.5mm, considering the thickness of internally pressurized capsule-shaped test specimens to be used in MTR. The cylindrical sleeve specimen is shown in Figure 13. Stacks of cut paper sheets (sliced from the same sheet) 65-micron thickness were used for the experiment to maintain different air/paper mediums between the PEC probe and test specimen. The measurement methodology involved correlating the slopes of PEC signals in the vicinity of LOI. This method was selected because Lift-off measurement would be largely immune to electrical conductivity changes due to temperature variation. The current setting was set for 1 ampere. The pulsed eddy signals were sampled for 15,000 samples at sampling rate of 107 Hz. The signals were acquired for 2,000 signal traces and dynamically median signals were derived. The median signals obtained for different gap medium were plotted with MicroCal Origin software. The slopes were calculated by obtaining the polynomial coefficients through linear fitting. The slopes around the Lift-off point of Intersection were derived, as these areas were sensitive to slope versus lift off and relatively insensitive to electrical conductivity variation. The acquired PEC signals for excitation 1 ampere with varying air/paper medium between the canned PEC probe and the cylindrical test specimen at room temperature conditions is shown in Figure 14. The pulse width was 1 millisecond, and the pulse repetition rate was 1 Hz. The zoomed view of the acquired PEC signals is shown in Figure 15.
Figure 13. Picture of cylindrical specimen along with PEC sensor
Figure 14. PEC signals for excitation 1 ampere with varying air/paper medium between the canned PEC probe and the cylindrical test specimen at room temperature conditions
Figure 15. PEC signals for excitation 1 ampere with varying air/paper medium between the canned PEC probe and the cylindrical test specimen at room temperature conditions
In the case of cylindrical specimens, linear curve fitting was carried out for time samples ranging from 386 to 389, corresponding to 38.6 microseconds and 38.9 microseconds, respectively. The slopes were derived and plotted versus varying air medium between the canned PEC probe and the cylindrical shaped test specimen. The slope characteristic is shown in Figure 16.
Figure 16. The slope characteristics of linear fitting of signals from range 38.6 micro second and 38.9 micro second of PEC signals for excitation1 ampere with varying air medium between the canned PEC probe and the cylindrical test specimen at room temperature conditions
In case of flat shaped specimen linear curve fitting were carried out for time samples from range 386 to 389 corresponding to 38.6 micro second and 38.9 microsecond respectively. The slopes were derived and plotted versus varying air medium between the canned PEC probe and the flat shaped test specimen. The slope characteristic is shown in Figure 17.
Figure 17. The slope characteristics of linear fitting of signals from range 38.6 micro second and 38.9 micro second of PEC signals for excitation 1 ampere with varying air medium between the canned PEC probe and the flat test specimen at room temperature conditions
Observations and discussion: The experiments give more insight into the performance of PEC sensors for different shapes of test specimens. It is seen from the observations that in the case of a cylindrical sleeve-shaped specimen, the non-linearity is less compared to that of a flat-shaped specimen. At zero gap medium conditions, the probe face only contacts the test specimen along a single line. The opposition flux due to surface eddy current density [19] on the test specimen does not have a dominant effect on the induced voltage of the receive coil. However, flat-shaped specimen exhibits higher sensitivity. When there is no gap medium between the test specimen and probe face, significant non-linearity is observed near the zero-gap medium. The dominant effect of opposition flux due to the higher eddy current density of the surface of the flat specimen at zero gap position induces larger non-linearity in the case of the flat-shaped test specimen. The sensor face will have a wider surface in contact with the test specimen, leading to inducing higher eddy current density in the test specimen. This account is for a higher sensitivity of the PEC sensor when used with flat specimens. It may be noted in the above cases that the non-linearity happens only in case of contact of the sensor with the test specimen. To ensure the linear behavior of the sensor, it is necessary to provide a design offset on the casing to avoid contact with the test specimen. In cylindrical test specimen the effect of non-linearity is subdued due to less opposition flux linked back to the probe.
It is reported in literature about nonexistence of Lift-off point of Intersection in case of ferromagnetic test specimen with varying air medium between test specimen and probe face. To further study the Lift-off point of Intersection characterization for ferromagnetic test specimens with varying metallic medium, experiments were carried out with varying thickness of SS 304 medium between the PEC probe and the test specimen at room temperature conditions at 25℃. SS 304 foils of around 50-micron thickness were used for the experiment for maintaining required thickness of SS 304 medium between the PEC probe and test specimen. Mild steel ferromagnetic test specimen of Grade A36 (having composition 0.25% Carbon, 0.2% Copper, 98% Iron, 1.03% Manganese, 0.04% Phosphorus, 0.28% Silicon, 0.05% Sulphur) was chosen for carrying out the experimental study.
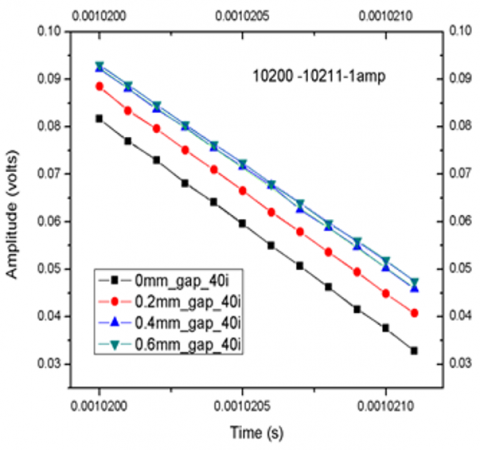
Figure 18 shows the picture of canned PEC probe on the ferromagnetic test specimen. The current setting was set for 1 ampere. The pulsed eddy signals were sampled for 15000 samples at sampling rate of 107 Hz. The pulse width was for 1 millisecond and pulse repetition rate was 1 Hz. The signals were acquired by Adlink make PXI based High speed Data acquisition system with PXI 9816 Data acquisition card. MATLAB® code was devised to configure the Data acquisition system for acquiring signals at specified sampling rate and number of samples. The current pulser model no. ACP500X30 generated external triggers in sync with the leading edges of exciting current pulses, to initiate the acquisition. The signals were acquired for 2,000 signal traces and dynamically median signals were derived. The median signals were plotted with MicroCal Origin software. The signals were visually observed for the conspicuous variation with SS 304 gap medium. The signals were acquired for different thickness of SS 304 shim stack from 0mm to 0.6mm are shown in Figure 19. Linear curve fitting as shown in Figure 20, were carried out for time samples from range 10,200 to 10,211 corresponding to 1.02 milli second and 1.0211 milli second respectively. The slope characteristics are shown in Figure 21. The slope sensitivity was found to be sufficiently high.
Figure 18. PEC sensor testing on a ferromagnetic test specimen
Figure 19. PEC sensor raw signals for testing ferromagnetic specimen for varying thickness of SS shim stacks
Figure 20. Linear fitting of PEC signals obtained from the time range of 10200 to 10211 for testing a ferromagnetic specimen with varying thickness of SS shim stacks
Figure 21. Slope characteristics of PEC sensor signals obtained during testing of a ferromagnetic specimen with varying thicknesses of SS shim stacks
Measurement units and numbers: In sync with the trailing edge of the current excitation pulse, a significant separation of signals was observed during the transient part of the signal. The signals were separated according to variations in the gap medium made of SS 304. It was not observed that LOI type phenomenon occurred in non-ferromagnetic test specimens, as it had been previously. The signals showed wide separation from the baseline level with no mutual intersections above it. To evolve a new methodology, this section of the signal trace was analyzed for slope with respect to variations in the gap medium of SS 304. The slopes were derived from the fit polynomial coefficients obtained through linear fitting. It is noticed that a sensitive zone is found in that part of a signal where its instant corresponds to the trailing edge of the current pulse. The PEC sensor showed 375 times higher sensitivity in the ferromagnetic test specimen than in the SS 304 test specimen at room temperature conditions. The fact has been supported by Table 1. Further, it may be noted the experiments were carried out at room temperature conditions of 25℃. A test specimen made of ferromagnetic material is prone to changes in its magnetic permeability as the temperature varies. So, in practice calibration has to be carried out at prescribed test temperature of specimen. It is generally understood that the slope parameter [20] is more immune to changes due to undesired eddy current-sensitive parameters, compared to the peak amplitude parameter.
Table 1. Comparison of sensitivity for ferromagnetic and non-ferromagnetic test specimens
|
Parameter |
Ferro Magnetic Test Specimen: A36 Grade Mild Steel |
Non Ferro Magnetic Test Specimen: SS304 |
|
slope change for 0.6mm gap medium change |
3000 V/s |
8 V/s |
|
slope change for 1mm gap medium change |
5000 V/s |
13.33 V/s |
|
Ratio of slope change for Ferromagnetic test specimen to that of non-ferromagnetic test specimen |
375 |
|
A pulsed eddy current-based creep measurement sensor has been developed meant to test exotic metallic alloys in material testing reactors before deploying them in future-generation nuclear reactors. This online measurement technique is unique due to the sensor's compact size, allowing it to be deployed in constrained spaces in material testing reactors. Currently, time-consuming offline measurement methods such as air gauges and diameter gauges are being utilized. This innovative measurement technique, based on the pulsed eddy current technique, considers the broadband nature of the signal. This facilitates Lift-off measurement by estimating the slope in the vicinity of the point of intersection. This testing methodology relies on correlating the slope change of the signals in the Lift-off point of Intersection region with respect to the gap change between the test specimen and probe face. The slope sensitivity with respect to one-millimetre SS304 gap medium change on SS 304 test specimen is around 13.33 Volts/s. The PEC sensor signals have been characterised at high and room temperatures. The PEC signals have shown a temporal shift of approximately 100 nanoseconds in relation to the rise in operating temperature. Better sensitivity is observed in higher-temperature operations. This can be attributed to a change in the electrical conductivity of the test specimen. This would alter the propagation velocity of the eddy current distribution. The shape of the test specimen has an effect on the PEC signals. The signals for the flat-shaped specimen have shown better creep measurement sensitivity than that for the cylindrical test specimen. This is because the sensor has more flux linkages with the flat test specimen. Signals have been characterised with ferromagnetic specimens with metallic gap medium. The sensitivity of the slope to a change of one millimetre in the SS 304 gap medium on the AS36 mild steel test specimen is about 5,000 Volts/s, which is 375 times more when compared with that of non-ferromagnetic test specimens. In future experiments are planned to operate at around 450℃ for gauge the sensor performance.
[1] Ibrahim, E.F., Winegar, J.E. (1973). Development of an air gauge for measuring in-reactor creep of tubular specimens. Journal of Physics E: Scientific Instruments, 6(9): 884-888. https://doi.org/10.1088/0022-3735/6/9/024
[2] Masson, M., Warlop, R., Bisogni, E., Halbwachs, M. (1975). In situ devices for the measurement of anelastic effects under neutron irradiation. Review of Scientific Instruments, 46(12): 1685-1688. https://doi.org/10.1063/1.1134140
[3] Knudson, D.L., Rempe, J.L. (2012). Linear variable differential transformer (LVDT)-based elongation measurements in Advanced Test Reactor high temperature irradiation testing. Measurement Science and Technology, 23(2): 025604. https://doi.org/10.1088/0957-0233/23/2/025604
[4] Xie, S., Zhang, L., Zhao, Y., Wang, X., Kong, Y., Ma, Q., Chen, Z., Uchimoto, T., Takagi, T. (2020). Features extraction and discussion in a novel frequency-band selecting pulsed eddy current testing method for the detection of a certain depth range of defects. NDT&E International, 111: 102211. https://doi.org/10.1016/j.ndteint.2019.102211
[5] Sophian, A., Tian, G., Fan, M. (2017). Pulsed eddy current non-destructive testing and evaluation: A review. Chinese Journal of Mechanical Engineering, 30: 500-514. https://doi.org/10.1007/s10033-017-0122-4
[6] Plotnikov, Y.A., Nath, S.C., Rose, C.W. (2002). Defect characterization in multi-layered conductive components with pulsed eddy current. AIP Conference Proceedings, 615(1): 1976-1983. https://doi.org/10.1063/1.1473035
[7] Fu, Y., Lei, M., Li, Z., Gu, Z., Yang, H., Cao, A., Sun, J. (2017). Lift-off effect reduction based on the dynamic trajectories of the received-signal fast Fourier transform in pulsed eddy current testing. NDT & E International, 87: 85-92. https://doi.org/10.1016/j.ndteint.2017.01.010
[8] Shyam, T.V., Sharma, A., Kaushik, A., Dulera, I.V., Sinha, S.K., Das, N., Court, G. (2020). Optimization of design parameters of pulsed eddy current probe for displacement measurement for finding diametrical creep of test specimen capsules. International Journal of Emerging Technologies, 11(1): 486-492.
[9] Shyam, T.V., Sharma, A., Patankar, V.H., Kaushik, A., Sinha, S.K., Ferry, L. (2023). Experimental study of different innovative measurement methodologies applied to a canned pulsed eddy current testing probe suitable for dilation measurement of test specimens. Insight-Non-Destructive Testing and Condition Monitoring, 65(2): 80-86. https://doi.org/10.1784/insi.2023.65.2.80
[10] Sophian, A., Tian, G.Y., Taylor, D., Rudlin, J. (2001). Electromagnetic and eddy current NDT: A review. Insight, 43(5): 302-306.
[11] Sophian, A., Tian, G.Y., Taylor, D., Rudlin, J. (2002). Design of a pulsed eddy current sensor for detection of defects in aircraft lap-joints. Sensors and Actuators A: Physical, 101(1-2): 92-98. https://doi.org/10.1016/S0924-4247(02)00195-4
[12] Cheng, D.H. (1965). The reflected impedance of a circular coil in the proximity of a semi-infinite medium. IEEE Transactions on Instrumentation and Measurement, (3): 107-116. https://doi.org/10.1109/TIM.1965.4313457
[13] Dodd, C.V., Deeds, W.E. (1968). Analytical solutions to eddy‐current probe‐coil problems. Journal of applied physics, 39(6): 2829-2838. https://doi.org/10.1063/1.1656680
[14] Lefebvre, J.H.V., Mandache, C. (2006). Pulsed eddy current measurement of lift-off. AIP Conference Proceedings, 820(1): 669-676. https://doi.org/10.1063/1.2184591
[15] Tian, G.Y., Li, Y., Mandache, C. (2009). Study of lift-off invariance for pulsed eddy-current signals. IEEE Transactions on Magnetics, 45(1): 184-191. https://doi.org/10.1109/TMAG.2008.2006246
[16] Mandache, C., Lefebvre, J.H.V. (2006). Transient and harmonic eddy currents: Lift-off point of intersection. NDT & E International, 39(1): 57-60. https://doi.org/10.1016/j.ndteint.2005.06.003
[17] Lefebvre, J.H.V., Dubois, J.M.S. (2005). Lift-Off Point of Intercept (LOI) behavior. AIP Conference Proceedings, 760(1): 523-530. https://doi.org/10.1063/1.1916720
[18] Li, J., Wu, X., Zhang, Q., Sun, P. (2015). Measurement of lift-off using the relative variation of magnetic flux in pulsed eddy current testing. Ndt & E International, 75: 57-64. https://doi.org/10.1016/j.ndteint.2015.06.008
[19] Bowler, J., Johnson, M. (1997). Pulsed eddy-current response to a conducting half-space. IEEE Transactions on Magnetics, 33(3): 2258-2264. https://doi.org/10.1109/20.573841
[20] Yu, Y., Yan, Y., Wang, F., Tian, G., Zhang, D. (2014). An approach to reduce lift-off noise in pulsed eddy current nondestructive technology. Ndt & E International, 63: 1-6. https://doi.org/10.1016/j.ndteint.2013.12.012