Muhammad Mulhim Md Jani | Muhammad Asraf Hairuddin*![]() | Hajar Ja’afar
| Hajar Ja’afar![]() | Ilham Rustam
| Ilham Rustam![]() | Ali Abd Almisreb
| Ali Abd Almisreb![]() | Nur Dalila Khirul Ashar
| Nur Dalila Khirul Ashar![]()
© 2024 The authors. This article is published by IIETA and is licensed under the CC BY 4.0 license (http://creativecommons.org/licenses/by/4.0/).
OPEN ACCESS
The paper aims to develop a weight-sensing system and monitoring platform to track the activity patterns of a stingless bee colony using a weight-sensing system that consists of an Arduino Mega, a NodeMCU ESP8266, and load cell as weight sensors with a Real-Time Clock (RTC) module. The system was designed with an improved weight sensor that includes triangle or delta positioning and placement for greater stability on the log hive. It also featured real-time mobile monitoring via the Blynk application, which sends weight measurements continuously via Wi-Fi. It shows that the weight fluctuations indicate that the stingless bees are most active in their foraging activities between 9:00 and 13:00, with occasional activity between 21:00 and 22:00, gathering food sources to produce honey or beebread. Consequently, analysing the daily pattern of weight measurements using a correlation analysis throughout a week enable beekeepers to observe their diverse foraging patterns. These patterns can be strongly linked to the movements of active bees, human interference, or environmental errors when the correlation value approaches one. The findings of this research can assist beekeepers in understanding routine activities by observing the foraging patterns of stingless bees, which could reveal valuable insights regarding bee health and honey production levels and help detect a decline in the bee colony. This can be achieved by utilising Internet of Things (IoT) technology to enhance hive management practices.
hive, Internet of Thing, mobile monitoring, smart systems, stingless bees, weight sensors
Technological advancements over the years have led to the integration of numerous Internet of Things (IoT) technologies, resulting in more advanced and sophisticated systems such as online monitoring [1-4] embedded hardware-software [5-8] and intelligent system [9-11]. As has been noted, the increasing prominence of these IoT technologies provides greater advantages to enhance the efficacy of conventional processes or approaches; as a result, these technologies have been extensively investigated and deployed in various sectors, including the food and agriculture industry, including bee farming.
Recently, many researchers have focused on real-time monitoring systems to better understand foraging patterns and activity periods and demonstrate how these patterns are affected by external influences such as weather conditions. Various studies related to innovation toward stingless bees have been undertaken. Jailis et al. [12] presented an IoT-based monitoring system using an Arduino Uno ATmega328P and DHT22 sensor to continuously monitor the temperature and humidity within a stingless beehive and wirelessly transmit the data to a server for monitoring and analysis. A real-time and long-term air pollution measurement and monitoring system for stingless bee farms has been a key contribution to stingless bee monitoring studies. Md Yunus [13] developed the use of IoT in meliponiculture, which studies beekeeping with stingless bees. Their research emphasized the difficulties of manual data gathering that can be overcome through the viability of online monitoring of bee hives using IoT technologies. They employed non-intrusive sensors to estimate the number of departing and arriving bees and a temperature and humidity sensor to monitor the conditions within the hive. The information was wirelessly transferred to an IoT cloud platform for continuous data monitoring and retrieval. Furthermore, Ramli et al. [14] incorporated air pollution detection sensors into a wireless sensor network and implemented LoRa (long range) technology to measure and monitor pollutants in real-time, which can assess the health of stingless bee hives on farms. Their method, integrated with information-gathering schemes, helped beekeepers control and act promptly on hive-related issues. Nik et al. [15] innovated the i-BeeHOME by creating a highly advanced stingless bee hive and incorporating security features to avoid theft. The development of intelligent technology to collect real-time data on remote bee colony hives using LoRa and LoRaWan technology could also be used to gather and retrieve data from beehives in rural areas where Wi-Fi/BLE networks are inadequate.
Prior researchers have utilised several sensors connected through wireless systems to ensure that the beehives are maintained in optimal conditions conducive to enhanced honey production. These sensors have several functions, but their main goal is to monitor and record temperature, humidity, and environmental data. This is particularly important for stingless bees since they are more sensitive to parameter changes compared to other types of bees [16-18].
Table 1 presents a concise and comparative overview of the real-time monitoring systems that have been implemented for stingless bees. One of the important aspects of remote monitoring of any measurement data is the consideration of multiple aspects, such as functionality, cost, and scalability. In the era of cutting-edge technologies, many tools and applications were evolving and rising. To name a few, such as Blynk, Thingspeak, and Cayenne, in which the choice of application development depends on the aforementioned factors. Blynk offers a relatively simple yet flexible option for lightweight monitoring applications and is available as an open-source tool for application development.
Table 1. Comparative evaluation between existing and proposed IoT monitoring systems for stingless bees
|
Author(s) |
Hardware Implementation |
User Interface |
Data Duration |
Challenge |
|
Jailis et al. [12] |
• Arduino Uno ATmega328P • DHT22 sensor to monitor the temperature and humidity inside the hive • Wi-Fi module ESP-01S |
Thingspeak |
30 days at maximum 30 minutes daily |
Connectivity, power supply and sensor accuracy |
|
Md Yunus [13] |
• Arduino Uno (Rev3) • DHT11 sensor to monitor the temperature and humidity inside the topping • Wi-Fi module ESP8266 |
Thingspeak |
125 days at resolution of 40 seconds |
Connectivity and data access range |
|
Ramli et al. [14] |
• Arduino UNO • DHT11 sensors to measure temperature and humidity around stingless beehives, • LoRaWan wireless module |
Not available |
30 days |
Not mentioned |
|
Nik et al. [15] |
• LoRa and LoRaWan |
Not available |
Not mentioned |
Limited coverage in rural area |
|
Proposed system |
• Arduino Mega microcontroller |
Blynk |
180 days |
Not mentioned |
The main objective of this paper is to deploy the weight monitoring system deploying an IoT-based weight monitoring system with the Blynk application. This is beneficial, especially to beekeepers, for effectively monitoring log hives and assessing their healthiness performance through remote monitoring. Despite previous researchers having made valuable contributions by utilising multiple sensors in conjunction with weight measurements to track the behaviour and foraging activities of stingless bees, they have also highlighted the limited progress in analysing weight variations as a means of monitoring the activity patterns of these bees. It is necessary to consider capturing data over longer durations in order to achieve continuous monitoring. Hence, in this study, the proposed system utilizes weight measurement as an indicator of monitoring the behaviour and foraging activities of stingless bees in the log hive. The system’s advantages include the ability to measure weight for a longer period of time, which enables thorough analysis of the obtained data.
Furthermore, the current study’s novelty contribution that was developed not only improves the design and implementation of weight systems in a log hive but also supports correlation analysis in providing insights by quantifying the activities of stingless bees through pattern evaluation. The integration of weight sensors consisting of multiple bar load cells arranged in a triangle towards the log hive could provide more stable positioning when installed. Through the application of advanced analysis, the usefulness of recorded weight data may result in far more trustworthy insights into the activity of stingless bees. The paper is divided as follows. Section 2 provides an overview and presents the literature on the progress of stingless bee research with a focus on the establishment of a weight-monitoring landscape. Section 3 describes the methodology and workflow of the whole system, the design of the hardware, and the configuration of the sensors used in this research. Meanwhile, Section 4 presents the analysis of the results and relevant discussions. Section 5 provides the conclusion and recommendations for future work.
Weight monitoring for log hives can be of considerable importance to activities for stingless bees. The weight of the hive is a direct indicator of the honey, pollen, and number of bees present. Suppose the weight of a hive is monitored accurately, with a high resolution, and at an appropriate interval. In that case, the variation in weight data can be used to determine the foraging activity of the bee colony, depending on factors such as the availability of pollen and nectar resources or the seasonality [19-21]. Note that advanced monitoring facilitates tracking the movement pattern of stingless bee activities in different agricultural settings, helping optimise beekeeping. Stingless bees differ from honey bees in terms of size, characteristics, behaviour, and honey production. Moreover, the design of the hive plays an important role in determining the sensors’ placement, depending on the configuration and types of sensors suitable to measure the weight. In this instance, honey production and optimising hive management procedures are of the utmost importance in determining the optimal time for honey harvesting. Weight measurement can even be used to weigh the number of stingless bees inside the hive, reflecting the bees’ healthiness and quantifying the stingless bees’ activities, including foraging and flight bees activities. Specifically for stingless bees, limited work focusing on weight measurements towards stingless bees is currently in progress.
Preliminary work conducted by Anuar et al. [22] has established a cloud-based application that successfully collected two days of weight data to be stored in the cloud and employed four strain gauge resistance-based load cell sensors integrated with HX711 modules mounted at each edge of the topping for weight measurement. The cell consists of four strain gauges and two precision resistors coupled in a Wheatstone Bridge configuration. However, the weight measurement setup that has been proposed is susceptible to intermittent fluctuations caused by external forces, such as wind fluctuations on the roof. These fluctuations result in unbalanced potential measurements on the load sensor circuits of the Wheatstone bridge strain gauges. Consequently, the developed system is afflicted with instability and interruptions throughout the measurement process. It was observed that the short length of data collected restricted the final measurement; thus, enhancements are necessary to capture data for a longer period of time in order to estimate the weight of beehives.
Rosli et al. [23] developed prototyping to measure the stingless bee weight utilizing a single bar load cell in order to estimate the honey produced inside the lid. Note that the weight measurement method plays a crucial part in monitoring beehives. Monitoring the honey production capacity and assessing the well-being of honeybee colonies is a prudent practice aimed at mitigating the occurrence of colony collapse disorder. It was found that the measurements captured within three days hinder the ability to obtain sufficient evidence to relate; however, the developed system has limited capabilities to allow advanced data analysis of the acquired data. As a result, it lacks a comprehensive understanding of the long-term weight trends and patterns, which is necessary to clarify the available results. Moreover, the obvious weakness highlighted that utilising a single bar load cell remains insufficient to obtain reliable, steady, and uninterrupted data. Hence, the study proposes that employing several load cells with specific configuration settings may result in more reliable results due to their improved stability in comparison to a single load cell.
Following through existing literatures, it has been discovered that the selection of load cells for heavy loads in log hives should be undertaken with careful consideration. When comparing the resistance of strain gauges and load cells, it is evident that bar load cells are more reliable and robust than resistance base strain gauges. Currently, there is a lack of comprehensive studies that provide extended weight data measurements. Moreover, existing weight sensor configurations still pose challenges in accurately estimating the actual measured weight in order to obtain a net weight corresponding to the exact amount of desired honey produced. Moreover, most of the works supply the information obtained through an established monitoring system, which is insufficient to provide detailed insight that needs to be quantified. Hence, a complementary system with analytics features would make the data more meaningful to interpret.
The primary benefit of implementing a comprehensive weight system monitoring is to gain insight into the typical behaviour of stingless bees. The logged data could indirectly indicate a great potential for honey estimation in the log hive, particularly in large-scale bee farming, while optimising human resources could be potentially expanded in the future.
Figure 1. System block diagram of the smart weight system
Figure 1 displays the proposed intelligent weight sensor system in the form of a portable prototype. The system comprises an HX711 force measurement module, bar load cells as weight sensors, and a Real-Time Clock (RTC). Each weight sensor can handle a maximum load of 20 kg, which in total has produced a maximum load of 60 kg for the overall three weight sensors. The system is embedded with an Arduino Mega microcontroller that can process the input and output components. The weight data are transferred to the database and simultaneously transmitted to the NodeMCU ESP8266. Consequently, it sends the data wirelessly to the Blynk cloud. The designed weight system can be accessed via the Internet, and statuses can be monitored remotely via a mobile phone or personal computer connected to the log hive. The prototype can read weight data, which is then stored in the Blynk cloud to form a sort of database. A beekeeper may manually retrieve the recorded weight data, keeping track of the daily foraging activities of the stingless bees through remote access to the database.
3.1 Circuitry hardware component
Regarding the hardware components used in this study, temporal data of the weight measurements were used to store the weight data with time data (i.e., seconds). This allows the reading to be captured in temporal measurements, including the date and time, essential for examining the stingless bees’ activities. Thus, the RTC displayed time in either 24-hour or 12-hour format while consuming minimal power usage. The smart weight-sensing system’s input and output are controlled by the Arduino Mega, operating as the ‘brain’ of the device. Note that the memory of this device is significantly larger than those of other variants similar to Arduino. Another component of the NodeMCU ESP8266 as a second microcontroller is used to analyse the weight data transmitted by the Arduino Mega. After processing, the data are interpreted by Blynk, which beekeepers can use to monitor log hives. As Blynk requires Wi-Fi to collect the data from the microcontroller, the NodeMCU ESP8266 is an ideal choice as it is already equipped with a Wi-Fi module and is notably compact. In particular, the NodeMCU ESP8266 microcontroller receives Wi-Fi signals. It is equipped with a Wi-Fi module built directly, enabling the gathered information to be easily sent to Blynk. In addition, using bar load cells is crucial since they can determine the weight of the log hive and simultaneously detect the weight of items above the surface of the associated sensors. This setup is an essential function of the bar load cells. Considering the weight of the log hive and other unknown parameters, the maximum load of 20 kg is considered appropriate.
Tables 2 and 3 provide the relevant specifications of each hardware component. Based on the specifications, the weight sensor can be powered from 3 to 12 V. However, the power supply supplied with the Arduino Mega normally uses 5 V. Meanwhile, the operating voltage range for the RTC is from 3.3 to 5 V. Table 2 also summarises the specifications of the microcontrollers, Arduino Mega 2560 and NodeMCU ESP8266. The operating voltage or power supplied to the Arduino Mega 2560 is 5 V, while the power supplied to the NodeMCU ESP8266 is 3.3 V. The optimal voltage supply for this system is 5 V, as the Arduino can internally provide 5 V to both the RTC and weight sensor. The NodeMCU is powered by a 3.3 V supply from the Arduino, which is sufficient for the NodeMCU to operate. All the ground connections of the components are connected to the common ground of the Arduino. The system operates with minimal power consumption, using only 40 mA for each component. Therefore, the circuit must be constructed appropriately, considering all the hardware components that are included.
Table 2. Specifications of the weight sensor and RTC
|
Item Specification |
Weight Sensor |
RTC |
|
Operating voltage, Vcc (V) |
3-12 |
3.3-5.5 |
|
Maximum voltage (V) |
15 |
VCC + 0.3 |
|
Working temperature (℃) |
−20 to 60 |
0 to 70 |
|
Maximum load (kg) |
20 |
NA |
Table 3. Specifications for the microcontrollers
|
Item Specification |
Arduino Mega |
NodeMCU ESP8266 |
|
Operating voltage, Vcc (V) |
5 |
3.3 |
|
Power supply, Vs (V) |
7–12 |
7–12 |
|
Digital I/O pins |
54 |
11 or 13 |
|
Analog input |
16 |
1 |
|
Flash memory |
256 kB |
4 MB |
|
SRAM |
8 kB |
NA |
|
EEPROM |
4096 B |
512 B |
|
Wi-Fi |
No |
Yes |
|
Power Jack |
Yes |
No |
|
USB connection |
Yes |
Yes |
Figure 2 illustrates the setup of the log hive with the sensors used in this study, including (a) the overall 3D design, (b) the actual real-world setup of the smart weight-sensing system (the red circle represents the weight sensor), and (c) the top view of the weight sensor configuration. Bar load cells that could support a maximum load of 20 kg for the log hive were selected in this study. Three weight sensors were then installed to ensure the log hive remained stable. If log stability is overlooked, the weight reading will be interrupted since a drop in weight indicates that the stingless bee has declined. Subsequently, three weight sensors were used to ensure the stability of the log hive. One of the weight sensors was positioned in front of the other two, placed side by side at a distance of 15 cm (subgraph (b) of Figure 2), forming a triangle or delta configuration. Correspondingly, the weight sensor was placed under the log hive. The data obtained from the system included cumulative information on honey, propolis, and bee bread, as well as the movement of the stingless bees of the H. itama species.
3.3 System workflow
The required weight measurements were continuously monitored in real-time with the Blynk application, which was customised and designed as a personal computer-based and mobile phone interface. Note that beekeepers could access the weight data via Blynk or remotely monitor the data using a personal computer. An additional feature to incorporate a system reset was provided, which will notify the beekeeper in the event of a failure to retrieve the weight data measurement, specifically when opening the topping, requiring them to manually perform the system reset on-site. Figure 3 portrays the work flowchart of developing the weight-sensing system. Initially, the log hive was configured by recalibrating the weight sensor, and then the log hive was positioned above the base support.
Figure 3. Flowchart of developing the weight system
The weight sensors were attached underneath the log hive. Here, the system turned on for the first time and demonstrated a weight sensor of zero, hence the need for calibration. After completing the weight sensor calibration and setup procedures, the weight measurements were obtained and evaluated via correlation analysis.
Eq. (1) was used to compute the correlation between weight and time.
Correlation $=\frac{\sum(x-\bar{x})(y-\bar{y})}{\sqrt{\sum(x-\bar{x})^2 \cdot \sum(y-\bar{y})^2}}$ (1)
where,
x = time recorded in second (s)
y = weight measured in gram (g)
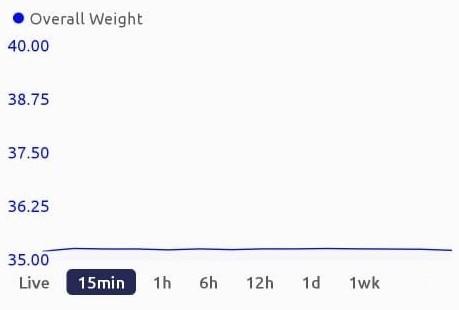
The analysis utilised Pearson correlation. The Pearson correlation coefficient is suitable when both variables are quantitative and there are no outliers present in the data. If the correlation coefficient tends towards a positive value, it indicates a positive correlation between the variables, implying that they vary in the same direction. Conversely, when the correlation coefficient tends towards a negative value, it signifies that the variables exhibit a negative correlation, implying that they change in opposite directions. When the correlation value is zero, it can be inferred that there is no apparent connection between the variables. Figure 4 displays the user interface of the smart weight sensing system that has been integrated into the Blynk application. This tool enables beekeepers to assess the condition of each log hive and ascertain if it is appropriate for honey extraction or requires maintenance.
Figure 4. The interface of the smart weight-sensing system with the Blynk application
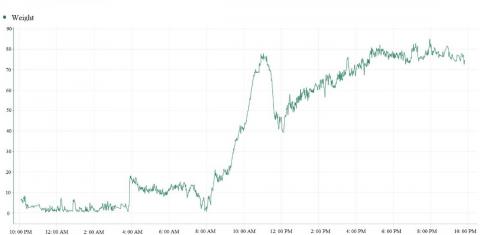
Figure 5 presents a sample graph for analysing and integrating the foraging activities using the weight-sensing system from which the daily pattern could be observed. Note that experiments were conducted from 9th to 15th March 2023. The weight measurements were collected and monitored to observe the foraging behaviour of the stingless bee species of H. itama. The data were recorded for seven days in one-second intervals. Figure 5 demonstrates that the stingless bees of type H. itama were most active in their foraging between 9:00 and 13:00; they were occasionally active between 21:00 and 22:00. By referring to the recorded values of the weight measurement from the database, the analysis results could be further examined in terms of how long H. itama actively foraged or stayed in the hive and whether H. itama actively foraged by entering the log hive. The measured weights were influenced by different factors, such as the number of stingless bees and the presence of nectar and pollen. Furthermore, environmental factors (e.g., wind, rain, dry leaves, and other materials gathering on top of the log hive) that could have altered the readings of the weight data were also considered. Figure 6 depicts the occurrence of a rapid increase in a few seconds. The spike in the red rectangle indicates an upward occurrence due to an error originating from the environment.
The increase occurred between 02:29:37 and 02:29:54, when the weight was 17.10 gram and 27.17 gram, respectively. The weight reading experienced a sudden decrease 17 seconds prior to the time stamp of 02:29:56, with the weight dropping from 27.16 gram to 12.52 gram at 02:30:20. The stabilisation of the reading to 15.22 gram occurs 24 seconds before to the event. Thus, the spike occurs when the value exceeds 10 gram and takes place in under a minute, as indicated by the pattern observed on the graph.
Figure 5. Sample data of the weight measurement
Figure 6. Sample data spike
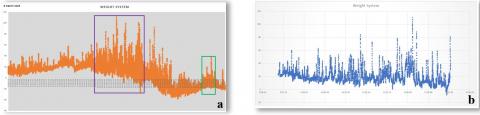
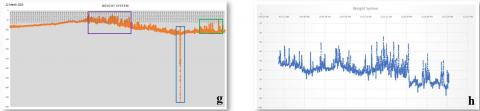
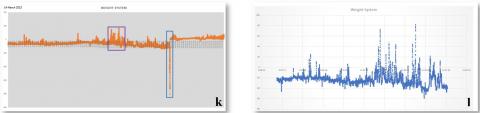
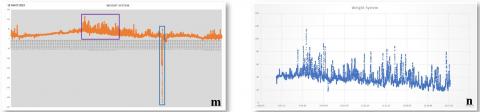
Subgraphs (a), (c), (e), (g), (i), (k), and (m) of Figure 7 display a sharp increase in bee activity in terms of entering the log hive between 9:00 and 13:00, as evidenced by the rapid changes in weight data during this time. This finding can also be verified by the annotated weight measurements exhibited in the purple box in the figures. The temporal range is large, although the fluctuations remain stable in a week. Moreover, a change in duration patterns, particularly the rapidly fluctuating foraging activity of H. itama, occurred for approximately one hour on most evenings between 21:00 and 22:00 (see green boxes in subgraphs (a), (c), (e), (g) and (i) of Figure 7). The other pattern of rapid fluctuations can be explained by human activity involving the log hive, such as honey collection between 17:00 and 19:00 (see blue boxes in subgraphs (c), (e), (g), and (m) of Figure 7). A rapid decrease in values indicates a dramatic drop in the measured weights due to the opening of the topping. Additionally, the trends also suggest that H. itama actively entered the tunnel and was often active outside the hive, producing honey or making bee bread regardless of whether it was in the morning or evening.
Consequently, a correlation analysis was conducted to determine whether the weight and time measurements were correlated. The conditions were set as zero (0), positive (+1) and negative (−1) to indicate ‘no,’ ‘positive’ and ‘negative’ correlations between the two parameters, respectively. The correlations displayed in subgraphs (b) and (d) of Figure 7 are −0.16 and −0.48, respectively, corresponding to the movements of active bees from 9:00 to 13:00, which are fast and active at this time. The correlation illustrated in subgraph (f) of Figure 7 is −0.57, whilst the correlation portrayed in subgraph (h) of Figure 7, corresponding to the next day, is −0.58. Subgraph (j) of Figure 7 has a correlation of −0.97; by contrast, subgraphs (l) and (n) of Figure 7, corresponding to the next day, have correlations of −0.15 and −0.31, respectively.
Figure 7. (Left columns) Graphs on daily variations by plotting weight measurements versus time for stingless bee activities, (right) graphs on the extracted pattern of daily variation represent the active movements of the stingless bee
By referring to the recorded values of the weight measurement from the database, the analysis results could be further examined in terms of how long H. itama actively foraged or stayed in the hive and whether H. itama actively foraged by entering the log hive. The measured weights were influenced by different factors, such as the number of stingless bees and the presence of nectar and pollen. Furthermore, environmental factors (e.g., wind, rain, dry leaves, and other materials gathering on top of the log hive) that could have altered the readings of the weight data were also considered.
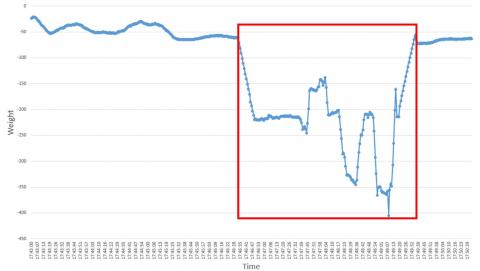
Figure 8 shows in the graph a red rectangle where, during the evening, at almost 17:45, the beekeepers will collect the honey if the database at Blynk application shows an increase in honey. The reading is spiked down because the topping on the log is open to beekeepers to collect the honey. Based on the pattern from the graph, it is shown that the beekeepers will collect the honey between 17:30 and 18:00, and there are human activities. Therefore, only at that time, the error reading will appear rather than that is bee activity or weather condition that changes the reading of the weight.
Figure 8. Open the topping of the log hive
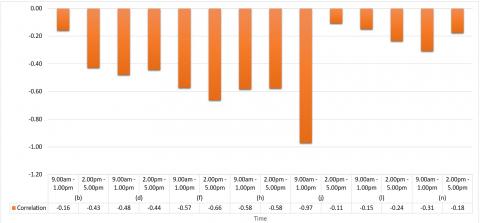
Figure 9 presents the plot of the correlation analysis for the period between 09:00 and 13:00. The correlation changes between 14:00 and 17:00, suggesting that the variations in weight measurements are not the only factor affecting the correlation between the evaluated variables. Overall, the changes in the correlation coefficients suggest a complex relationship between the evaluated variables and require further investigation. The stingless bee is most active during two periods: from 09:00 to 13:00 and from 14:00 to 17:00. This behaviour is supported by a negative correlation coefficient analysis. The stingless bee exhibits excessive frequency when entering the tunnel or entrance hole.
Figure 9. Correlations of the movements of H. itama
This paper describes the implementation of a smart weight-sensing system that utilised a low-cost monitoring system involving IoT, which is developed using Arduino Mega, a NodeMCU ESP8266 and load cells as weight sensors with an RTC module to capture temporal data of the measured weight for the log hive in the stingless bees application. The primary purpose of the RTC function is to accurately track and record the time at one-second intervals for the weight system’s readings. The bar load cell sensor is a weight sensor used to measure the weight placed on it. The Arduino Mega is responsible for processing the data, while the NodeMCU transmits the data to the Blynk application using Wi-Fi. The data will be accessible through the Blynk application, allowing beekeepers to conveniently monitor the weight of the log hive just from the Blynk application. Thus, these components enable remote monitoring of the stingless bee’s activities without the need to physically visit the farm or site. Analytics provided through correlation analysis have revealed that variation in weight could demonstrate the pattern of stingless bees’ activities given the foraging behaviour of stingless bees of the genus H. itama. The correlation between 0 and -1 indicates that the stingless bee is either actively producing honey or in movement, which is consistent with the log’s health. This is done by measuring the weight change of areas above the weight sensor to account for factors such as rain, wind, and other elements. The environmental conditions of the stingless bee constitute important factors affecting daily foraging activity. Thus, the relative importance of certain parameters, such as wind and rain, would be future work to be further investigated in the future to improve the system and analytics interpretations.
The authors would like to express their gratitude to IPSIS Universiti Teknologi MARA for providing funding through the Journal Support Fund. The research was conducted and supported under the Young Talent Researcher Grant, with file number 600-RMC/YTR/5/3 (009/2020).
[1] Frumosu, F.D., Méndez Ribó, M., Shan, S., Zhang, Y., Kulahci, M. (2023). Online monitoring for error detection in vat photopolymerization. International Journal of Computer Integrated Manufacturing, 36(9): 1313-1330. https://doi.org/10.1080/0951192X.2022.2162600
[2] Yudhana, A., Akbar, S.A., Mufandi, I., Larombia, B. (2022). Monitoring and automation of temperature control based on mobile application technology (MAT) for precision oyster mushroom cultivation. Instrumentation Mesure Métrologie, 21(5): 189-197. https://doi.org/10.18280/i2m.210504
[3] Tripathi, A.K., Aruna, M., Prasad, S., Pavan, J., Kant, R., Choubey, C.K. (2023). New approach for monitoring the underground coal mines atmosphere using IoT technology. Instrumentation Mesure Métrologie, 22(1): 29-34. https://doi.org/10.18280/i2m.220104
[4] Thippeswamy, V.S., Shivakumaraswamy, P.M., Chickaramanna, S.G., Iyengar, V.M., Das, A.P., Sharma, A. (2021). Prototype development of continuous remote monitoring of ICU patients at home. Instrumentation Mesure Métrologie, 20(2): 79-84. https://doi.org/10.18280/i2m.200203
[5] Dessai, S.N., Patidar, H. (2023). Software design analysis and implementation of OFDMA and its computing architecture analysis for 5G/4G eNodeB. Wireless Personal Communications, 130(2): 1371-1397. https://doi.org/10.1007/s11277-023-10335-1
[6] Surabhi, V.R., Krishnamurthy, P., Amrouch, H., Henkel, J., Karri, R., Khorrami, F. (2023). Golden-free robust age estimation to triage recycled ICs. IEEE Transactions on Computer-Aided Design of Integrated Circuits and Systems, 42(3): 2839-2851. https://doi.org/10.1109/TCAD.2023.3238291
[7] Hostetter, M., Angryk, R.A. (2020). First steps toward synthetic sample generation for machine learning based flare forecasting. In 2020 IEEE International Conference on Big Data (Big Data), Atlanta, USA, pp. 4208-4217. https://doi.org/10.1109/BigData50022.2020.9377986
[8] Li, T. (2020). Design of an automatic detector for gas desorption of coal samples. Instrumentation Mesure Métrologie, 19(5): 355-361. https://doi.org/10.18280/i2m.190505
[9] Arismendy, L., Cárdenas, C., Gómez, D., Maturana, A., Mejía, R., Quintero M, C.G. (2020). Intelligent system for the predictive analysis of an industrial wastewater treatment process. Sustainability, 12(16): 6348. https://doi.org/10.3390/su12166348
[10] Thao, L.Q., Bach, N.C., Bach, P.X., Hieu, L.P.M.H., Phuc, T.G. (2023). Intelligent health assistant for pupils. Instrumentation Mesure Métrologie, 22(1): 11-19. https://doi.org/10.18280/i2m.220102
[11] Manjunath, A.G., Vrtagić, S., Dogan, F., Dordevic, M., Zarkovic, M., Kevric, J., Dobric, G. (2021). Machine learning MOSA monitoring system. Instrumentation Mesure Métrologie, 20(4): 203-208. https://doi.org/10.18280/i2m.200404
[12] Jailis, B.A., Kiring, A., Yew, H.T., Barukang, L., Farm, Y.Y., Wong, F. (2022). A real-time web-based monitoring system for stingless bee farming. In 2022 IEEE International Conference on Artificial Intelligence in Engineering and Technology (IICAIET), Kota Kinabalu, Malaysia, pp. 1-5. https://doi.org/10.1109/IICAIET55139.2022.9936841
[13] Md Yunus, M.A. (2017). Internet of Things (IoT) application in meliponiculture. International Journal of Integrated Engineering, 9(4): 57-63. https://penerbit.uthm.edu.my/ojs/index.php/ijie/article/view/2016.
[14] Ramli, M.F., Harun, A., Ismail, R.C., Ndzi, D.L., Turner, J.S.C., Farook, R.S.M., Isa, M.N.M., Murad, S.A.Z. (2021). Design and development of stingless beehive air pollutant monitoring system. International Journal of Nanoelectronics & Materials, 14: 265-278.
[15] Nik, W.N.S.W., Mohamad, Z., Zakaria, A.H., Azlan, A.A. (2020). i-BeeHOME: An intelligent stingless honey beehives monitoring tool based on TOPSIS method by implementing LoRaWan–A preliminary study. In Computational Science and Technology: 6th ICCST 2019, Kota Kinabalu, Malaysia, pp. 669-676. https://doi.org/10.1007/978-981-15-0058-9_64
[16] Basrawi, F., Hamid, A.R.A., Bahari, R., Noordin, M.N.M., Yusof, M.H. (2017). A preliminary study on the thermal performance of a ventilated honey cassette for stingless bees. MATEC Web of Conferences, 131: 04001. https://doi.org/10.1051/matecconf/201713104001
[17] Trianto, M., Purwanto, H. (2022). Diversity, abundance, and distribution patterns of stingless bees (Hymenoptera: Meliponini) in Yogyakarta, Indonesia. Biodiversitas Journal of Biological Diversity, 23(2): 695-702. https://doi.org/10.13057/biodiv/d230214
[18] Ramadani, R.F., Raffiudin, R., Ariyanti, N.S., Biagioni, S., Treanore, E., Behling, H. (2021). Stingless bee foraging behavior and pollen resource use in oil palm and rubber plantations in Sumatra. Jurnal Entomologi Indonesia, 18(2): 81-81. https://doi.org/10.5994/jei.18.2.81
[19] Anwar, O., Keating, A., Cardell-Oliver, R., Datta, A., Putrino, G. (2022). Design and development of low-power, long-range data acquisition system for beehives-BeeDAS. Computers and Electronics in Agriculture, 201: 107281. https://doi.org/10.1016/j.compag.2022.107281
[20] Meikle, W.G., Rector, B.G., Mercadier, G., Holst, N. (2008). Within-day variation in continuous hive weight data as a measure of honey bee colony activity. Apidologie, 39(6): 694-707. https://doi.org/10.1051/apido:2008055
[21] Kanazoe, I.W., Nombré, I., Ouédraogo, S., Boussim, J.I., Vereecken, N.J. (2023). Influence of climatic factors and floristic diversity on the foraging activity of Apis mellifera adansonii Latreille in a West African Savannah. African Journal of Ecology, 61(3): 660-674. https://doi.org/10.1111/aje.13159
[22] Anuar, N.H.K., Yunus, M.A.M., Baharuddin, M.A., Sahlan, S., Abid, A., Ramli, M.M., Amin, M.R.A., Lotpi, Z.F.M. (2019). IoT platform for precision stingless bee farming. In 2019 IEEE International Conference on Automatic Control and Intelligent Systems (I2CACIS), Selangor, Malaysia, pp. 225-229. https://doi.org/10.1109/I2CACIS.2019.8825089
[23] Rosli, H.A., Malik, N.A., Ahmad, Y.A. (2022). IoT based monitoring system for stingless bees colony in IIUM. Journal of Physics: Conference Series, 2312(1): 012088. https://doi.org/10.1088/1742-6596/2312/1/012088