Natee Thong-un | Piyathat Panthong | Wongsakorn Wongsaroj* | Hideharu Takahashi | Hiroshige Kikura
© 2024 The authors. This article is published by IIETA and is licensed under the CC BY 4.0 license (http://creativecommons.org/licenses/by/4.0/).
OPEN ACCESS
A Paddle Wheel Aerator is developed in this research, which includes a wireless sensor network for measuring the water quality in the aquaculture of marine shrimp ponds. It can also move to the desired position to fill oxygen and measure water quality. A basic requirement is good standard water quality to prevent shrimp from epidemics and improve production. The water quality Paddle Wheel Aerator applies a microcontroller and sensors to measure eight parameters of water quality. These water quality parameters are observed on the web application via an IoT module. The movement system of the water-quality Paddle Wheel Aerator consists of a LiDAR, GPS, and remote RF signal. Each item of data is recorded immediately on the cloud server while the water-quality paddle wheel moves in the marine shrimp farm. The controlled Paddle Wheel Aerator is harnessed automatically to enhance precisely the spatial monitoring resolution of the measurement system installed, which is needless for a multiple measurement system with high cost of investment. Also, farmers can access real data through the Line application. Hence, they are able to plan and control a good environment for aquaculture, preventing the occurrence of various epidemics and decomposing organic matter in the pond.
Internet of Things (IoT), Paddle Wheel Aerator, shrimp, water quality measurement, wireless sensor
Agriculture plays a significant role in Thailand’s development as one of its main international revenue sources. Thailand exports a variety of agricultural products, such as rice, fruit, fishing, and so on, to the world market. Marine shrimp farming is one of the country’s traditional forms of agriculture, as can be observed from the mangrove forests surrounding the provinces. In Thailand, shrimp farming has generally been considered a secondary choice for Thai fishermen. However, a decade ago, the situation changed when shrimp farming started to generate a higher income for farmers than traditional farming due to the demand of the world market, with many fishermen converting their fields into shrimp farms. Nowadays, the shrimp farming industry has become an important economic aquatic income source for the export sector [1]. In 2020, Thailand’s main export markets were the United States (35.41%), Japan (22.5%), China (13.54%), and other countries (23.38%), respectively. Total shrimp exports equate to approximately 149,491 tons, and the demand for marine shrimp production is expected to increase. Most farmers grow two types of shrimp, namely white prawns, Yannamei, and black tiger prawns, due to the high demand for these varieties from both the domestic and international markets. Marine shrimp aquaculture can be typically grouped into three systems: 1) traditional shrimp farming, which involves taking stock shrimp fry from the wild to the farm; 2) semi-developed shrimp farming, whereby the shrimp fry is brought from a natural habitat or parent hatchery; and 3) the improvised method of using a breeder hatchery to aquaculture the shrimp fry. The third (improvised) method consists of two types: raising marine shrimp in low salinity water and the cultivation of shrimp using normal salt water. However, the main problem with marine shrimp farming is the unpredictability and inconsistency in production due to its dependence on seasonal supply, climate change, and the uneaten shrimp food accumulating at the bottom of the pond. This inefficient control leads to low productivity and directly affects the fishermen’s revenue. Some improvements have been made to the traditional farming method by pumping more tidal water into the pond to obtain more stocking density in the shrimp pond. However, the expansion of the shrimp farming industry is still restricted due to inconsistencies in water quality. The long development period in shrimp farming practice may be caused by the availability of adequate technical devices to effectively measure and validate the water quality. Normally, each pond has a peripheral ditch measuring 50–100 m wide and 30–60 cm deep. The selection of a suitable site is challenging in shrimp farming without a good water quality measurement at the location.
Research related to wireless measurement and automation for aquaculture is as follows: Simbeye et al. have proposed low-cost, short-range modules of wireless sensor networks based on ZigBee standard and virtual instruments technology to monitor and control an aquaculture system in real-time [2]. However, the limitation of this article is the use of Zigbee technology, which transmits data over a short distance and cannot be tracked via a mobile phone. Bing Shi et al. have presented the design information on three types of nodes in a wireless sensor network in Fishpond [3]. This paper only describes a wireless sensor network-based monitoring system without an Internet connection, and the DO and temperature parameters were performed. This is insufficient for the shrimp pond. IoT-based aquaculture monitoring and control system has been proposed [4]. This research deploys a variety of sensors (temperature, ammonia, level, DO, and salinity) but without real implementation. An IoT-based cloud solution for intelligent integrated rice-fish farming using wireless sensor networks has been performed [5]. This method was guaranteed only in race-fish farming, but a lack of reliability in data analysis. The information received may not yet be available for use in shrimp ponds. Wen-Tsai Sung et al. have proposed a combination of a wireless sensor network and deep reinforcement learning in a case study of freshwater fish [6]. This focuses on the neuron-networks algorithm for fishponds. The review article [7] that collects IoT technology related to aquaculture can be referenced in this article. From reviewing the literature, it was found that no research has monitored the water quality in shrimp ponds and treated the water quality using IoT technology and robots together.
Nowadays, the improvised method developed in shrimp farming is popular with fishermen because it facilitates high-density shrimp aquaculture. However, high-density shrimp aquaculture increases the degree of excretion and uneaten food waste at the bottom of the pond. This results in water quality deterioration, slow growth, infection, illness, and a decline in productivity. To address the problem, farmers will need to plan the decomposition process of such waste. They must be aware of the key factors of water quality, mainly pH, temperature, dissolved oxygen (DO), electrical Conductivity (EC), oxidation-reduction Potential (ORP), salinity, total dissolved solids (TDS), and turbidity [8]. These water parameters in an acceptable range promote good health and reduce the chance of disease [9]. Wireless communication technology has been introduced in embedded systems that automatically monitor the environment in the agricultural industry or water quality in the marine industry [10]. The development of an automatic pH-base control system is presented [11] to reduce the incidence of disease or mortality in shrimp by using a microcontroller that receives data from the pH sensor, resulting in the control of water quality. An embedded system for measuring water quality through a remotely automated network system is proposed [12] to determine the temperature, dissolved oxygen, and pH by displaying data on a web application. This work proposes a system for monitoring the environmental parameters in aquaponics to sustain healthy living conditions for both fish and plants. Smart farms for pond aquaculture have been proposed [13], using sensors to measure the temperature and pH, as well as controlling a pump’s activation and deactivation for network monitoring purposes. A control-monitoring system for the oxygen level, pH, temperature, and feeding in ponds based on an LCD display has been presented [14]. Real-time monitoring based on an embedded system and IoT has been proposed to control the environmental parameters of shrimp aquaculture [15]. Bórquez López et al. [16] demonstrate the implementation and evaluation of open-source hardware to monitor water quality in low-cost systems. Moreover, the researchers [17] have developed an architecture for flying ad-hoc networks (FANETs) to visualize the water quality of a shrimp farm in a Mexican state. As previously mentioned, although a water quality measurement system has been developed to estimate temperature, pH, and dissolved oxygen in water, the measurement of salinity is lacking, and this is important to the growth and health of aquatic animals. The cultivation of marine shrimp requires a large amount of land, and the water quality at each measurement point is different. These works executed only a single point of water quality measurement, which is obviously insufficient for effective farm operation and protection against the pandemic disease of shrimp. Hence, the multi-point water quality measurement is a necessity. The cost-effective way of the measurement that makes the farmer's applicability must be pursued.
Paddlewheel aerators are a crucial technology used in aquaculture to increase dissolved oxygen levels and enhance water quality. They are usually applied in large-scale aquaculture operations, where oxygen levels can be significant to the survival and growth of aquatic organisms. Paddlewheel aerators can help to prevent oxygen depletion, potentially leading to poor growth and even the death of aquatic organisms [18]. Paddlewheel aerators help to prevent the accumulation of nutrients and waste that can lead to poor water quality and the growth of harmful bacteria and algae. Moreover, Paddle Wheel Aerators are relatively inexpensive and require low levels of energy to operate. This makes them a cost-effective solution for improving oxygen levels and influencing water quality enhancement in aquaculture ponds. However, if the Paddle Wheel Aerator is utilized in a pond and can move automatically under a programmable position, water quality monitoring in multi-point to cover the pond area is possible. Therefore, this paper proposes a programmable Paddle Wheel Aerator called floating robot, that installs a water quality monitoring system, which moves to the desired position to increase oxygen in the pond and simultaneously collects water data in multi-points. To make the water quality measurement system more accurate, this research involves the development of a wireless communication network on the Paddle Wheel Aerator for water quality that measures pH, temperature, DO, electrical conductivity, ORP, and turbidity. Additionally, salinity and TDS can be calculated from the electrical conductivity. The water quality data is monitored on the web application, notifications are sent via the Line application, and the data is stored on the cloud server. A water quality measurement from multiple locations in the pond is proposed to help farmers obtain comprehensive information and efficiently plan their farming process.
2.1 Sensors for water quality monitoring
2.1.1 pH sensor probe
The pH probe is a sensitive device for measuring the hydrogen ions, leading to the analysis of the pH value. Technically, the pH probe consists of two electrodes. The first is used to define ions and compare them with the reference signal of the second one. The difference between the electrodes is the measured pH value of the interesting solution. The chemical reaction and the operating process temperature are used to consider the pH probe selection. The pH probe can generate a voltage predicted according to the following equation [19].
$E=E^0+\frac{R T}{F} \ln \left(\alpha_{H^{+}}\right)=E^0-\frac{2.303 \mathrm{RT}}{F} p H$ (1)
where, E is the measured voltage, E0 is the standard voltage cell, R is the ideal constant (8.314 J/mol K), T is the temperature in Kelvin, and F is the Faraday constant (96,485.3365 C mol-1).
2.1.2 Temperature sensor probe
The temperature sensor in marine shrimp farming uses a PT-100 probe. The PT-100 probe consists of a resistive thermometer. PT is platinum, and 100 is the resistance with the temperature measured at 0℃ in ohms as follows [20]:
$T=\frac{\sqrt{(-0.00232 R+17.59246}-3.908}{0.00116}$ (2)
2.1.3 Dissolved oxygen sensor probe
The dissolved oxygen (DO) sensor probe relies on an electrochemical reaction and is sensitive to many oxygens in liquids. The electrodes consist of two parts: anode polarity and cathode polarity. When the oxygen ions move through the sensing membrane at a constant speed, small voltages are produced (0 mV–50 mV) between the electrodes. If there are no oxygen ions, the voltage between the anode and the cathode will be zero [21].
2.1.4. Conductive sensor probe
The conductive sensor probes, consisting of a couple of electrodes supplied with alternating current voltage, determine the electrical conductivity under the tested liquid. They measure the ability of a liquid to conduct an electric current passing from the positive to the negative electrode. When the concentration of ions in the liquids increases, it directly results in higher conductivity [22]. Also, its value can be used to calculate the salinity, TDS.
2.1.5. Oxidation-reduction potential (ORP) sensor probe
The oxidation-reduction potential (ORP), known as REDOX, is a measurement of ions in water that reflects their oxidation ability. The ORP value is typically measured as voltage, expressed in positive and negative numbers of millivolts (mV). The ORP is a significant part of water quality testing since it defines whether the water has oxidizing or reducing properties. Regular checking of ORP levels makes it possible to monitor the effectiveness of disinfectants and optimize water treatment plans [23].
2.1.6. Turbidity sensor probe
Turbidity refers to the ability of water to block or absorb the amount of light passing through that makes the water cloudy. The turbidity is determined by measuring the light that passes through to the other side. If a significant amount of light can pass through, less turbidity is indicated, while very little light passing through demonstrates extreme turbidity [24]. Table 1 lists these parameters and their optimal range conditions and voltage supply.
Table 1. Deployment parameters of water quality sensors
|
Sensor Type |
Communication |
Voltage |
Range |
Temperature |
Accuracy |
|
Temperature |
I2C & UART |
3.3– 5 V |
-50–200 ℃ |
-50–200 ℃ |
+/-0.1 ℃ |
|
pH |
I2C & UART |
3.3–5 V |
0.001–14.000 pH |
-5–99 ℃ |
+/-0.002 pH |
|
Dissolved oxygen |
I2C & UART |
3.3–5 V |
0–100 mg/L |
1–60 ℃ |
+/-0.05 mg/L |
|
ORP |
I2C |
3.3–5 V |
-1100mV–1100mV |
1–60 ℃ |
+/-1.1 mV |
|
EC |
I2C & UART |
3.3–5 V |
5–200,000 uS/cm |
1–110 ℃ |
+/-2 % |
|
Turbidity |
Analog |
5 V |
0–100 % |
-30–80 ℃ |
+/-1 % |
2.2 LiDAR laser scanner for obstacle detection
LiDAR (Light Detection and Ranging) is used to measure the height or distance between objects. Its working principle is to send laser light to hit objects or surfaces. The distance is computed from the travel time of light reflected from the target back to the origin. The formula for distance calculating is [25]:
$d=\frac{T O F \times c}{2}$ (3)
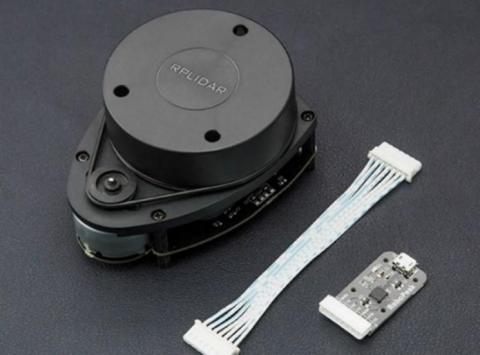
where, d is the distance, c is the velocity of light, and TOF is the Time of Flight. Information obtained from LiDAR is a form of points, known as Point Clouds, where each point consists of horizontal and vertical (x,y,z) positions. The RPLIDAR A1M8–360-degree laser scanner is a directional scanning device with 5.5–10 Hz of scanning frequency, 4000–8000 Hz, and a scanning distance of up to 12 meters. This device uses a UART port to asynchronously receive and send data with a controller, as shown in Figure 1. This device is installed in front of the automatic-movement water quality monitoring vessel to reach the required position.
Figure 1. RPLIDAR A1M8-360-degree laser scanner
2.3 Global Positioning System (GPS) module for positioning the Paddle Wheel Aerator
The Global Positioning System (GPS) is a positioning system on the Earth via satellite. Coordinates on the Earth are calculated by clock signals sent from satellites to GPS receivers. GPS satellites are specifically designed to orbit the Earth to transmit information that can be used to calculate coordinates at all times. A GPS system consists of three main parts: a base station, a GPS satellite, and a GPS receiver. The GPS receiver can determine a position depending on the number of satellites it can receive at that moment. Coordinates require at least three satellites to locate the X, Y, and Z axes. The GPS unit takes the clock signals received from all three satellites to calculate the distance between the GPS receivers and the satellite to inform the current location.
The SparkFun NEO-M8U GPS Breakout is a high-quality GPS board with equally impressive configuration options [26]. The module provides continuous navigation without needing to make any electrical connection to the Paddle Wheel Aerator. Compared to other GPS modules, this breakout maximizes position accuracy in dense cities or covered areas. Even under poor signal conditions, continuous positioning is provided in urban environments and is also available during complete signal loss.
2.4 Hardware implementation
Figure 2. Development of the float measurement in marine shrimp cultured water via a wireless sensor network
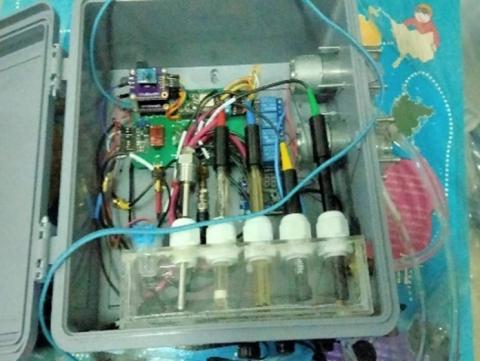
Figure 3. The sensor box used for water quality measurement
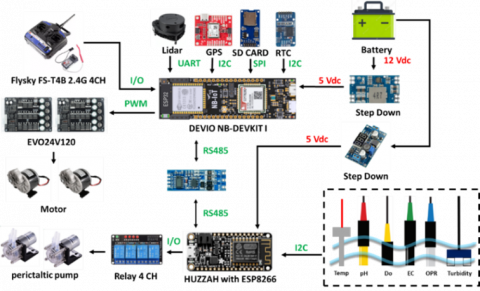
In the case of shrimp farms, online water quality measurement can be described as shown in Figure 2. Water quality sensors used for float measurement consist of six types: a temperature sensor, a pH sensor, a dissolved oxygen sensor, an electrical conductivity sensor, an oxidation-reduction potential (ORP) sensor, and a turbidity sensor. These are fully submerged probes that can remain immersed in salt water or fresh water up to the connector indefinitely. They can communicate with a controller board via the Inter-Integrated Circuit (I2C) protocol. The I2C protocol is a synchronous, multi-master/multi-slave serial communication invented by Philips Semiconductors. It is widely used in interfacing sensors to communicate with microcontrollers over short distances. Data fusion from the sensors is performed on ESP8266, a typical WiFi microcontroller, to drive a relay board to control two peristaltic pumps. The data obtained from the microcontroller are then passed to a server, NB-IoT board, via RS485 serial communication. The sensor box used in this work is shown in Figure 3. The sensor installation inside the container should use a pump to add water only when a measurement is needed to prevent the occurrence of moss. Distilled water should be used to clean the sensor probe head. The implementation of water quality measurement increases the life and accuracy of the sensor.
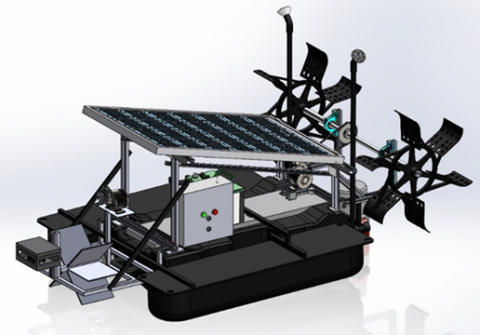
Figure 4. The architectural design of a Paddle Wheel Aerator robot
The DEVIO NB-DEVKIT I, IoT microcontroller, is designed to act as both a server to collect all the water quality values of the microcontroller to wirelessly connect with web applications for everywhere monitoring via internet networks and control an automatic Paddle Wheel Aerator. In the past, no research article that was searched that presented a wireless measurement of water quality in shrimp ponds [9]. Moreover, the proposed system can also help farmers monitor real-time data from the installed IoT system. The proposed Paddle Wheel Aerator shown in Figure 4 comprises seven distinct assemblies: 1. DC electrical motors, 2. Solar cell, 3. LiDAR, 4. Rudder, 5. Buoyancy, 6. Two driving turbines, and 7. Battery. Two DC motors are designed to control the direction with a rudder installed at the front of the robot, driving two turbines to move forward. A solar cell has the function of transforming solar energy into electrical energy while the robot runs the marine shrimp farm. It is installed on top of the robot as a solar roof. Considering the operating time of all the equipment installed on the buoy, including motors, water pumps, water quality sensors, and microcontroller, the energy requirement for the proposed system is 650.98 W/hr. The solar panel size suitable for driving all devices that require 136 W of energy is 340 W. A LiDAR laser scanner, placed near the rudder, is used to provide the robot with an accurate representation of the surveyed environment. A rudder, hinged vertically near the first motor, consists of a plastic turbine for controlling the horizontal axis. The buoyancy structure is the main support for all devices used to control the automatic Paddle Wheel Aerator representation of the surveyed environment. A rudder, hinged vertically near the first motor, comprises a plastic turbine to control the horizontal axis. The buoyancy structure supports all devices used to control the Paddle Wheel Aerator. Two driving turbines steer the robot as it moves along the canal path in the shrimp farm. A battery on the solar panel is used for energy storage to power the motors, sensors, and control board. A 12 V battery is selected to support 94.6 A/hr of capacity. The automatic Paddle Wheel Aerator direction is remotely controlled using a joystick on site. The controller receives data on the distance between the Paddle Wheel Aerator and the environment from a pathfinder, PRLIDAR A1M8, through a USB 2.0 port for serial communication to visualize the shrimp farm boundary. The EVO24V100.1, H–MOSFET bridge driver, is designed to drive motors 1 and 2, interfaced with the controller utilizing pulse width modulation (PWM) for speed control and digital command for direction control. The GPS module is applied to identify the position, while an automatic Paddle Wheel Aerator measures the data. The GPS module is connected to the controller on the I2C protocol. The Real Time Clock (RTC) module is used for time stamping when data has already been obtained. In addition, this automatic water quality monitoring boat is equipped with a radio control system in the event the boat needs to reach a specific location. Farmers can also use the joystick to guide the boat to the point at which they want to measure the water quality. Therefore, farmers can switch to manual mode or auto mode depending on the application
2.5 Energy computation for the Paddle Wheel Aerator
The off-grid system is designed to suit the Paddle Wheel Aerator’s electrical power. Electric power should be reserved to about 10–25% of the system due to the deterioration in efficiency of solar panels and batteries deteriorating with age. The sum of the power required by the load in one day by multiplying the power of each load by the time spent in hours is as follows:
$W_{\text {load }}=\sum\left(P_i \times t\right)$ (4)
where, Wload is the total power of the loads used in a day (watt-hour), Pi is the power of each load (watt), and t is the period of use (hour). The total power of all loads is 644 watts, consisting of two 250-watt electric motors and a 144-watt water pump. The calculation of solar panel power depends on many factors, such as temperature, light intensity, dust on the solar panel, solar cell degradation, etc. The power calculation for solar panels is calculated from the total power of all loads and other factors as follows:
$P_{\text {solar cell }}=\frac{W_{\text {load }} \times O S F}{P S H \times \eta_{\text {dirty }} \times \eta_{\text {temp }} \times \eta_{\text {charger }} \times \eta_{\text {tolerance }}}$ (5)
where, Psolar cell is the solar panel power (watt), Wload is the total power of loads used in a day (watt-hour), OSF is the Over Size Factor, PSH is the Peak Sun Hour, ƞdirty is the efficiency of dirty solar panels, ƞtemp is the temperature efficiency (a temperature higher than 25 ºC in standard conditions, resulting in a decrease in the power of the solar panel), ƞcharger is the efficiency of the charger, and ƞtolerance is the tolerance provided by the manufacturer.
The appropriate size of the solar charger can be calculated from the power of the solar panel multiplied by the safety factor, which is usually equal to 1.25 as follows:
$P_{\text {charger }}=P_{\text {solarcell }} \times S F$ (6)
where, Pcharger = size of the solar charger (Ampere), Psolar = power of the solar panel (Watts), and SF = safety factor.
Battery capacity refers to the total electrical energy of the load calculated together with other factors as follows:
Battery Capacity $=\frac{W_{\text {load }}}{V_{\text {battery }} \times D O D}$ (7)
where, Battery Capacity = the capacity of the battery (Amp-hours), Wload = total electrical energy of the load used in a day (watt-hours), Vbattery = voltage of the battery (volts), and DOD = battery discharge value (percentage). The battery size should be designed close to or greater than calculated. The solar cell system is off-grid by calculating the selection of equipment according to the theory mentioned above. Table 2 shows the devices used for the solar cell system to supply the Paddle Wheel Aerator.
Table 2. Experimental animas used for this study
|
Power Supply Device |
Range |
|
Solar Panel |
12 V 130 W |
|
Solar Charger |
360 W |
|
Battery |
12 V 85 A-hr |
2.6 IoT implementation
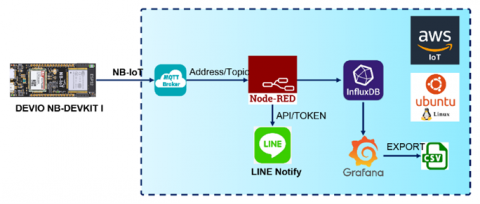
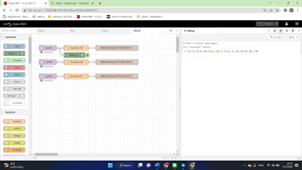
To accommodate farmers with everywhere monitoring, mobile applications should be comfortable and friendly for general users. With more than 15 million users in Thailand, LINE, a mobile messaging application, has the greatest market share of messaging applications over the internet protocol. LINE Notify is a service that enables users to access a web service and receive notifications from the LINE official account provided by LINE. Therefore, water quality measured y sensors over the internet capable of alerting shrimp farmers to the online monitor environment can be accessed off-site. The MQTT is a publish-and-subscribe protocol, meaning that instead of communicating with a server, client devices and applications publish and subscribe to topics handled by a broker [27]. These topics contain all the data indicated by sensors and are subsequently accessed when a Thing subscribes to them. Utilizing the MQTT protocol, the DEVIO NB-DEVKIT 1 wirelessly publishes all water quality values. This enables farmers to receive notifications. These values are directed to an MQTT broker and relayed to Node-RED, a web server. This transmission occurs based on the topic encrypted by the authenticator, as shown in Figure 5. The DEVIO NB-DEVKIT1, a low-power networking device, is capable of uploading data at 62.5 kbps and downloading at 26.15 kbps. It supports multiple communication formats such as TCP, UDP, MQTT, HTTP, etc. For this research, MQTT communication has been chosen due to its secure data transmission. Node-RED is an open-source programming tool utilized for creatively and conveniently interfacing hardware devices, APIs, and online services [28]. A program written on Node-RED for passing data is described in Figure 6. Moreover, the Node-RED water quality values are collected on Influx DB for the real-time database [29] and can be displayed in trend analysis via Grafana, an open-source web application, and exported to a CSV log file.
The novelty of the presented article is the use of real-time reports on water quality in shrimp ponds for farmers and the ability to retrieve historical values through the MQTT protocol, Web application, and Line notify [9].
Figure 5. Online monitoring and real-time data logger
Figure 6. Programming using Node-RED as a web server
2.7 Algorithms
Algorithm 1: Reading water quality value algorithm on DEVIO NB-DEVKIT 1
|
If the 485 port is available for ESP8266 communication if I2C port is available for sensors for data reading in each sensor, do pH data reading EC data reading Temperature data reading DO data reading ORP data reading end end Turbidity data reading from analog input Convert all data to float Send all data sensors from ESP8266 to DEVIO NB-DEVKIT 1 end Publish the topics that contain the package to the broker. |
The DEVIO NB-DEVKIT 1 program initializes the RS-485 communication setup only for data packages from the ESP8266. The ESP8266 waits for an I2C port to receive data from all useful sensors, including the analog port. Algorithm 1 is used for data acquisition from all sensors, pH, EC, temperature, DO, and turbidity, into DEVIO NB-DEVKIT 1.
2.8 Cost analysis
The production cost of the proposed system is expressed in Table 3, although no maintenance costs are included. The production cost will be reduced by 70% once industry-level manufacturing begins and a custom-designed Paddle Wheel Aerator, along with customized device fabrication is used. Furthermore, mass production will also contribute to cost reduction [30]. The wholesale prices for all the components listed in Table 3 are applicable for mass production.
Table 3. Implementation cost of the proposed system
|
Components |
Cost in USD |
|
Solar Panel 350 W |
100.43 |
|
Solar Charger 360 W |
22.38 |
|
Battery 12 V 85 Ahr |
70.30 |
|
Paddles |
9.75 |
|
Buoy |
16.93 |
|
DC Motors 12V 250W |
25.82 |
|
LiDAR |
103.03 |
|
Motor Driver |
57.36 |
|
Controlling + IoT Unit |
60.24 |
|
pH Sensor |
149.99 |
|
Temperature Sensor |
29.99 |
|
Turbidity Sensor |
7.09 |
|
Dissolved Oxygen Sensor |
230.99 |
|
ORP Sensor |
69.50 |
|
EC + Salinity Sensors |
199.99 |
3.1 Verification of Paddle Wheel Aerator movement and position
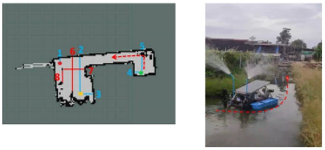
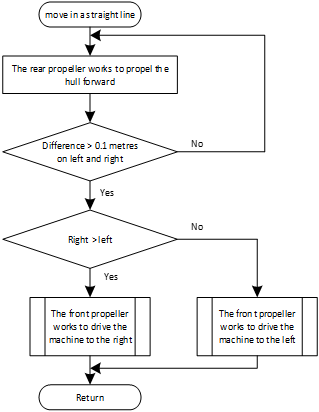
The automatic Paddle Wheel Aerator’s movement was tested along the canal to verify the functionality of LiDAR. As can be observed from Figure 7, it was set to automatically move in a straight line for approximately 50 meters along the canal and then turn left. Its trajectory was mapped to confirm the movement. The Paddle Wheel Aerator exhibited the ability to balance the hull when moving in the middle of the canal. The working condition starts by checking the distance from the Paddle Wheel Aerator to the embankment, with the two sides of the Paddle Wheel Aerator not exceeding the specific value. If the difference in distance is within the specified range, the front propeller will not work. If the difference in distance is greater than the limit point, the Paddle Wheel Aerator considers whether the left or right distance is greater, and then its front impeller works towards that side to propel and balance the Paddle Wheel Aerator body, thereby retaining its position in the middle of the canal to avoid colliding with the embankment. The function is indicated by the flowchart in Figure 8. Table 4 shows the error in the distance measured by the LiDAR laser scanner compared to the actual distance. The maximum error measured was 11.76%, and the minimum error was 0.77%. The average error of 5.36% was considered to be sufficient for use with the proposed water quality measuring vessels.
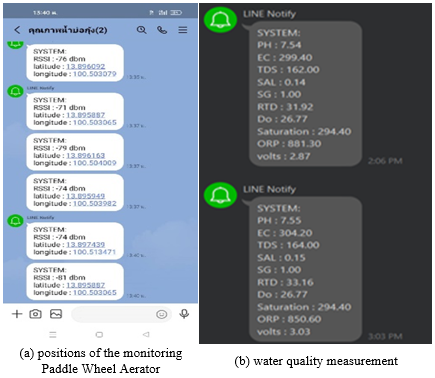
In addition, the water quality monitoring Paddle Wheel Aerator was tested to locate the vessel via a GPS module when immersed in the marine shrimp pond according to the positions indicated by Figure 7. Table 5 shows its location in the format of longitude and latitude. The distance of the GPS error was about 5 meters.
Figure 7. Movement of the boat along the canal to verify the functionality of LiDAR
Figure 8. Flowchart of boat movement
Table 4. LiDAR measurement error
|
Point |
Actual Distance (m) |
Measured Distance (m) |
Error (%) |
|
1 |
1.3 |
1.31 |
0.77 |
|
2 |
1.7 |
1.66 |
2.35 |
|
3 |
0.47 |
0.51 |
8.51 |
|
4 |
0.85 |
0.90 |
5.88 |
|
5 |
0.34 |
0.38 |
11.76 |
|
6 |
1.55 |
1.60 |
3.22 |
|
7 |
0.83 |
0.80 |
8.43 |
|
8 |
3.03 |
3.09 |
1.98 |
Table 5. Location of water quality monitoring Paddle Wheel Aerator in the marine shrimp pond
|
Point |
RSSI (dbm) |
Latitude |
Longitude |
|
1 |
-76 |
13.896092 |
100.503079 |
|
2 |
-71 |
13.895887 |
100.503065 |
|
3 |
-79 |
13.896163 |
100.504009 |
|
4 |
-74 |
13.895949 |
100.503982 |
|
5 |
-74 |
13.897439 |
100.513471 |
|
6 |
-80 |
13.895887 |
100.503065 |
|
7 |
-81 |
13.896112 |
100.503056 |
|
8 |
-81 |
13.896078 |
100.503089 |
3.2 Water quality monitoring
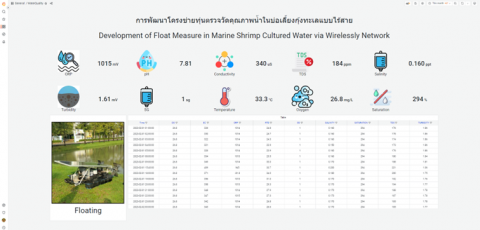
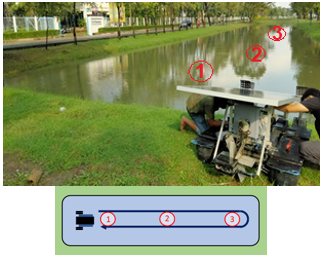
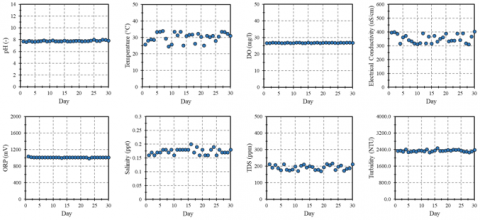
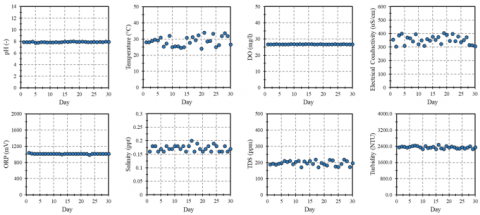
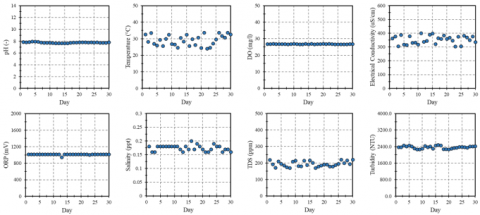
To evaluate the performance of the proposed measurement in marine shrimp cultured water via a wireless network, an experiment was conducted. An online measurement with water quality sensors installed was established. The pH, temperature, DO, EC, ORP, and turbidity were measured online and recorded on a web application in real time. Figure 9 illustrates the monitoring of these values via the web application displayed in the chart view. To fulfill all these requirements, web technologies were implemented with node.js [31], a well-known JavaScript runtime environment. The results of the proposed system for recording and displaying water quality data can be monitored via mobile phone, tablet, or computer. The water quality data are displayed in the form of text and table, with the color of the data divided into green, orange, and red, representing the normal, cautious, and critical status, respectively. The automatic wireless water quality measurement on the Paddle Wheel Aerator was evaluated by a remote controller, as shown in Figure 10. The Paddle Wheel Aerator moved from the first point to the second and third points, respectively. Locations 1, 2, and 3 in Figure 10 were approximately positioned so that the Paddle Wheel Aerator reached the online measurement of multiple locations. Every position the robot passed through could publish the package to the broker without interruption. Water quality data was sent every hour via the NB-IoT device (DEVIO NB-DEVKIT 1). Figure 11, Figure 12, and Figure 13 represent pH, temperature, DO, electrical Conductivity, ORP, salinity, TDS, and turbidity over 30 recorded dates at locations 1, 2, and 3, respectively. These details can be accessed at any time and from anywhere, thus enabling the farmers to understand the water quality and plan their cultivation accordingly in real-time. From the experimental information collected, 90 examples were selected relating to the time periods from 16:00 to 17:00 due to the marine shrimp culture [32]. They represent the trend graph of pH, temperature, DO, electrical Conductivity, ORP, salinity, TDS, and turbidity across positions 1, 2, and 3 within the marine shrimp pond over a 30-day period while maintaining the temperature values maintained at around 33–34℃. The TDS, EC, DO, ORP, pH, salinity, and turbidity were measured at between 170 and 220, 300 and 400, 26 and 27, 900 and 1100, 7.5 and 8.1, 0.15 and 0.2, and 2200 and 2500, respectively. These values do not represent the best conditions because the farm is an outdoor type, with the data recorded during the summer season when the heat from the sun results in a high ambient temperature. Significantly, the pH values were maintained at a good range of between 7.8 and 8, the DO values were controlled to be stable at about 26 to 27 mg/l, providing good conditions for shrimp growth.
Figure 9. pH, temperature, DO, Conductivity, ORP, Salinity, TDS, and turbidity via the web application
Figure 10. Development of a wireless water quality monitoring system on the robot
Figure 11. pH, temperature, DO, Conductivity, ORP, Salinity, TDS, and turbidity at location 1
Figure 12. pH, temperature, DO, Conductivity, ORP, Salinity, TDS, and turbidity at location 2
Figure 13. pH, temperature, DO, Conductivity, ORP, Salinity, TDS, and turbidity at location 3
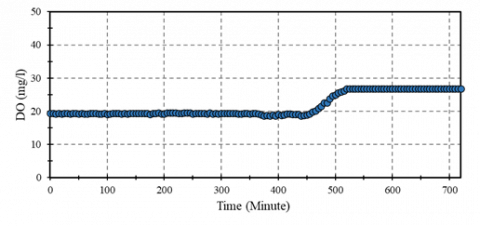
Figure 14 represents the performance of dissolved oxygen control via the Automatic Paddle Wheel Aerator. The experiment was conducted to compare the case with and without the usage of the Paddle Wheel Aerator. The testing time covered between 06.00 am and 06.00 pm, which was a total of 720 minutes. The Paddle Wheel Aerator was stopped from starting to the time had passed 360 minutes, the DO value monitored by our system was about 19 mg/l, which was low obviously in order to keep productive shrimp farming. After that time, the aerator was started, and the DO value rose to maintain between 26 and 27 mg/l, which was proper for shrimp farming. These results reflect that our Paddle Wheel Aerator can enhance the oxygen in the water to an appropriate level for shrimp farming. Therefore, the automatic mobility concept of the aerator has the possibility to keep the DO level covering the area of interest. Also, the water quality in almost all areas was able to be monitored remotely via a wireless sensor system.
The notification system for water quality information provides results every hour, with the system immediately sending a notification message to the farmer’s mobile phone through the LINE application, as shown in Figure 15.
Figure 14. The result of the DO value affected by the automatic Paddle Wheel Aerator
Figure 15. Notification screen
3.3 Evaluation
The proposed water quality monitoring Paddle Wheel Aerator was evaluated using the tiger pawn culture at a private tiger pawn farm in Samutsongkarm, Thailand, during the complete tiger pawn farming process (30 days). In order to measure the fruitfulness of this monitoring system, the weight, and length of the tiger pawn cultivated at the first farm, which the proposed system applied was compared with those cultured at the second farm, which was manually monitored. The total area of each farm was approximately 1600 square meters. The results revealed that the tiger pawn cultivated at the first farm reached a larger size (18–20 cm) and weight (40 g) than those cultivated in the second farm (18–19 cm and 38 g, respectively). However, water quality measurement with the proposed system can provide more convenience and a larger number of sample measurement points than the manual method. It encourages the confidence of productivity guarantee and disease protection.
3.4 Data analysis of water quality
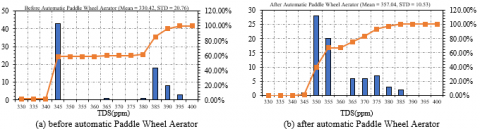
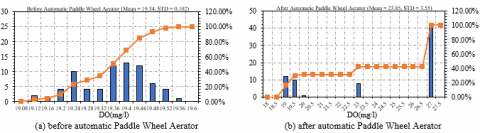
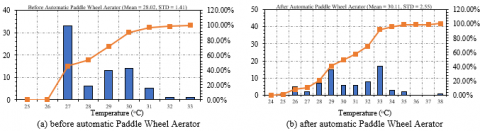
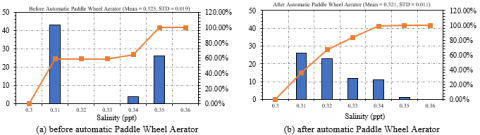
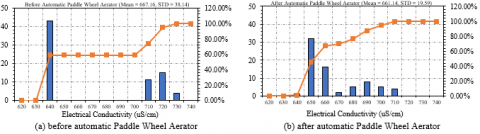
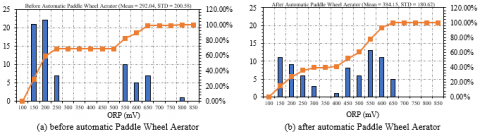
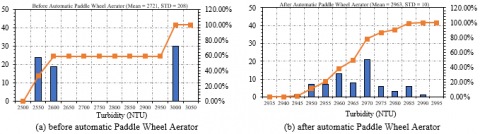
This topic is about processing the information obtained from the evaluation of the previous topic. The measurement data were analyzed and compared before and after the installation of the proposed system. Figures 16-23 are a representation of the distribution and cumulative frequency of the sensor readings. Figure 16 is the pH measurement distribution. In a situation before testing the proposed automatic Paddle Wheel Aerator, the average value is 7.45, and the standard deviation is 0.04, as shown in Figure 16 (a). Figure 16 (b), the condition after treatment by the aerator, had 7.86 of the mean and 0.071 of the standard deviation. The comparison shows that the concentration had a slightly higher pH than the typical environment. The increase in pH value after the application of the proposed system does not have a significant effect on the increase. The increase in pH value may be due to the sedimentation conditions of the shrimp feed. Figure 17 (a) and Figure (b) are before and after the test. From observation, it can be seen that the TDS value changed significantly after the test. The mean and standard deviation before the test were 330.43 ppm and 20.76 ppm, respectively. The mean and standard deviation after the test were 357.04 ppm and 10.53 ppm. In the case of DO, the automatic Paddle Wheel Aerator directly affected the Oxygen increase in the shrimp pond while the aerator was moving. After the test, the mean significantly increased from 19.34 mg/l to 23.85 mg/l as shown in Figure 18 (a) and (b). However, when considering the standard deviation, the standard deviation after the test had greater variance than before the test. The reason for this is due to the temporary creation of oxygen in the pond, and thus, its distribution is different. For the temperature case, the aerator did not affect the temperature in the shrimp pond as shown in Figure 19 (a) and (b). The temperature values were directly affected by the weather conditions around the shrimp ponds. Next, like temperature, salinity also did not depend on the automatic Paddle Wheel Aerator. The mean of before and after the test was 0.325 ppt and 0.321 ppt, respectively. Both values were similar, as shown in Figure 20 (a) and (b). The electrical conductivity values before and after the test were 667.16 uS/cm and 661.14 uS/cm as shown in Figure 21 (a) and (b). When evaluating the mean value, it was not different. This implied that the electrical conductivity did not change significantly after testing the automatic Paddle Wheel Aerator. The ORP value measured after the test was highly increased because the automatic Paddle Wheel Aerator while moving, was able to excite Oxidation-reduction potential in the water. The mean before the test was 294.04 mV, and that after the test was 384.15 mV as shown in Figure 22 (a) and (b). The turbidity, after the automatic Paddle Wheel Aerator was moving in the shrimp pond, was higher than the normal condition. This output was confirmed in Figure 23 (a) and (b). The turbidity value before the test was 2721 (NTU), and the value after the test was 2963 (NTU).
On the whole of the pre-and post-test comparisons, the following conclusions can be drawn. The salinity of the water remained unchanged before and after the test. The turbidity value of the water increased after the paddle wheels hit the water. The automatic Paddle Wheel Aerator did not affect to electrical conductivity of water. Water temperature was directly influenced by environmental heat which was not related to the paddle wheels. DO and ORP were changed significantly after the test because the paddle wheels as they rotate increased the oxygen content of the water. Therefore, the increased oxygen value from the proposed automatic Paddle Wheel Aerator has a positive effect on the growth of shrimp, which is also consistent with research that has been presented previously [33].
Figure 16. Comparison of PH
Figure 17. Comparison of TDS
Figure 18. Comparison of DO
Figure 19. Comparison of temperature
Figure 20. Comparison of salinity
Figure 21. Comparison of electrical conductivity
Figure 22. Comparison of ORP
Figure 23. Comparison of turbidity
3.5 Movement test
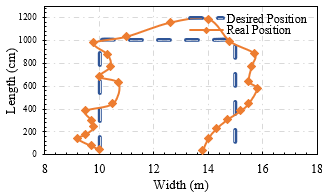
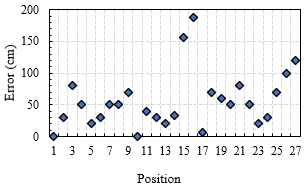
The experiment began with programming the automatic Paddle Wheel Aerator to specify a desired position and later allowing it to follow the path defined above. The designated path had a distance of ten meters from the starting point and ten meters on the way back. The position was obtained by the lidar, which measured the distance around the automatic Paddle Wheel Aerator. Validation of the automatic Paddle Wheel Aerator movement is shown in Figure 24. The measured deviation relative to the specified path is shown in Figure 25. The average error is approximately 55 cm. When considering the accuracy of the position control, the measured position has inaccurate results. The automatic Paddle Wheel Aerator’s position control should be improved.
Figure 24. Comparison of the desired position and real position
Figure 25. The error of the automatic Paddle Wheel Aerator movement
In the future, this research will be developed so that the robot can move back and forth on its own because farmers still have to start the automatic Paddle Wheel Aerator, which will also affect their working hours. Artificial intelligence (AI) systems may have to be used to help the automatic Paddle Wheel Aerator make decisions.
Moreover, the localization algorithm for improving the automatic Paddle Wheel Aerator’s position will be studied.
This paper proposes the automatic Paddle Wheel Aerator and the use of multiple points for water quality monitoring in a marine shrimp farm installed on a Paddle Wheel Aerator. The Paddle Wheel Aerator can move automatically and remotely to reach the position where the farmer wishes to increase dissolved oxygen and analyze the water quality. It can localize its position using the installed GPS and LiDAR pathfinder. The movement of the Paddle Wheel Aerator can be controlled to measure the water quality: ORP, turbidity, pH, SG, conductivity, temperature, oxygen, and salinity of each determined location within the marine shrimp pond. While moving on the pond, the Paddle Wheel Aerator automatically measures the water quality and sends a data package at the specified time every hour to the database, enabling real-time data display and the generation of historical reports via the LINE Notify application. This allows farmers to prepare and plan to improve the water quality of marine shrimp culture in their ponds more conveniently and efficiently. The water quality monitoring Paddle Wheel Aerator can work well in marine shrimp ponds covering an area of at least 40 square meters.
This research was funded by the Faculty of Engineering, King Mongkut’s University of Technology North Bangkok Contract No. ENG-64-82.
The authors would like to thank the Thai Royal Irrigation Department for facilitating the prototype automatic Paddle Wheel Aerator.
[1] https://www.fisheries.go.th/strategy/fisheconomic/pages/fish%20shrimp.html.
[2] Simbeye, D.S., Zhao, J., Yang, S. (2014). Design and deployment of wireless sensor networks for aquaculture monitoring and control based on virtual instruments. Computers and Electronics in Agriculture, 102: 31-42. https://doi.org/10.1016/j.compag.2014.01.004
[3] Shi, B., Sreeram, V., Zhao, D., Duan, S., Jiang, J. (2018). A wireless sensor network-based monitoring system for freshwater fishpond aquaculture. Biosystems Engineering, 172: 57-66. https://doi.org/10.1016/j.biosystemseng.2018.05.016
[4] Rosaline, N., Sathyalakshimi, S. (2019). IoT based aquaculture monitoring and control system. Journal of Physics: Conference Series, 1362(1): 012071. https://doi.org/10.1088/1742-6596/1362/1/012071
[5] Uddin, M.A., Dey, U.K., Tonima, S.A., Tusher, T.I. (2022). An IoT-based cloud solution for intelligent integrated rice-fish farming using wireless sensor networks and sensing meteorological parameters. In 2022 IEEE 12th Annual Computing and Communication Workshop and Conference, Las Vegas, USA, pp. 568-573. https://doi.org/10.1109/CCWC54503.2022.9720860
[6] Sung, W.T., Isa, I.G.T., Hsiao, S.J. (2024). Integrated aquaculture monitoring system using combined wireless sensor networks and deep reinforcement learning. Sensors and Materials, 36(3): 1019-1033. https://doi.org/10.18494/SAM4660
[7] Rastegari, H., Nadi, F., Lam, S.S., Ikhwanuddin, M., Kasan, N.A., Rahmat, R.F., Mahari, W.A.W. (2023). Internet of Things in aquaculture: A review of the challenges and potential solutions based on current and future trends. Smart Agricultural Technology, 4: 100187. https://doi.org/10.1016/j.atech.2023.100187
[8] Barua, D., Hossain, M.S. (2019). Environmental impacts of commercial shrimp farming in coastal zone of Bangladesh and approaches for sustainable management. International Journal of Environmental Sciences & Natural Resources, 20(3): 84-92. https://doi.org/10.19080/IJESNR.2019.20.556038
[9] Iber, B.T., Kasan, N.A. (2021). Recent advances in Shrimp aquaculture wastewater management. Heliyon, 7(11). https://doi.org/10.1016/j.heliyon.2021.e08283
[10] Nicholson, J.K., Connelly, J., Lindon, J.C., Holmes, E. (2002). Metabonomics: A platform for studying drug toxicity and gene function. nature reviews drug discovery, 1(2): 153-161. https://doi.org/10.1038/nrd728
[11] Salah Uddin, M., Fatin Istiaq, M., Rasadin, M., Ruhel Talukder, M. (2020). Freshwater shrimp farm monitoring system for Bangladesh based on internet of things. Engineering Reports, 2(7): e12184. https://doi.org/10.1002/eng2.12184
[12] Mandap, J.P., Sze, D., Reyes, G.N., Dumlao, S.M., Reyes, R., Chung, W.Y.D. (2018). Aquaponics ph level, temperature, and dissolved oxygen monitoring and control system using raspberry pi as network backbone. In TENCON 2018-2018 IEEE Region 10 Conference, Jeju, Korea (South), pp. 1381-1386. https://doi.org/10.1109/TENCON.2018.8650469
[13] Wang, C., Li, Z., Wang, T., Xu, X., Zhang, X., Li, D. (2021). Intelligent fish farm—The future of aquaculture. Aquaculture International, 1-31. https://doi.org/10.1007/s10499-021-00773-8
[14] Kustija, J., Andika, F. (2021). Control-monitoring system of oxygen level, Ph, temperature and feeding in pond based on IoT. REKA ELKOMIKA: Jurnal Pengabdian Kepada Masyarakat, 2(1): 1-10. https://doi.org/10.26760/rekaelkomika.v2i1.1-10
[15] Sneha, P.S., Rakesh, V.S. (2017). Automatic monitoring and control of shrimp aquaculture and paddy field based on embedded system and IoT. In 2017 International Conference on Inventive Computing and Informatics (ICICI), Coimbatore, India, pp. 1085-1089. https://doi.org/10.1109/ICICI.2017.8365307
[16] Bórquez López, R.A., Martinez Cordova, L.R., Gil Nuñez, J.C., Gonzalez Galaviz, J.R., Ibarra Gamez, J.C., Casillas Hernandez, R. (2020). Implementation and evaluation of open-source hardware to monitor water quality in precision aquaculture. Sensors, 20(21): 6112. https://doi.org/10.3390/s20216112
[17] Orozco-Lugo, A.G., McLernon, D.C., Lara, M., Zaidi, S.A.R., González, B.J., Illescas, O., Pérez-Macías, C.I., Nájera-Bello, V., Balderas, J.A., Pizano-Escalante, J.L., Perera, C.M., Rodríguez-Vázquez, R. (2022). Monitoring of water quality in a shrimp farm using a FANET. Internet of Things, 18: 100170. https://doi.org/10.1016/j.iot.2020.100170
[18] Itano, T., Inagaki, T., Nakamura, C., Hashimoto, R., Negoro, N., Hyodo, J., Honda, S. (2019). Water circulation induced by mechanical aerators in a rectangular vessel for shrimp aquaculture. Aquacultural Engineering, 85: 106-113. https://doi.org/10.1016/j.aquaeng.2019.03.006
[19] ENV-40-pH, pH Probe, Datasheet Manual. AtlasScientific Environmental Robotics, 2019.
[20] Bekmezci, I., Sahingoz, O.K., Temel, Ş. (2013). Flying ad-hoc networks (FANETs): A survey. Ad Hoc Networks, 11(3): 1254-1270. https://doi.org/10.1016/j.adhoc.2012.12.004
[21] ENV-40-DC, Dissolved Oxygen Probe, Datasheet Manual. AtlasScientific Environmental Robotics, 2019.
[22] Technical information, condumax CLS16 and CLS16D. Endress+Hauser, 2010.
[23] ORP (Oxidation reduction potential). https://www.neonics.co.th/water-quality-testing/what-is-orp-oxidation-reduction-potential.html, 2023.
[24] https://legatool.com/wp/78/.
[25] Thong-un, N., Hirata, S., Orino, Y., Kurosawa, M.K. (2015). A linearization-based method of simultaneous position and velocity measurement using ultrasonic waves. Sensors and Actuators A: Physical, 233: 480-499. https://doi.org/10.1016/j.sna.2015.07.029
[26] https://www.arduitronics.com/product/4324/sparkfun-gps-dead-reckoning-breakout-neo-m8u-qwiic-sparkfun-usa.
[27] Thong-un, N., Wongsaroj, W. (2022). Productivity enhancement using low-cost smart wireless programmable logic controllers: A case study of an oyster mushroom farm. Computers and Electronics in Agriculture, 195: 106798. https://doi.org/10.1016/j.compag.2022.106798
[28] Sangsuwan, T., Thong-un, N., Pudchuen, N., Runglin, K., Wongsaroj, W. (2022). The failure protection of wireless-based IIoT technology for fluid level control systems. Trends in Sciences, 19(7): 3199-3199. https://doi.org/10.48048/tis.2022.3199
[29] Adarsh, J.K., Sreedevi, V.T., Deepa, T. (2023). Product review system with BERT for sentiment analysis and implementation of administrative privileges on Node-RED. IEEE Access. 11: 65968-65976. https://doi.org/10.1109/ACCESS.2023.3275738
[30] Nickels, W.G., McHugh, J.M., McHugh, S.M. (2019). Understanding Business. McGraw-Hill.
[31] Chitra, L.P., Satapathy, R. (2017). Performance comparison and evaluation of Node. js and traditional web server (IIS). In 2017 International Conference on Algorithms, Methodology, Models and Applications in Emerging Technologies, Chennai, India, pp. 1-4. https://doi.org/10.1109/ICAMMAET.2017.8186633
[32] Carbajal-Hernández, J.J., Sánchez-Fernández, L.P., Carrasco-Ochoa, J.A., Martínez-Trinidad, J.F. (2012). Immediate water quality assessment in shrimp culture using fuzzy inference systems. Expert Systems with Applications, 39(12): 10571-10582. https://doi.org/10.1016/j.eswa.2012.02.141
[33] Taparhudee, W., Benjaprasertsri, M., Sattiti, B. (2007). Comparative study on paddle-wheel aerators using electric motors and diesel engines in Pacific white shrimp (Litopenaeus vannamei) culture ponds. Agriculture and Natural Resources, 41(3): 522-530. https://li01.tci-thaijo.org/index.php/anres/article/view/244276.