Fredy Sumasto*![]() | Yesaya Abdi Nugroho
| Yesaya Abdi Nugroho![]() | Edwin Sahrial Solih
| Edwin Sahrial Solih![]() | Abdul Wahid Arohman
| Abdul Wahid Arohman![]() | Desy Agustin
| Desy Agustin![]() | Al Kautsar Permana
| Al Kautsar Permana![]()
© 2024 The authors. This article is published by IIETA and is licensed under the CC BY 4.0 license (http://creativecommons.org/licenses/by/4.0/).
OPEN ACCESS
This article presents the results of research related to measurement system improvement in the manufacturing process of part box 2ph (luggage box on a motorbike). The research used an integrated approach of Failure Mode and Effect Analysis (FMEA) and Measurement System Analysis (MSA) to identify and address critical measurement failures. Begin by identifying potential failure modes in the manufacturing process through FMEA, prioritizing high-risk failure modes, and then align these with critical measurements for subsequent evaluation. Implement MSA on the identified critical measurements, ensuring the measurement system's reliability and precision, and use the integrated results to guide corrective actions and improvements, creating a synchronized approach to enhance overall process quality. The limitation of integrating FMEA and MSA that focuses only on measurement involves limitations in addressing non-measurement aspects of potential failures, such as design issues, overall process variability, and qualitative aspects, so it may not provide a holistic picture related to the risk of failure in manufacturing processes. Key findings showed that errors in the measuring instruments, recorded on the measurement check sheets, were the focal point of urgent improvement. Root cause analysis implicated factors such as errors at the start of the project and lack of confirmation from the measurement department. In response, key initiatives involved full calibration of measuring instruments, control of the calibration schedule, appraiser training for consistency of skills and perceptions, and additional operators in quality checking and diameter sizing to reduce workload. Prior to improvement, MSA analysis revealed a significant level of uncertainty, with the Gage Repeatability and Reproducibility (GRR) value reaching 76.90%. Implementation of the improvements resulted in a dramatic reduction of GRR to 8.97%, signaling a positive transformation of the measurement system. The previously unacceptable system became reliable, with Number of Distinct Categories (ndc) values reaching 15, indicating consistency in providing information related to process changes. The results of this study provide valuable insights for further development in the manufacturing industry. By focusing on improvement strategies involving strengthening the calibration of measuring instruments, training appraisers, and adding operators, significant improvements in measurement quality and consistency can be achieved. The implications of these findings create a foundation for a proactive, data-driven approach to addressing and preventing measurement failures in manufacturing processes.
automotive part, calibration, Failure Mode and Effect Analysis (FMEA), measurement, Measurement System Analysis (MSA), quality control
In the dynamic landscape of the manufacturing industry, where product quality is paramount for customer satisfaction and sustaining competitiveness [1-5], the precision of measurements emerges as a pivotal factor [6-9]. However, the occurrence of measurement failures poses a formidable challenge, impacting production outcomes [6, 10-13]. Manufacturers of automotive parts also feel this measurement failure. This challenge extends to manufacturers of automotive parts, including the measurement failures observed in part box 2ph, thereby prompting this investigation. In this context, this study aims to investigate and address the problem of measurement failure on part box 2ph in the manufacturing industry. This study will analyse the causes of measurement failure, evaluate the associated risks, and propose solutions to make practical improvements.
These problems encountered in measuring part box 2ph can significantly impact the product's overall quality. Measurement failures can lead to incorrect assessment of part characteristics, resulting in defective products, increased production costs, and loss of customer trust [6, 14-16]. Therefore, it is essential to identify the root causes of measurement failure and develop effective strategies to reduce these risks [17-21]. This study uniquely integrates Failure Mode and Effect Analysis (FMEA) for prioritizing potential measurement failures and Measurement System Analysis (MSA) for evaluating and correcting measurement uncertainties. In this study, the Failure Mode and Effect Analysis (FMEA) approach will be used to analyse and prioritize potential measurement failures [22], as well as Measurement System Analysis (MSA) to evaluate and correct measurement uncertainties.
While prior research has offered valuable insights into measurement and quality within the manufacturing industry, various studies have identified critical factors contributing to measurement failures, encompassing issues such as equipment uncertainty, improper measurement methods, and human error [6, 11, 12, 23]. For instance, an examination of the resistance spot welding process emphasized the significance of selecting appropriate measuring instruments. The study employed multivariate repeatability and reproducibility analysis, revealing that measurements conducted by an image analyzer exhibited superior precision and lower variability compared to conventional mechanical instruments. This underscores the importance of careful instrument selection for accurate and consistent results in welding processes.
Similarly, another study proposed a procedure for evaluating measurement systems through gauge repeatability and reproducibility (GRR). Focusing on the performance assessment of mini-CNC lathe machines, the study utilized average and range analysis as well as analysis of variance (ANOVA) methods. The results demonstrated significant effects of both the part and the interaction between the part and the machine on measured values. The study confirmed that the proposed Measurement System Analysis (MSA) can effectively evaluate machine performance, contributing to the maintenance of product quality.
Additionally, addressing quality measurement issues in the manufacturing industry, a study investigated the internal acceptance but external rejection of products due to potential quality control (QC) checking errors [12]. By applying MSA, the research aimed to identify causes of discrepancies and provide solutions related to people, tools, or supporting factors in the measurement process. The findings of this study can assist companies in enhancing their measurement practices, ensuring more effective, efficient, and consistent measurements, and improving overall quality control.
In the automotive industry, where the failure of the measurement process can have significant consequences for product quality and customer satisfaction [24], these insights from previous studies collectively underscore the critical importance of robust measurement practices. However, synthesizing these findings, this study aims to address the specific gap in literature regarding measurement failures in part box 2ph manufacturing, employing an integrated approach of Failure Mode and Effect Analysis (FMEA) and Measurement System Analysis (MSA). This unique synthesis forms the basis for a comprehensive investigation into the causes, risks, and practical solutions for measurement failures in the specified context.
Measurement system analysis (MSA) is a fundamental tool for assessing the reliability and effectiveness of measurement systems in various industrial processes. The reviewed papers underscored the significance of MSA in the welding, manufacturing, and automotive industries. The findings emphasize the importance of selecting appropriate measuring instruments, evaluating machine performance, identifying measurement-related issues, and implementing improvements to ensure accurate and reliable measurements. Implementing MSA techniques can lead to enhanced product quality, increased customer satisfaction, and improved process efficiency in industrial settings. Future research should explore and refine MSA methodologies to address measurement challenges in diverse industries. In addition, previous research contributions have also proposed solutions such as FMEA and MSA to address quality and measurement issues.
The novelty of this study lies in the integration between FMEA and MSA in dealing with measurement failures on the Part Box 2ph. Research has objectives:
Through risk assessment and risk purging, this research is expected to improve measurement quality and reduce the failure of part box 2ph in the manufacturing industry. This study's most important research contribution is integrating the FMEA and MSA approaches in dealing with failure measurements on part box 2ph. By conducting a risk analysis and evaluating measurement uncertainty, this study will provide a deeper understanding of the causes of measurement failure and appropriate recommendations for improvement. The manufacturing industry can use the results of this study to improve the effectiveness of measurement and overall product quality.
2.1 Research design
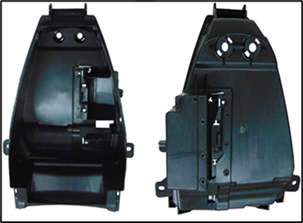
Figure 1. Part box 2ph
The research object in this study is automotive parts, specifically part box 2ph (Figure 1) in the manufacturing industry. The selection of this part is based on its significance in the production process, where measurement failure can have a major impact on the overall product quality [1, 5, 8, 13, 14, 25]. These parts were selected to understand and address the measurement failure issues that may occur during the production process.
2.2 Data and sample
In the execution of FMEA and MSA analyses, meticulous sample selection is imperative to ensure the representativeness and validity of the results. The criteria guiding sample selection are designed to align with the known causes of measurement failure in the automotive parts manufacturing industry.
The selection of automotive parts samples is based on a thoughtful consideration of various characteristics that have been identified as potential contributors to measurement failures. The rationale for these specific criteria, drawing from the known causes of measurement failure, includes:
Additionally, following the guidelines outlined in the Measurement System Analysis Reference Manual Fourth Edition by General Motors [26], sample selection incorporates the use of constants k1, k2, and k3 to further enhance the methodological rigor. These constants contribute to a more systematic and standardized approach in selecting samples for analysis.
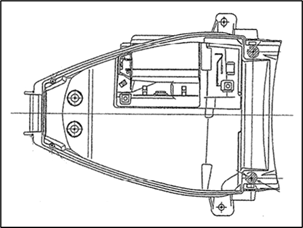
Figure 2. Technical drawing of part box 2ph (top view)
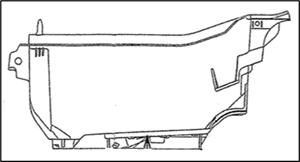
Figure 3. Technical drawing of part box 2ph (side view)
Data collection involved three appraisers conducting three replications for each of the ten parts in point 1 of Part Box 2ph, as illustrated in Figure 2 and Figure 3. This comprehensive approach to sample selection is designed not only to comply with established guidelines but also to align with industry-specific challenges, ensuring the relevance and applicability of the results to the known causes of measurement failure in the automotive parts manufacturing context.
2.3 Research process
FMEA Implementation Steps
Define the scope and members of the multidisciplinary team involved in the FMEA analysis. Identify the measurement process on part box 2ph.
The FMEA team identifies potential failure modes that could occur during the measurement process. Failure modes may include equipment uncertainty, inappropriate measurement methods, or human factors.
Calculate the Risk Priority Number (RPN) value for each failure mode by combining impact, likelihood, and detection. Prioritise failure modes based on the highest RPN value. For the case of this SME, severity (Table 1), occurrence (Table 2), and detection (Table 3) have been determined from the company.
Implement corrective actions based on the RPN prioritisation. These actions may involve equipment improvements, personnel training, or changes in measurement methods.
Table 1. Scale number of severity
|
Scale |
Effect |
Criteria: Severity of Effect |
|
5 |
Catastrophic - Critical |
Critical impact on measurement accuracy leading to severe consequences (RPN 101-200) |
|
4 |
Major - Significant |
Significant impact on measurement accuracy with noticeable consequences (RPN 51-100) |
|
3 |
Moderate - Important |
Moderate impact on measurement accuracy with manageable consequences (RPN 26-50) |
|
2 |
Minor - Minor impact |
Minor impact on measurement accuracy with minimal consequences (RPN 11-25) |
|
1 |
Negligible - Negligible impact |
Negligible impact on measurement accuracy with no consequences (RPN 1-10) |
Table 2. Scale number of occurrence
|
Scale |
Effect |
Criteria: Occurrence of Effect |
|
5 |
Very High - Almost Certain |
Failure is almost certain to occur (O 8-10) |
|
4 |
High - Likely |
Failure is likely to occur (O 5-7) |
|
3 |
Moderate - Occasional |
Failure may occur occasionally (O 3-4) |
|
2 |
Low -Rare |
Failure is rare (O 2) |
|
1 |
Very Low - Almost Never |
Failure is almost never (O 1) |
Table 3. Scale number of detection
|
Scale |
Effect |
Criteria: Detection of Effect |
|
5 |
Very Difficult - Almost Impossible |
Very difficult to detect the failure and take corrective action before it occurs (D 8-10) |
|
4 |
Difficult - Challenging |
Difficult to detect the failure and take corrective action before it occurs (D 5-7) |
|
3 |
Moderate - Possible but Challenging |
Moderate ability to detect the failure and take corrective action before it occurs (D 3-4) |
|
2 |
Easy - Likely |
Easy to detect the failure and take corrective action before it occurs (D 2) |
|
1 |
Very Easy - Almost Certain |
Very easy to detect the failure and take corrective action before it occurs (D 1) |
MSA Analysis Stages
Collect measurement data from a sample of part box 2ph. Ensure that the data includes significant variation. This study did not include further discussion of the potential influence of external variables that might affect the results. This includes factors such as changes in temperature, humidity, or other variability in the production environment that could affect the precision of the measurements, so this is also a limitation of this study.
Use the GRR technique to evaluate the extent to which measurements can be repeated (repeatability) and the extent to which results are consistent between measurers (reproducibility). Calculate the GRR value to assess the performance of the measurement system.
Implement the MSA analysis with the help of specialised software, such as Minitab® Statistical Software. Use the GRR formula mentioned in the draft to calculate the GRR, EV, AV, PV, and TV values. The calculation formula used is based on the following Eqs. (1)-(7):
Repeatability - Equipment Variation (EV):
$E V=\overline{\bar{R}} \times K_1$ (1)
Reproducibility – Appraiser Variation (AV):
$A V=\sqrt{\left(\bar{X}_{D I F F} \times K_2\right)-}\left(E V^2 /(n r)\right)$ (2)
where, n = sample of parts, r = trials.
Repeatability & Reproducibility (GRR):
$G R R=\sqrt{E V^2+A V^2}$ (3)
Part Variation (PV):
$P V=R_p \times K_3$ (4)
Total Variation (TV):
$T V=\sqrt{G R R^2+P V^2}$ (5)
%Total Variation (TV):
$\begin{aligned} \% E V & =100[E V / T V] \\ \% A V & =100[A V / T V] \\ \% G R R & =100[G R R / T V] \\ \% P V & =100[P V / T V]\end{aligned}$ (6)
$n d c=1.41(P V / G R R)$ (7)
Evaluate the results of the MSA analysis to determine whether the measurement system can provide reliable results. If the %GRR and ndc values meet the criteria in Table 4, the system is considered acceptable. Otherwise, identify the cause of the uncertainty and make the necessary improvements. Referring to the results of the improvement, if the variation decreases, it is necessary to control the MSA which needs to be measured at least once every three months.
Table 4. Border value of %GRR and ndc [6]
|
Value |
Description |
|
%GRR < 10% |
Acceptable measuring system. The measuring system provides reliable information about process changes. |
|
10% < %GRR < 30% |
Conditionally acceptable measurement system. It can be used for several applications. |
|
%GRR > 30% |
Unacceptable measurement system. The measuring system does not provide reliable information about process changes. |
|
ndc ≥ 5 |
Acceptable measuring system. The measuring system provides reliable information about process changes. |
|
2 ≤ ndc ≤ 4 |
Generally unacceptable for estimating process parameters and indices since it only provides coarse estimates. Rejected measurement equipment - more sensitive equipment needs to be used. |
|
ndc = 1 |
Unacceptable measurement system. The measuring system does not provide reliable information about process changes. |
3.1 FMEA and MSA integration implementation
The integration of Failure Mode and Effect Analysis (FMEA) and Measurement System Analysis (MSA) proved to be a pivotal approach in addressing and rectifying measurement failures within the part box 2ph manufacturing process. This integration aimed at systematically identifying potential failure modes, assessing their impact on the measurement process, and implementing robust corrective actions using the insights derived from MSA. The following outlines the key steps and outcomes of this integrated approach:
3.1.1 Identification of failure modes and prioritization through FMEA
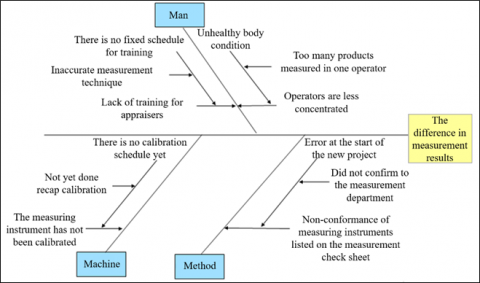
a. Fishbone Analysis (Figure 4): Employed a Fishbone Diagram to categorize failure modes into method, machine, and human factors, identifying three primary influencers on measurement discrepancies. Based on the Fishbone Diagram, there are 3 factors that influence the problem of differences in measurement results, namely the method, machine, and man factors. After analysing the causes of failure using a causal diagram continuing to determine the severity, occurrence, and detection values determined by related parties such as group leaders, leaders, and part measurement operators.
b. Severity, Occurrence, and Detection Assessment: Engaged relevant stakeholders to determine severity, occurrence, and detection values for each failure mode. Based on observations made in the field and brainstorming to determine values for severity, occurrence, and detection regarding Table 5.
c. Risk Priority Number (RPN) Calculation: Computed RPN for each failure mode, highlighting the non-conformance of the measuring instrument on the measurement check sheet as the most critical issue with an RPN of 245. In this case RPN 245, so it falls into the critical category.
Figure 4. Fishbone of measurement failures
Table 5. Assessment results of severity, occurrence, detection
|
Process |
Type of Defect |
Problem |
S |
O |
D |
RPN |
Recommendation Action |
Action Plan |
||
|
Measurement of part box 2ph |
The difference in measurement results |
Non-conformance of measuring instruments listed on the measurement check sheet |
Error at start of new project |
There is no confirmation to the measurement department |
5 |
7 |
7 |
245 |
Perform testing using the MSA method |
Testing with 3 appraisers, 10 products and 3 times replication |
|
Measuring instrument has not been calibrated |
There is no calibration schedule yet |
The recap of the calibration schedule has not been carried out yet |
2 |
3 |
3 |
18 |
Designate a PIC to recap the calibration schedule |
The calibration schedule was recorded by the PIC |
||
|
Lack of training for appraisers |
There is no fixed schedule for training |
There is no training policy yet |
4 |
4 |
5 |
80 |
Submitting training to the company |
Training scheduling is carried out in the measurement process |
||
|
Operators lack concentration |
Unhealthy body condition |
Too many parts measured on a single operator |
2 |
4 |
3 |
24 |
Operators are added for measurements |
Add operators as needed in the measurement section |
||
3.1.2 MSA implementation for critical failure mode
Table 6. Measurement data before improvement
|
Appraiser |
Trial |
Parts |
|||||||||
|
1 |
2 |
3 |
4 |
5 |
6 |
7 |
8 |
9 |
10 |
||
|
1 |
1 |
9.940 |
9.810 |
9.890 |
9.790 |
10.200 |
9.950 |
9.870 |
9.790 |
9.850 |
9.870 |
|
2 |
9.900 |
9.890 |
9.980 |
9.780 |
10.300 |
10.100 |
9.860 |
9.780 |
9.970 |
9.850 |
|
|
3 |
10.200 |
9.870 |
9.970 |
9.800 |
9.820 |
9.900 |
10.100 |
9.800 |
9.870 |
9.820 |
|
|
2 |
1 |
9.960 |
10.320 |
9.970 |
9.790 |
10.200 |
9.980 |
9.860 |
9.780 |
9.880 |
9.850 |
|
2 |
9.970 |
9.980 |
9.950 |
9.810 |
10.300 |
10.200 |
9.850 |
9.810 |
9.860 |
9.830 |
|
|
3 |
9.960 |
10.300 |
10.250 |
9.830 |
9.900 |
9.800 |
9.810 |
9.790 |
9.830 |
9.810 |
|
|
3 |
1 |
9.960 |
9.790 |
9.970 |
9.780 |
10.200 |
9.980 |
9.860 |
9.780 |
9.880 |
9.850 |
|
2 |
9.970 |
9.800 |
9.950 |
9.810 |
10.110 |
10.000 |
9.850 |
9.810 |
9.930 |
9.830 |
|
|
3 |
9.960 |
9.870 |
9.970 |
9.800 |
9.900 |
9.930 |
9.970 |
9.860 |
9.870 |
9.820 |
|
3.1.3 Analysis of measurement system before improvement
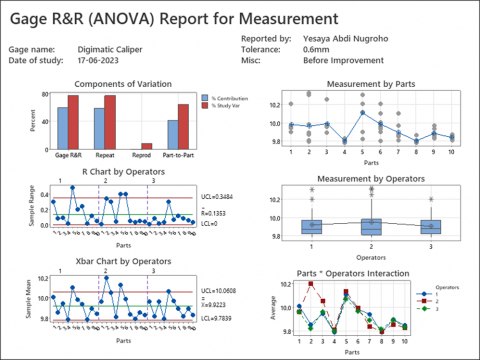
Table 7. GR&R study of 2ph box part diameters for measurement evaluation before improvement
|
Source |
VarComp |
%Contribution (of VarComp) |
StdDev (SD) |
%Study Var (%SV) |
Number of Distinct Categories (ndc) |
|
Total Gage R&R |
0.0118641 |
59.14 |
0.108922 |
76.90 |
1 |
|
Repeatability |
0.0117144 |
58.39 |
0.108233 |
76.41 |
|
|
Reproducibility |
0.0001496 |
0.75 |
0.012232 |
8.64 |
|
|
Operators |
0.0001496 |
0.75 |
0.012232 |
8.64 |
|
|
Part-To-Part |
0.0081981 |
40.86 |
0.090543 |
63.92 |
|
|
Total Variation |
0.0200622 |
100.00 |
0.141641 |
100.00 |
Figure 5. Results from GR&R analysis of 2ph box part diameters for measurement evaluation before improvement
Under the initial conditions, the GR&R analysis results showed that repeatability was 76.41%, indicating that the variation in measurement on repetition influenced by the measuring instrument was significant. On the other hand, reproducibility was only 8.64%, indicating that the operator's influence on repeatability was not significant.
However, the total GR&R result of 76.90%, exceeding the pre-set value limit, indicates that the measurement system is not acceptable. The ndc analysis with a value of 1 makes it clear that the system does not provide consistent information regarding process changes. Besides that, when the number of distinct categories is less than 2, the measurement system is of no value for controlling the process, because it cannot distinguish between parts.
From an ANOVA perspective, the GR&R percentage was 59.14%, with a part-to-part contribution of 40.86%. Although most of the variation is due to repeatability and reproducibility, the total contribution of GR&R exceeding 30% indicates that the operator's measurement process is not an acceptable system and is unable to distinguish differences in diameter between different parts.
Figure 4 provides an overview of the variance components and standard deviations, showing that most of the variation is due to differences in measurement tools or instruments and between parts. Although most of the points on the X-bar chart are within the control limits, indicating that the measurement variation is mainly due to tool and part differences, the main effect and interaction plots in Figure 5 confirm significant variation due to part and operator.
From these results, improvement of the measurement system is essential. Further evaluation and implementation of changes to the measurement system are required to reduce the variability and improve the system's ability to provide consistent and reliable information regarding the diameter measurement of part box 2ph.
3.2 Analyse results
3.2.1 Identification and implementation of improvement strategies
a. Key Improvement Initiatives: Prioritized the implementation of testing using the MSA method as the primary improvement initiative to address the critical failure mode. Based on the results that have been determined in this study, an improvement was made in the measurement process. The improvement aims to decrease the R&R gauge value in the measurement process.
In order to improve the quality and consistency of the measurement system, several key improvement initiatives can be implemented. Firstly, a critical step that needs to be taken is to conduct a full calibration of measuring instruments and establish a strict calibration schedule. This step will ensure that all measuring instruments are in optimal condition and provide accurate results. Regular periodic calibration will also help detect changes in gauge performance early on, minimising the risk of variations caused by tool changes.
In addition, training of appraisers is an important aspect. This training aims to equalise skills and perceptions between appraisers, ensuring that they have a uniform understanding of measurement procedures. With improved skills and shared understanding, variability in measurement caused by individual differences can be minimised.
The addition of operators in quality checking and diameter sizing is also a strategic initiative. By increasing the number of operators, the workload can be shared more efficiently, preventing fatigue that can affect measurement accuracy. Diversifying operators also opens up opportunities to gain a variety of views and experiences, which can enrich perspectives in assessing quality and diameter size.
In addition, increased transparency and documentation in calibration processes and training can help create a strong track record. This improvement not only supports compliance with quality standards but also provides a solid basis for continuous evaluation and improvement. Comprehensive implementation of these initiatives is expected to bring significant improvements to the measurement system, reduce variability, and increase the accuracy of diameter measurements on part box 2ph.
b. Validation Through Testing: Conducted post-improvement testing by refining the measurement process. The process of validation through testing is a crucial step in the integrated approach of Failure Mode and Effect Analysis (FMEA) and Measurement System Analysis (MSA). In the context of the part box 2ph manufacturing process, this step involves assessing and validating the proposed improvements by implementing the chosen MSA method after identifying the critical failure mode associated with the non-conformance of the measuring instrument. The data was generated after improvement and analysed again using MSA (Table 8).
3.2.2 Analysis of Measurement System after improvement
a. Post-Improvement MSA: Following the implementation of a series of improvements to the measurement system, post-improvement analysis showed a positive evolution in the system's overall performance. Improvements were made through three main initiatives, namely full calibration of measuring instruments and strict management of the calibration schedule, intensive training of appraisers to harmonise skills and perceptions, and the addition of operators in the quality and diameter checking process to reduce workload.
One of the key changes was the implementation of comprehensive calibration of measuring instruments. This measure aims to ensure that all measuring instruments operate at the same level of accuracy and provide consistent results. Strict management of the calibration schedule also ensured that the gauges remained in top condition at all times. The post-repair results showed a significant improvement in repeatability. As such, this measure has made a positive contribution to measurement consistency.
Intensive training of appraisers is a serious effort to ensure that every individual involved in the measurement process has uniform skills and perceptions. This improvement aims to reduce variability caused by individual differences in the interpretation and execution of measurements. Post-improvement results show that this improvement has been successful, with Reproducibility contributing less to total Gage R&R. Operators are now more uniform in their approach to measurement, improving the reliability and accuracy of results.
The addition of operators in quality checking and diameter sizing has had a positive impact in levelling the workload. This improvement not only reduces individual fatigue but also ensures that each measurement is focused and accurate. As such, post-repair results are expected to show a meaningful increase in the Number of Distinct Categories (ndc), confirming the system's ability to distinguish between different parts clearly.
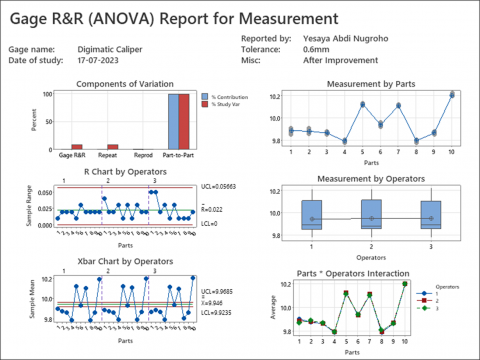
b. Evaluation Metrics: Based on the results of observations after improvements were made, measurement data were obtained by three operators with ten parts, and three replications were carried out. The MSA calculation using the average-range method yields a GRR of 8.97%; with this result, there is a decrease in the R&R gauge value, which was before it reached 76.90%. In addition, after the improvement, it can be concluded that the measurement system is acceptable based on the ndc. The repeatability and reproducibility values are 8.97% and 0%. With this, it can be explained that the error variance caused by the measuring instrument is 8.97%, and the error variance caused by the operator and interaction is 0%. Based on the ndc value, the results of the improvement can be concluded that the measuring system is acceptable. The ndc value of 15 indicates that the measuring system provides reliable information about process changes [6, 26, 29].
Based on the improvements made to the measurement system, the MSA analysis produced findings indicating a significant improvement in overall performance. After the improvements, the GR&R analysis results showed that the repeatability variability was 8.97%, indicating that the measuring device still influenced the variation in the measurement of repeatability. On the other hand, the reproducibility element showed a result of 0%, signalling that the operator's influence on repeatability was not significant.
However, what is interesting is the total GR&R result of 8.97% (Table 9), which indicates that the measurement system is acceptable. The ndc analysis with a value of 15 explains that the system can provide consistent information about process changes.
From an ANOVA perspective, the GR&R percentage is 0.81%, with a part-to-part contribution of 99.19% (Table 9). Although most of the variation is due to variation in parts, the total GR&R contribution being lower than 10% indicates that the operator measurement process is an acceptable system and is able to distinguish diameter differences between different parts.
Figure 5 provides an overview of the variance components and standard deviations, which shows that most of the variation is due to differences between parts. Although most of the points on the Xbar diagram exceed the control limits, indicating that the measurement variation is mainly due to differences between parts, the main effect and interaction plots in Figure 6 confirm the significant variation due to differences between parts.
Overall, the MSA results after refinement show that the refinement efforts have successfully improved measurement consistency and accuracy. Although there are still variations stemming from part differences, the improved measurement system is able to provide consistent and reliable information on changes in the production process. Continuous evaluation and monitoring of the system is necessary to ensure the continued effectiveness of the improvements that have been implemented.
Figure 6. Results from GR&R analysis of 2ph box part diameters for measurement evaluation after improvement
Table 8. Measurement data after improvement
|
Appraiser |
Trial |
Parts |
|||||||||
|
1 |
2 |
3 |
4 |
5 |
6 |
7 |
8 |
9 |
10 |
||
|
1 |
1 |
9.910 |
9.870 |
9.870 |
9.790 |
10.120 |
9.950 |
10.120 |
9.790 |
9.850 |
10.210 |
|
2 |
9.900 |
9.890 |
9.850 |
9.780 |
10.130 |
9.920 |
10.100 |
9.780 |
9.870 |
10.190 |
|
|
3 |
9.900 |
9.870 |
9.870 |
9.800 |
10.120 |
9.930 |
10.100 |
9.800 |
9.870 |
10.190 |
|
|
2 |
1 |
9.910 |
9.890 |
9.870 |
9.780 |
10.120 |
9.950 |
10.120 |
9.780 |
9.880 |
10.210 |
|
2 |
9.870 |
9.880 |
9.850 |
9.810 |
10.130 |
9.920 |
10.110 |
9.810 |
9.860 |
10.200 |
|
|
3 |
9.880 |
9.870 |
9.870 |
9.800 |
10.130 |
9.940 |
10.110 |
9.800 |
9.870 |
10.190 |
|
|
3 |
1 |
9.850 |
9.910 |
9.860 |
9.790 |
10.120 |
9.960 |
10.110 |
9.810 |
9.860 |
10.220 |
|
2 |
9.900 |
9.900 |
9.870 |
9.810 |
10.120 |
9.930 |
10.100 |
9.810 |
9.860 |
10.200 |
|
|
3 |
9.860 |
9.860 |
9.880 |
9.780 |
10.110 |
9.940 |
10.100 |
9.800 |
9.870 |
10.200 |
|
Table 9. GR&R study of 2ph box part diameters for measurement evaluation before improvement
|
Source |
VarComp |
%Contribution (of VarComp) |
StdDev (SD) |
%Study Var (%SV) |
Number of Distinct Categories (ndc) |
|
Total Gage R&R |
0.0001695 |
0.81 |
0.013021 |
8.97 |
15 |
|
Repeatability |
0.0001695 |
0.81 |
0.013021 |
8.97 |
|
|
Reproducibility |
0.0000000 |
0.00 |
0.000000 |
0.00 |
|
|
Operators |
0.0000000 |
0.00 |
0.000000 |
0.00 |
|
|
Part-To-Part |
0.0208904 |
99.19 |
0.144535 |
99.60 |
|
|
Total Variation |
0.0210600 |
100.00 |
0.145120 |
100.00 |
3.3 Discussion
After a series of improvements and enhancements were applied to the measurement system, the results of the MSA analysis showed a positive development in the system's overall performance. These results provide confidence that the improved measurement system can be considered acceptable. This discussion addresses several key aspects that indicate that the measurement system, after the improvements, has reached the desired level of acceptability. Although, there are several potential factors that will affect the results further such as systematic error in the measuring instrument, the pattern of measurement sampling, and the measurement environment.
3.3.1 Impairment of GR&R
It is important to note that the results of the GR&R analysis showed a significant reduction in repeatability variability after the implementation of the improvements. Repeatability, which was 76.41% at baseline, was reduced to 8.97% after the improvement (Table 10). This statement indicates that the influence of the measuring instrument on measurement variation has been significantly minimised. This success can be attributed to improvement measures such as thorough calibration, strict calibration schedule management, and additional operators.
Table 10. Comparison of GR&R Before and after improvement
|
Component of Variation |
Before Improvement |
After Improvement |
|
Gage R&R |
76.90% |
8.97% |
|
Repeatability |
76.41% |
8.97% |
|
Reproducibility |
8.64% |
0.00% |
|
Part to Part |
63.92% |
99.60% |
3.3.2 Increased ndc
The ndc analysis is a key indicator in evaluating the consistency of the measurement system. Before the improvement, ndc was 1, indicating that the system could not provide consistent information about process changes. However, after the implementation of the improvement, ndc increased to 15, reaching the generally accepted threshold. This result provides confidence that the measurement system is now capable of providing reliable and consistent information related to changes in the production process.
3.3.3 Higher part-to-part contribution
While there is still a significant part-to-part contribution to the measurement variability, the improvements that have been implemented successfully manage this contribution to within acceptable limits. The GR&R results show a part-to-part percentage of 99.19%, which, although high, does not hamper the system's ability to distinguish diameter differences between parts. The part-to-part variation shows that the system can capture variations in the product yield produced by the production process. In this case, the urgency of quality measurement has been resolved. However, further improvements can be made in the production process in order to obtain products in accordance with the specifications required by consumers.
3.3.4 ANOVA analyses in support
From an analysis of variance (ANOVA) perspective, the results show that the GR&R percentage after improvement is 0.81%, with a part-to-part contribution of 99.19%. Although most of the variation still comes from part variation, the total GR&R contribution of less than 10% indicates that the current operator measurement process is acceptable and capable of distinguishing diameter differences between parts.
3.3.5 Improved measurement consistency and reliability
With the implementation of the improvements, measurement consistency and reliability improved significantly. This result can be seen from the decreased repeatability values and increased ndc values, confirming that the changes implemented to the measurement system have successfully overcome the main bottlenecks that cause instability and uncertainty in measurement results.
By detailing these achievements, the measurement system after improvement can be considered acceptable. While there is still some degree of variation stemming from differences between sections, the consistent and reliable results of the current measurement system allow the company to gain a better understanding of changes in the production process. The impact of the improvements made resulted in a decrease in checking time on production and a decrease in the number of customer claims to the company by 80%. Continuous measures for monitoring and evaluation are still needed to ensure that the system remains effective in the long term. However, this study has not used sensitivity analysis to illustrate the extent to which a decision will be consistent despite changes in the parameters that affect it.
The research aims to improve the measurement system in the manufacturing process of part box 2ph (motorcycle panniers). This research uses an integrated approach of Failure Mode and Effect Analysis (FMEA) and Measurement System Analysis (MSA) to identify and address critical measurement failures. It starts by identifying potential failure modes in the manufacturing process through FMEA, prioritising high-risk failure modes and aligning them with critical measurements for subsequent evaluation and applying MSA.
In this series of studies, the integration of Failure Mode and Effect Analysis (FMEA) and Measurement System Analysis (MSA) had a significant positive impact on the measurement process of part box 2ph. The critical finding of measuring instrument mismatch on the measurement check sheet, with a Risk Priority Number (RPN) of 245, underlined the urgency and importance of targeted improvement. Root cause analysis showed that this failure was closely related to errors at the start of a new project and a lack of confirmation from the measurement department. This root causes is taken from the results of the fishbone diagram which states that measurement failure is caused by three main factors namely man, machine and method. In addressing the recognised severity, the first project involving testing with the MSA method was identified as a strategic and high-impact initiative to address the underlying causes of measurement discrepancies.
MSA analysis prior to improvement indicated a Gage Repeatability and Reproducibility (GRR) value of 76.90%, exceeding the acceptable threshold. Implementation of improvements that focused on full gauge calibration, controlling the calibration schedule, training appraisers to harmonise skills and perceptions, and adding operators to check quality and diameter size resulted in a notable reduction in the GRR value to 8.97%, which means that the measurement results are acceptable because GRR is less than 10%. The significant reduction of 67.93% in the GRR value, together with the achievement of an acceptable ndc value of 15, signalled the successful transformation of the previously unacceptable measurement system into a reliable and accurate system. As such, this significant change confirms the positive impact and effectiveness of the implemented improvements.
Failure Mode and Effect Analysis (FMEA) and Measurement System Analysis (MSA) methods complement each other in the context of manufacturing process quality improvement. FMEA provides a proactive approach to identifying potential failures in processes, including those related to measurement, by assessing each failure's severity, occurrence, and detectability. Meanwhile, MSA specifically evaluates and improves the performance of measurement systems, ensuring that the data collected is accurate and consistent. The integration of the two becomes particularly effective when there are critical measurement-related failures, where FMEA can identify such failures, and MSA can guide the implementation of strategic fixes to improve the measurement system's performance. This combined approach provides a holistic framework for improving the reliability and accuracy of manufacturing processes with a focus on measurement quality.
Overall, the findings provide important directions for continuous improvement in the manufacturing industry. By emphasising the aspects of full calibration of measuring instruments, controlling the calibration schedule, training appraisers, and adding operators, the risk of measurement failure can be reduced, and the measurement system can become more reliable and accurate. This approach contributes significantly to quality improvement and consistency in the manufacturing process.
The acknowledgements were given to PT Takagi Sari Multi Utama for providing administrative support to the authors and the materials used for the experiment in the case study.
[1] Lutfianto, M.A., Prabowo, R. (2022). Implementation of Six Sigma methods with Failure Mode and Effect Analysis (FMEA) as a tool for quality improvement of newspaper products (Case study: PT. ABC manufacturing–Sidoarjo, East Java–Indonesia). Journal of Integrated System, 5(1): 87-98. https://doi.org/10.28932/jis.v5i1.4615
[2] Akhyar, Z. (2020). A systematic literature review of Failure Mode and Effect Analysis (FMEA) implementation in industries. Indonesian Journal of Industrial Engineering and Management, 2: 59-68. https://doi.org/10.22441/ijiem.v1i2.9862
[3] Kumar, P., Singhal, S., Kansal, J. (2023). How the quality management systems impacts the organizational effectiveness?: Application of PLS - SEM and fsQCA approach. Evergreen: Joint Journal of Novel Carbon Resource Sciences & Green Asia Strategy, 10(2): 626-639. https://doi.org/10.5109/6792808
[4] Susanto, D.A., Suef, M., Karningsih, P.D. (2023). Level of implementation of GMP and SSOP in SMEs wet noodle production process with gap analysis tools. Evergreen: Joint Journal of Novel Carbon Resource Sciences & Green Asia Strategy, 10(1): 510-518. https://doi.org/10.5109/6782155
[5] Sumasto, F., Maharani, C.P., Purwojatmiko, B.H., Imansuri, F., Aisyah, S. (2023). PDCA method implementation to reduce the potential product defects in the automotive components industry. Indonesian Journal of Industrial Engineering & Management, 4(2): 87-98. https://doi.org/10.22441/ijiem.v4i2.19527
[6] Sumasto, F., Nugroho, Y.A., Purwojatmiko, B.H., Wirandi, M., Imansuri, F., Aisyah, S. (2023). Implementation of measurement system analysis to reduce measurement process failures on Part Reinf BK6. Indonesian Journal of Industrial Engineering & Management, 4(2): 212-220. https://doi.org/10.22441/ijiem.v4i2.20212
[7] Saikaew, C. (2018). An implementation of measurement system analysis for assessment of machine and part variations in turning operation. Measurement, 118: 246-52. https://doi.org/10.1016/j.measurement.2018.01.008
[8] Sumasto, F., Arliananda, D.A., Imansuri, F., Aisyah, S., Purwojatmiko, B.H. (2023). Enhancing automotive part quality in SMEs through DMAIC implementation: A case study in Indonesian automotive manufacturing. Quality Innovation Prosperity, 27(3): 57-74. https://doi.org/10.12776/QIP.V27I3.1889
[9] Sumasto, F., Imansuri, F., Agus, M., Wirandi, M. (2020). Sustainable development impact of implementing electric taxis in Jakarta: A cost-benefit analysis. In IOP Conference Series: Materials Science and Engineering, Makassar, Indonesia, 885(1): 012027. https://doi.org/10.1088/1757-899x/885/1/012027
[10] Rękas, A., Kurek, M., Latos, T., Milczanowska, K. (2015). Implementation of FMEA into mass production process to identify and eliminate causes of defects. Key Engineering Materials, 641: 266-277. https://doi.org/10.4028/www.scientific.net/KEM.641.266
[11] Saikaew, C. (2018). An implementation of measurement system analysis for assessment of machine and part variations in turning operation. Measurement, 118: 246-52. https://doi.org/10.1016/j.measurement.2018.01.008
[12] Setyabudhi, A.L., Veza, O., Meldra, D., Abdurahman, N.C., Reza Saputra, M.R. (2021). Penerapan metode Measurement System analysis Gage R&R Pada Pengukuran Produk base plate magazine. Jurnal Rekayasa Sistem Industri, 6: 86-89. https://doi.org/10.33884/jrsi.v6i2.3642
[13] Sumasto, F., Arliananda, D.A., Imansuri, F., Aisyah, S., Pratama, I.R. (2023). Fault tree analysis: A path to improving quality in Part Stay Protector A Comp. Journal Européen des Systèmes Automatisés, 56(5): 757-764. https://doi.org/10.18280/jesa.560506
[14] Doshi, J., Desai, D. (2017). Application of failure mode & effect analysis (FMEA) for continuous quality improvement-multiple case studies in automobile SMEs. International Journal for Quality Research, 11(2): 345-360. https://doi.org/10.18421/IJQR11.02-07
[15] Pop, L.D., Elod, N. (2015). Improving a measuring system according to ISO/TS 16949. Procedia Technology, 19: 1023-1030. https://doi.org/10.1016/j.protcy.2015.02.146
[16] Sharma, J., Tyagi, M., Bhardwaj, A. and Walia, R.S. (2023). Factors assessment for encumbering the implementation of sustainability based lean six sigma practices in food supply chain. Evergreen: Joint Journal of Novel Carbon Resource Sciences & Green Asia Strategy, 10(1): 379-388. https://doi.org/10.5109/6781097
[17] Chi, C.F., Sigmund, D., Astardi, M.O. (2020). Classification scheme for root cause and failure modes and effects analysis (FMEA) of passenger vehicle recalls. Reliability Engineering & System Safety, 200: 106929. https://doi.org/10.1016/j.ress.2020.106929
[18] Victor B. de Souza, R., Cesar R. Carpinetti, L. (2014). A FMEA-based approach to prioritize waste reduction in lean implementation. International Journal of Quality & Reliability Management, 31(4): 346-366. https://doi.org/10.1108/IJQRM-05-2012-0058
[19] Kania, A., Cesarz-Andraczke, K., Odrobiński, J. (2018). Application of FMEA method for an analysis of selected production process. Journal of Achievements in Materials and Manufacturing Engineering, 91(1): 34-40. https://doi.org/10.5604/01.3001.0012.9655
[20] Wessiani, N.A., Sarwoko, S.O. (2015). Risk analysis of poultry feed production using fuzzy FMEA. Procedia Manufacturing, 4: 270-281. https://doi.org/10.1016/j.promfg.2015.11.041
[21] Agarwal, S., Tyagi, M., Garg, R.K. (2023). Circular economy reinforcement to diminish GHG emissions: A grey DEMATEL approach. Evergreen: Joint Journal of Novel Carbon Resource Sciences & Green Asia Strategy, 10(1): 389-403. https://doi.org/10.5109/6781099
[22] Phad, K.S., Hamilton, A. (2022). Experimental investigation of friction coefficient and wear of sheet metals used for Automobile Chassis. Evergreen: Joint Journal of Novel Carbon Resource Sciences & Green Asia Strategy, 9(4): 1067-1075. https://doi.org/10.5109/6625719
[23] Almeida, F.D., De Paula, T.I., Leite, R.R., Gomes, G.F., Gomes, J.H.F., Paiva, A.P., Balestrassi, P.P. (2018). A multivariate GR&R approach to variability evaluation of measuring instruments in resistance spot welding process. Journal of Manufacturing Processes, 36: 465-479. https://doi.org/10.1016/j.jmapro.2018.10.030
[24] Rajput, N.S., Patil, A. (2023). Reducing oil leakage in heavy duty transformers made in small-scale manufacturing industry through six sigma DMAIC: A case study for Jaipur. Evergreen: Joint Journal of Novel Carbon Resource Sciences & Green Asia Strategy, 10(1): 196-211. https://doi.org/10.5109/6781070
[25] Wen, D.P., Liang, X.Y., Su, M.G., Wu, M., Chen, R.L., Zhang, T.C. (2021). Error correction of weak current measurement system based on wavelet denoising and generalized regression neural network. Instrumentation Mesure Métrologie, 20(2): 91-99. https://doi.org/10.18280/i2m.200205
[26] Down, M., Czubak, F., Gruska, G., Stahley, S., Benham, D. (2010). Measurement System Analysis.
[27] Sukma, D.I., Prabowo, H.A., Setiawan, I., Kurnia, H., Fahturizal, I.M. (2022). Implementation of total productive maintenance to improve overall equipment effectiveness of linear accelerator synergy platform cancer therapy. International Journal of Engineering, 35(7): 1246-1256. https://doi.org/10.5829/ije.2022.35.07a.04
[28] Wahjudi, D., Projesa, Y.D.P. (2021). An FMEA-based approach to waste reduction a case on a make-to-order company. In International Conference on Business and Engineering Management (ICONBEM 2021), pp. 7-11. https://doi.org/10.2991/aebmr.k.210522.002
[29] Cepova, L., Kovacikova, A., Cep, R., Klaput, P., Mizera, O. (2018). Measurement system analyses–Gauge repeatability and reproducibility methods. Measurement Science Review, 18(1): 20-27. https://doi.org/10.1515/msr-2018-0004