Imhade P. Okokpujie*![]() | Oghenemaro Avwunu | Saheed Akande
| Oghenemaro Avwunu | Saheed Akande![]() | Olufemi J. Dada
| Olufemi J. Dada![]() | Adekunle I. Musa | David I. Agbemuko
| Adekunle I. Musa | David I. Agbemuko
© 2024 The authors. This article is published by IIETA and is licensed under the CC BY 4.0 license (http://creativecommons.org/licenses/by/4.0/).
OPEN ACCESS
The condition monitoring system for an in-situ pipeline is an innovative concept that uses MQ-5 sensors to detect fuel leaks in pipelines and relay concentration data to a receiver station. The essence of the monitoring process is to ensure the safety and security of engineering properties and lives. The project addresses the crucial requirement for rapid detection of fuel leaks to avoid environmental problems, economic losses, and safety risks connected with pipeline circulation. The goal is to create a leak detection monitoring system. The project required the design and execution of four transmitter stations, each responsible for detecting fuel leaks at various places along a small-scale pipeline and transmitting concentration data to a central receiver station. The system's response time, a critical performance parameter for this project, was measured by timing how long it took for an alert to arrive at the receiving station after the transmitter detected a leak. This time was measured at three distances between the transmitter and receiver stations: 1m, 2m, and 3m. Multiple measurements were taken at each distance, and the average response time was computed. The results showed that as the distance between the stations increased, so did the reaction time. The average response time at 1m was 3.37 seconds, whereas, at 2m and 3m, it was 3.856 seconds and 4.198 seconds, respectively. A t-test inference was performed to check that there was a distinct difference between the response times for each distance, and a significant difference was detected. The built system effectively demonstrated its ability to detect fuel leaks, and the observed response times offered useful information about the system's performance at various distances. This technology demonstrates the potential to improve pipeline transportation safety and efficiency by enabling early identification of fuel leaks.
MQ-5 sensor, pipeline, leak detection, oil, condition monitoring, sustainable transportation, gas industry
The world's oil and gas industry depend on pipelines, which provide the most practical, economical, efficient, and environmentally friendly means of transporting crude oil and natural gas from upstream production to downstream refineries [1]. Power plants, industries, domestic consumers and markets while traversing nations through oceans and continents. Pipeline a network of pipes containing pumps, valves, and some other control equipment for moving liquids, gases, and slurries which is (fine particles which are suspended in liquids) [2]. The sizes of these pipes range from a diameter of 2 inches (5 centimeters) for oil-well series of collection systems to line up with a cross-section of 30 inches (9 meters) for high-volume water and sewage networks. Although some are built of concrete, clay products, and occasionally polymers, pipelines are often composed of sections of pipe made with metals (such as steel, iron, cast iron, and aluminum) [3, 4]. The pieces are joined by welding, and they are often laid underground. The majority of nations have a vast pipeline infrastructure. This is due to their importance to the broader population and the fact that they are typically out of sight. However, pipelines transmit almost all the water from the treatment plants to domestic homes, the natural gas from wellheads to individual customers, and long-distance oil overland transportation. According to Khan et al. [5], Nigeria produces mostly crude oil in Africa. Still, its income is greatly reduced by theft and attacks on oil pipelines, which greatly influence crude output and gasoline supply. The safest method of moving fluids is through pipes while in use. However, leaks are unavoidable because of maintenance errors made by people, sabotage, corrosion, and aging pipelines and fittings [6].
Even though pipeline leaks frequently begin tiny, their identification and late detection might have negative effects. Delays in detections can result in significant financial losses for an oil and gas business and environmental damage. A very low response system is necessary since there will always be a response in terms of security and technology. Shortening the response time to reduce the overall effect is economically significant. This effort will implement a system with a quick response time. According to Parapurath et al. [7] Discussed that when gas escapes from a cylinder or pipeline and enters an area, it was not intended to. It is said to have leaked. Because all these gasses normally are frequently colourless, and while some are odourless, it’s almost impossible to determine if there is a gas leak around the environment. If the leak is not found, it can result in life-threatening explosions. Gas leaks have increased recently due to a lack of public knowledge and poor equipment maintenance. A gas leakage detection system must be built to find gas leaks from gas pipelines or cylinders in homes or businesses. It is essential to stop the loss of life and property. Using wireless sensor networks, cloud computing, and radio frequency identification (RFID) (WSN). Due to their benefits, such as low cost, quick availability, simple interface circuitry, endurance, and a wide spectrum of detectable gases, metal oxide chemo-resistor-based commercial gas sensors are quite common [8]. A current trend is the development of smart homes all around the world. Automating regular actions like turning on lights and fans and regulating the thermostat has become popular among many people and businesses. The project's primary objective is to build an oil and gas leak detector utilising an oil and gas sensor. To increase safety and security, this device will continuously monitor the level of oil and gas leakages and connect to the Internet of Things using an ESP module (ESP 32 processor). This device can be used in LPG gas storage spaces in hotels and homes. The finished result of the project is used to notify the user and locate oil and gas leaks from pipes. To prevent intentional or unintentional leaks, this article provides instructions for finding oil and gas leaks in pipelines and alerts the user to the leak [9]. Many people are using mobile phones right now all across the world. Therefore, using smartphones as a surveillance tool to detect gas leaks will be quite useful [7].
As a result, a developed Android application and a system for gas leak detection. Yet, this technology can prevent explosions that can occur as a result of gas leaks in addition to detecting them. The gas leak detection system is a popular tool right now. They work well and significantly lessen the damage. They might be more successful if they check for gas leaks and other safety measures. Current gas leak detection systems can find leaks that can send out audible alerts and text and contacts to consumers to alert them to where the leak is. However, there is no safety precaution; therefore, if there is no user, any accident could occur—however, the proposed approach with safety precautions. In case if there is a gas leak, the user can take immediate action using their mobile smartphone, such as turning off the electricity and gas, to reduce the chance of any damage. Using the created program on mobile devices, they may remotely operate the complete system. The system's main goal is to create a system for gas leak detection and to take the required precautions to avoid disasters caused by gas leaks. Arduino is the system's sole source of electricity. If a gas leak, smoke, or flame is found, appropriate actions can be taken to alert people.
Oil and gas may be transported globally in a safe, cost-effective, and quickly using pipeline transportation [10]. However, according to current statistics, terrorism, vandalism, and sabotage have increased more frequently in this kind of transportation. How to solve these three interconnected issues is thus a significant challenge facing stakeholders in the pipeline business. Although most studies have recommended implementing improved regulations to address the issue, this study offers a technological alternative. Quality assessment of finished products is essential and inevitable to delivering standard goods to end users. Industry or industrial defects initiated during production reduce the quality of pipes and structures [11]. If not properly monitored and corrected, customer satisfaction cannot be achieved, as low-quality products will flood the market. Besides, deterioration in pipes and structures takes place with time. Wear and tear are initiated in the course of use and often result in in-complete failure of system failure if adequate measures are not put in place to detect defects at the initial state.
However, this work aims to develop a system with suitable sensors to effectively monitor, detect, and report the quality and status of pipelines. Also, the study incorporates a memory system for storing captured data;
exploring the synergy of different sensors to alert the nearest control center;
collecting response time data of existing condition monitoring methods, and system performance evaluation and data analysis. The system will be developed and equipped with essential features to monitor pipes and other structures before delivery and in-situ effectively.
To prevent catastrophic breakdowns and ensure the safe functioning of pipelines and structures, in-service inspection is necessary. It is crucial to effectively measure a structure's conservation state before, after, and throughout its lifetime.
Monitoring structural health can help define an expensive but successful program by maximizing the interventions required to maintain or restore safety and serviceability conditions.
Condition monitoring continuously monitors a particular machine’s state (such as temperature, vibration, etc.) [12]. This chapter models the conditioning and monitoring of an underground crude oil and gas pipeline. The proposed system is a mobile device-based application for hydrocarbon leak detection. The materials component employed is based on the system hardware.
2.1 System hardware
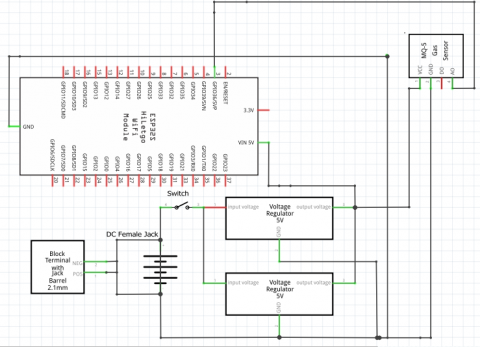
The system hardware consists of both mechanical and electrical components. These electrical and mechanical components are used to construct both transmitter and receiver stations, the pipeline, and the fittings that comprise the pipeline system. Table 1 shows the selected materials employed in this study, and Figure 1 debits the block diagram of the developed device.
Table 1. Materials used
|
Name of Component |
Number Used |
|
Buzzer |
5 |
|
MQ-5 sensor |
4 |
|
Light emitting diode (LED) |
4 |
|
20×4 Liquid crystal display (LCD) |
1 |
|
Jumper wires |
|
|
DS3231 Real-time clock |
1 |
|
ESP 32 Dev kit V1 Microprocessor |
5 |
|
3.7V Rechargeable Battery (18650) |
15 |
|
7805 voltage Regulator |
8 |
|
2.1mm DC Power supply Jack |
5 |
|
Rocker Switch |
5 |
|
SD Card module |
1 |
|
Push Button |
4 |
Figure 1. Block diagram of methodology
2.1.1 Liquid crystal display and MQ-5 sensor
The liquid crystal display is a diode that uses small cells and ionised gases to produce images. In this modern age, liquid crystal display (LCD) is now the most selected option for graphics, video and alphanumeric display. The display offers space for 20 columns of characters on four rows, making it ideal for presenting a huge amount of text without scrolling. Each column has a resolution of 58 pixels, ensuring visibility from a considerable distance. Aside from its size, the fascinating feature about this version of the display used is that it communicates via I2C, which means we only need two wires to connect the display to the Arduino (aside from GND and VCC). This is feasible due to the Parallel to the I2C module connected to the display, as seen in Figure 2a. The I2C module can also be purchased separately and connected to the 16-pin version of the display. The following are the specifications; Forward Current: 30mA, Forward Voltage: 1.8V ~ 2.4V, Reverse Voltage: 5V, Luminous Intensity: 20mcd.
The MQ-5 sensor detects various gases like liquified petroleum gas (LPG), methane, propane, and other hydrocarbons [9]. The MQ-5 gas sensor operates on the following principles: The sensor contains an element with a SnO2 hypersensitive filament. When a flammable gas, such as LPG, is supplied, the conductive property of the filament increases, and the proportion of the change in conductance or resistance can be utilized to calculate the approximate gas concentration. This sensor is utilized in the in-situ pipeline CMS to detect vaporized PMS that may have leaked from the model pipeline. It contains four pins: VCC: Input Voltage of 2.5V ~ 5.0V, GND: Power supply Ground Pin, AOUT: MCU.IO (Analog output), DOUT: MCU.IO (Digital Output) as shown in Figure 2b.
Figure 2. (a) Liquid crystal display and (b) MQ-5 sensor
2.1.2 Piezoelectric buzzer and Espressos if ESP32 Devkit V1 microprocessor
A buzzer, a sounder, an audio alarm, or an audio indication is a basic audio device that produces sound in response to an incoming electrical input. Buzzers are classified into two types: piezo buzzers and magnetic buzzers. In this work, a piezo buzzer was used, which possesses piezo crystals between two conductors. When a voltage is supplied, the crystal alters the position of the conductor numerous times per second due to a constant push and pull motion, producing a sound wave [7]. The sound frequency can be adjusted according to the source code used, which permits varied sounds to be created. This component in Figure 3a is installed in the reception station to generate an audio warning if any transmitter station detects a leak. The ESP32 is an all-in-one system developed for mobile, wearable electronics, and Internet of Things (IoT) applications. The ESP32 is a microcontroller family of system-on-chip that comes in various low-cost modules. The ESP 32 module was selected because of its inexpensive Wi-Fi modules with low power consumption. Express if systems' prototyping microcontroller board with integrated Wi-Fi and Bluetooth capability. It has 520KB of RAM and a Tensilica Xtensa 32-bit LX6 onboard microprocessor as given in Figure 3b. It is a low-cost, low-power system capable of easily powering IoT projects. The ESP32 was selected as the microcontroller for each substation in this project work because it offers low power and rapid internet connectivity to capture data for remote monitoring via the website. Unlike most prototyping microcontrollers, all ESP32 boards have a communication protocol that allows them to communicate with one another using Wi-Fi or Bluetooth. This allows information to be sent between substations and the base condition monitoring station.
Figure 3. (a) Piezoelectric buzzer and (b) ESP micro-controller
2.1.3 SD card, jumper wires and Light emitting diode (LED)
A secure digital card, often called an SD card, is a small, electronic, portable device with microchip circuitry for uploading, processing, storing, and transferring media material such as files, photos, and applications. It is a simple method for transferring data to and from a standard SD card. The Micro SD Card Adapter module is straightforward, with an SPI interface for connecting various SD cards and an onboard 3.3V voltage regulator for powering the SD card. The SD card module communicates with the ESP32 microcontroller and reads data from the SD card that has been inserted. This module allows the ESP32 to communicate, read, and write data to and from the memory card, enabling data logging and analysis. The purpose of the SD card in this work is to store the occurrence of leakages in the data in a datasheet. Operating Voltage: 4.5V ~ 5.5V DC, Current Requirement: 0.2mA ~ 200mA, 3.3V on-board Voltage Regulator, Supports FAT file system, Supports Micro SD up to 32GB presented in Figure 4.
An electric connection known as a jumper wire is used to connect distant electrical networks on printed circuit boards. Connecting a jumper wire makes it possible to short-circuit and short-cut (jump) to the electrical circuit. Male-to-male, male-to-female, and female-to-female jumper wires are the three types available. This particular semiconductor emits light when current is permitted to flow across it. This component generates a visual alarm when a transmitter detects a leak. This is positioned in the reception station so the operator can detect it presented in Figure 4.
Figure 4. (a) SD card, (b) jumper wires, and (c) Light emitting diode (LED)
The DS3231 RTC is a low-cost real-time clock which calculates time in hours, minutes, seconds, days, and months. It recognizes leap years and months with 30 days. This module makes it simple to record the time of a leak incident for convenient monitoring and trend analysis. It runs on 3.3V or 5V and has a CR2032 3V battery that can store information for up to a year. These pins are available on the RTC module: VCC: Power supply pin 3.3V or 5V, GND: Ground pin, SDA: Serial Data, SCL: Serial Clock Signal. Its operating voltage is around 2.3V ~ 5.5V, operating temperature from (−40℃-+70℃), 400KHz 12C Interface, CR2032 Battery back-up as presented in Figure 5a. This is a common 5.5mm barrel DC power supply jack used to power a circuit. It can accept a male power connector for power delivery from a bulk DC power supply or DC charger. When the three 3.7V batteries in the transmitter and reception station are depleted, this component is utilized to charge them. Ranging specifications Terminal: PCB Soldering, Voltage Rating: 48V, Current Rating: 5A, Insulation Resistance: 1000MΩ min, Dielectric Withstanding: 500VAC max, Gender: Female given in Figure 5b.
Figure 5. (a) Real time clock, (b) Rechargeable battery, (c) Rechargeable battery, (d) Printed circuit boards (PCB) (e)Voltage regulator (7805), (f) Rocker switch, (g) Resistor, and (h) Female pin header
This lithium-ion rechargeable battery stores electric charge by reversibly reducing lithium ions. The 18650 means the dimensions of the battery, which are 18mm in diameter and 65mm in length. They are widely employed in electronic equipment because of their low self-discharge, high energy density, and endurance. The battery capacity is 3800mAh (milli-amp hour), nominal voltage 3.7V, debited in Figure 5c. This popular Integrated Circuit (IC) offers a continuous 5V DC power supply over a specified input voltage range. The designation 7805 refers to the voltage regulator's class and output, with "78" denoting positive voltage and "05" denoting a 5V output from the IC. This component reduces the voltage from the three 3.7V Li-ion batteries' total output voltage for both the transmitter and receiving stations. Input Voltage: 7V ~ 35V, Current Rating: 1A, Output Voltage: 4.8V ~ 5.2V as shown in Figure 5d. This is an accessible single pole single-through switch (SPST) commonly used as a reset button. When pressed, it closes a circuit and reopens it when released. When necessary, this switch is utilized to reset the receiver station. One side is connected to the ESP32 microcontroller's Enable Pin (EN), while the other is connected to the ground (GND). When the operator clicks the button, the EN pin connects to GND and briefly resets the microcontroller. The specifications include; Input Voltage: 1V ~ 12V, Input Current: 10µA ~ 50mA, Operating Temperature: −25℃ ~ +70℃, Switch Dimensions: 4.5mm × 4.5mm × 3.5mm as illustrated in Figure 5e. It supports and connects electrical and mechanical electronic devices or components using conductive routes, tracks, or signal traces of copper sheets attached to a non-conductive substrate. It provides a controlled and predetermined platform for circuit development by acting as an electronic board utilized for the assembly and connection of electronic components. Express PCB was used to print PCBs for the transmitter station circuits and the receivers, as presented in Figure 5f.
This two-position switch alters an electrical power supply to a circuit or device on or off. This SPST switch was utilized to turn on or off the power supply from the batteries to the transmitter and receiver stations' circuits. Its specifications are; Working Voltage: 250V, Working Current: 3A, Maximum Insulation Resistance: 100MΩ, Contact Resistance: 0.02Ω. These inactive components are used to resist current flow by a specified amount. It is used in this project to lower the supply voltage to the LEDs in the transmitter and receiving stations. The resistor used to do this had four bands, namely Red, Red, Brown, and Gold, and hence a resistance value of 220 ±5%. The resistor specifications used; Resistance: 220Ω, Tolerance: 5%, Type: Carbon Film, Maximum Operating Voltage: 350V, Operating Temperature −55℃ ~ 155℃ as shown in Figure 5g. These are stiff metallic solderable connectors designed to accept male pins. This was utilized to link the ESP32 male pins to the PCB for both the transmitter and receiver stations. Two single 15-pin headers were used as debited in Figure 5h.
2.2 Circuitry method
This part of this study describes the whole operation of the system (Figure 6). The circuit building and designing used a long-term circuit connection approach, using a PCB (printed circuit board) assembled and ordered via Express PCB. For a simple and direct circuit construction, the components of the receiver and transmitter stations were soldered together rather than utilizing a normal prototyping breadboard.
Figure 6. Circuit diagram for the transmitter station
2.2.1 Circuit design and construction of the transmitter station
The transmitter stations are responsible for detecting leaks in various locations along the pipeline by utilizing an MQ-5 sensor that will detect discharged PMS exiting a leak location or fracture. In each station, an ESP32 microcontroller is used to collect input from the gas sensor and send the concentration of the gas present to the receiver station. The following processes are involved in the building of the transmitter stations:
Making use of prototyping software (Design), for the circuit to be prototyped on a breadboard.
Configured the PCB for the transmitter stations using Express PCB online.
Drilled three circuit box connection holes for the ESP32 USB port, the DC power supply jack port, and the MQ-5 sensor.
Using the specified PCB design, etch and solder the female pin headers, two 7805 voltage regulators, MQ-5 sensor jumper wires, and power supply wires from the batteries onto the PCB.
Drilled the circuit box and PCB for the transmitter station and secured it with a 5mm bolt and washer.
Connected the ESP32 Microcontroller to the female pin headers and the MQ-5 sensor pins to the corresponding header pins (after observing the preset orientation).
The batteries were packed together and connected the power supply circuit, which includes the batteries, rocker switch, and DC female jack, to the PCB input power line.
Glued the MQ-5 sensor to the circuit box's inner wall, with the sensor facing outside the box via the aperture.
Closed the circuit box, powered the station, and connected the ESP32 to a PC to monitor the MQ-5 sensor output using Arduino IDE Serial Monitor.
3.7V rechargeable Li-ion batteries (3) were utilized to provide power to the circuit, resulting in a compact and adaptable structure that eliminated the necessity for fixed power supply connections while also decreasing the system's space needs. According to manufacturing standards, a minimum of 24 hours of battery life was necessary to guarantee appropriate heating time for the MQ-5 gas sensors. As a result, a maximum amount of power of the transmitter circuit was measured in order to decide on the suitable battery capacity for the sensor as well as to keep the system functioning even after pre-heating shown in Figure 7.
A mAh multi-meter was connected in series with the batteries to measure the current drawn by the circuit to determine the peak power usage. At a 5V DC supply to the components, the average peak current consumption was 149mA. As a result, the following equation was applied to compute the maximum power usage.
$P= I \times V$ (1)
where, I = the maximum current; V = Voltage supplied; As a result, the circuit's power consumption is
$P=\frac{149}{1000} \times 5=0.745 \mathrm{~W}$
The formula below calculates the system’s battery life using three 3.7V batteries, each generating 3800mAh of current.
$\begin{aligned} & Discharge- time=\frac{Battery \,\, capacity \times voltage \,\, supplied \times efficiency \,\, of \,\, battery}{Power \,\, consumption \,\, of \,\, circuit }\end{aligned}$ (2)
The discharge time is computed when the efficiency of a Li-ion battery is 0.9, and the battery capacity is 3800mAh:
$\frac{3.8 \times 11.1 \times 0.9}{0.745}=50.956$ hours $\cong 2.123$ days
Figure 7. Hardware structure for the transmitter station
2.2.2 Circuit design and construction of the receiver station
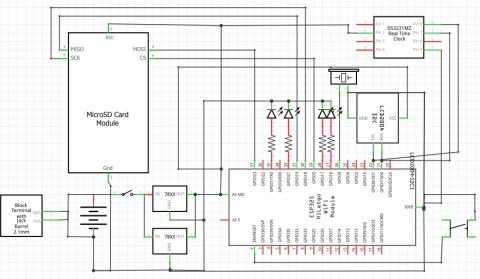
The receiver stations collect sensor data from each transmitter station and alert a local operator of a potential leak using a buzzer and LED light indicator representing each station. An LCD panel is also employed to display the MQ-5 sensor readings for each transmitter. A real-time clock records the time a leak occurs while the tabulated report is stored in an SD card for trend analysis and reporting. An ESP32 Devkit V1 microcontroller is also responsible for taking inputs from the transmitters through the ESP-NOW communication protocol and providing output for the operator. The microcontroller also provides over-the-internet updates for monitoring through an IoT platform enabling remote monitoring capability. The procedures involved in the construction of the receiver station include the following:
Prototyped the circuit on a breadboard using online prototyping software.
Optimized the circuit by removing unnecessary components.
Designed and ordered the PCB for the transmitter stations using Express PCB online.
Opened two circuit box connection holes for the ESP32 USB port opening and the DC power supply jack port opening.
Etched and soldered the female pin headers, two 7805 voltage regulators, four 220Ω resistors, SD card pins, LCD pins, RTC pins, buzzer wires and power supply wires from the batteries onto the PCB based on the predetermined PCB design.
Drilled a hole in the circuit box and PCB for the receiver station and joined them using a 5mm bolt and washer.
Used a saw to cut a rectangular hole at the top of the receiver station circuit box and drilled four holes to join the LCD panel to the box with four 5mm bolts and nuts with the screen facing the top.
Completed all the connections based on the designed circuit and glued loose wires to keep them stiff and stable.
Closed the circuit box, switched on the station and connected the ESP32 to a PC to check the functionality of the receiver station and its communication with the transmitter stations through the Arduino IDE Serial Monitor. Figure 8 shows the schematic structure of the receiver station, and Figure 9 illustrates the system’s circuit diagram.
2.2.3 Software and programming implementation
The Arduino Integrated Development Environment (IDE) is an open-source electronic prototyping program to create inventive, smart, and creative devices [11]. It is compatible with hundreds of microcontrollers from many manufacturers and provides a simple way to utilize this hardware in a user-friendly environment. The Arduino IDE 2.0 platform was used to develop, test, and implement program codes on the ESP32 DevKit V1 for the transmitter and receiver stations, allowing the system to detect leaks, acquire and store information on possible leak scenarios, alert a local operator of a potential leak detected by any of the transmitter stations, and provide a means of remote monitoring. The transmitter and receiver stations were programmed separately to fulfil their respective roles but were linked to communicate to achieve the integrated system's aim.
2.2.4 Programming of the transmitter stations
The transmitter stations detect leaks in the pipeline and transmit sensor data to the receiver station. The following portions were included in the program for the transmitter stations:
Initialization and Transmitter-Receiver Communication: This comprises initializing variables that will be used later in the program and establishing peer-to-peer communication between the transmitter and receiver by launching the ESP NOW communication protocol.
The code includes the necessary libraries: ‘esp_now.h’ for ESP NOW functionality and ‘WiFi.h’ for setting up Wi-Fi as a station.
The variable ‘xSensorPin’ is assigned the value 36, representing the ADC0 pin (GPIO36) where the MQ-5 sensor is connected. Int x.Sensorpin = 36;
‘xSensorValue’ is declared and initialized to 0. It will store the sensor reading later:
Int xSensorPin = 36;
Int xSensorValue = 0;
The MAC address of the receiver station is defined as ‘broadcastAddress’, represented as an array of bytes.
The code defines a structure named ‘struct_message’ to send data. It contains two integer variables: ‘id’ and ‘x. The ‘id’ field must be unique for each sender board.
Typedef struct struct_message {
Int id; // must be unique for each sender board
Int x;
//int y;
} struct_message;
An instance of the structure is created with the name ‘myData’.
The code creates a ‘esp_NOW_peer_info_t’ structure called ‘peerInfo’ to define the peer (receiver) interface.
The call back function ‘OnDataSent’ is defined to handle the event when data is sent. It prints the status of the packet delivery.
In the ‘setup()’ function. The serial monitor is initialized with a baud rate of 115200.
The device is set to Wi-Fi station mode using ‘WiFi.mode(WiFi STA)’.
ESP NOW is initialized with ‘esp_now_init()’. If initialization fails, an error message is printed.
if (esp_now_init() != ESP_OK) {
Serial.println("Error initializing ESP-NOW");
return;
}
The ‘OnDataSent’ call back is registered with ‘esp_now_register_send_cb()’ to receive the send status of transmitted packets.
The ‘peerInfo’ structure is configured with the receiver’s MAC address, channel (0), and encryption status (false).
The receiver is added as a peer using’esp_now_add_peer()’. If the addition fails, an error message is printed.
Leak Detection and Sensor Data Transmission: In this program section, the ESP32 microcontroller collects MQ-5 sensor data and sends it to the receiver over the ESP NOW protocol.
In the ‘loop()’ function;
The ‘id’ field of ‘myData’ is set to 1 (can be any unique identifier).
The variable ‘xsensorVal’ reads the analog value from the ‘xSensorpin’.
The variable ‘xSensorvalue’ is calculated by scaling the ‘xsensorVal’ value to a range of 0-3.3V and then mapping it to a range of 0-1023. This represents the concentration level of fuel gases detected by the MQ-5 sensor. The value of ‘xSensorValue’ is also printed to the serial monitor.
int xSensorVal = analogRead(xSensorPin);
int xSensorValue = (xSensorVal * 0.001221);
xSensorValue = map(xSensorValue, 0, 3.3, 0, 1023);
xSensorValue = xSensorValue–682;
Serial.println(xSensorValue);
The ‘esp_now_send()’ function sends the data stored in ‘myData’ to the receiver using the ‘broadcastAddress’. The data is sent as a byte array, and the data size is provided using ‘sizeof(myData)’.
esp_err_t result = esp_now_send(broadcastAddress, (uint8_t *) &myData, sizeof(myData));
myData.x = (xSensorValue);
The result of the send operation is checked. A success message is printed if it is successful (‘ESP_OK’); otherwise, an error message is printed. A delay of 2 seconds is also added before the next iteration of the loop:
if (result == ESP_OK) {
Serial.println("Sent with success");
}
else {
Serial.println("Error sending the data");
}
2.2.5 Programming of the receiver station
By receiving input from the transmitters, showing it on a locally located LCD, and saving the information on a mounted SD card, the receiver station serves as the main control centre of the condition monitoring system.
Initialisation of Devices and Communication:
The code includes necessary libraries and defines various constants and variables.
It initialises the ESP-NOW communication protocol and sets up the Wi-Fi mode for the device to act as a Wi-Fi station.
The code also initialises the RTC (Real-Time Clock) DS3231 module for timekeeping and the SD (Secure Digital) card for data storage.
Additionally, it initialises the LiquidCrystal_I2C library and sets up the LCD.
Transmitter-Receiver Communication:
The code defines a structure `struct_message` to represent the data to be transmitted and received.
It creates instances of this structure to store readings from different boards (`board1`, `board2`, `board3`, `board4`).
The `OnDataRecv` function serves as the callback function to be executed when data is received from a transmitter.
Inside `OnDataRecv`, it retrieves the received data, updates the respective structure (`boardsStruct`) with the new data, and prints the received packet information.
Leak Data Acquisition:
In the `setup` function, it initialises various devices, such as the LCD, Serial Monitor, LEDs, and buzzer.
It also initialises the SD card for data storage and checks if it is mounted correctly.
Furthermore, it sets up the initial display on the LCD, opens a file on the SD card (if it exists), or creates a new file if it doesn't exist.
Alert System and Local Monitoring:
In the `loop` function, it retrieves the current time from the RTC module.
It accesses the readings from each board (stored in `boardsStruct`) and displays them on the LCD.
The readings show that it controls the LEDs and buzzer to indicate abnormalities.
The code then appends the readings and other relevant data (such as time and date) to the CSV file on the SD card for record-keeping.
2.3 Pipeline setup
The pipeline structure was to imitate the bends and flow direction in actual pipelines service, utilizing a way smaller scale MQ-5 sensor to provide maximum accuracy from the sensor due to its limited range. 30mm in diameter PVC pipe was used to construct the model for a simple set-up. Three 250mm and four 40mm pipes were used for the straight flow paths and 32mm (90°) elbows were used for the bends as shown in Figure 10.
Figure 8. Schematic diagram for receiver station
Figure 9. Circuit diagram for the receiver station
Figure 10. PVC pipeline set-up with transmitter stations
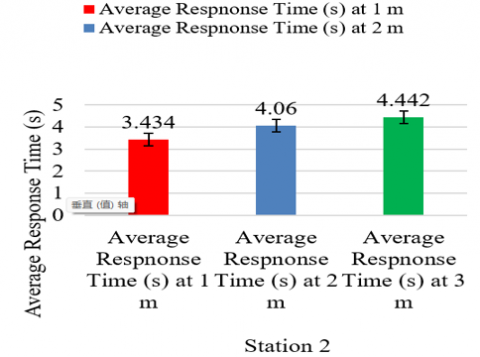
In this work, while utilizing the MQ-5 sensor, the aim is to focus on the time detection concerning distance and, finally, on the delay in response of the control system, as shown in the graphs. The system was tested using a hydrocarbon fluid (fuel) in a pipe set-up and continued to vary the distance. At the same time, data are being collected to observe the detection time and distance. The data and time were measured with the real-time clock (RTC) and stored in the SD card inserted in the receiver station. After detecting the LPG gas, the sensor transmits a signal to the microprocessor, which the latter afterward analyses. The microprocessor then transmits an active signal to further devices connected to the outside world. As a result, a buzzer signals the presence of the gas concentration; this finding is supported by Somov et al. [13]. The primary performance parameter assessed and the outcome acquired to analyze the outcome is response time, quantified as the time it takes to receive an alert on the receiving station after the transmitter senses the leak. The response time for station two (2) data was recorded at 1m, 2m, and 3m from the receiver station. This response time was tested five times for each distance, and the average response time was calculated. Figure 11 shows the response times recorded for station two when it’s 1m to 3m from the receiver. Figure 12 shows a chart representation of the differences in the response time of station two at a distance of 1m to 3m. Response times decreased after four test runs but increased after the fifth test. This indicates that the minimal response time has been achieved and will thus vary around that value based on external factors such as wind speed and direction [14-18]. These parameters were not taken into account.
Figure 11. Response time chart and number of experimental runs
Figure 12. Average response time for station two
Analysing response time statistics, the system generally achieves appropriate response times for each station at varied distances. The average response time for all stations is less than 5 seconds, showing that sensor data is transmitted relatively quickly from transmitter stations to receiver stations. As a result, it is possible to conclude that the system and receiving station meet the specified performance standards. There were no reports of data transmission delays or loss during data collection. Nevertheless, uniformly throughout the measurement period, demonstrating reliable communication between the transmitter and receiver stations.
3.1 T-Test (Paired two samples for mean) analysis of response times
This analysis compares station 2's response times for each distance. The significant difference in the response times at each distance can be found by comparing the response times and performing a significant inference test. This helps determine whether there is a significant change in response times when the distance between the transmitter and the receiver station varies. The findings from this study shed light on the effectiveness and dependability of transmitter-receiver communication for identifying and transferring concentration data. The mean t-test used the paired two data to compare response times in pairs. Table 2 Compares 1m vs 3m and 2m vs 3m. While Table 3 Shows the T-test output comparing the response times of station 2 at 1m vs 2m from the receiver.
Table 2. T-Test data for station 2 at 1m vs 2m
|
|
1m from Receiver |
2m from Receiver |
|
Mean |
3.434 |
4.06 |
|
Variance |
0.02318 |
0.0206 |
|
Observations |
5 |
5 |
|
Pearson Correlation |
0.772242 |
|
|
Hypothesized Mean Difference |
0 |
|
|
Df |
4 |
|
|
t Stat |
-13.9768 |
|
|
P(T<=t) one-tail |
7.6E-05 |
|
|
t Critical one-tail |
2.131847 |
|
|
P(T<=t) two-tail |
0.000152 |
|
|
t Critical two-tail |
2.776445 |
|
The p-value is used in hypothesis testing to determine the importance of the results. If the complete hypothesis is true, the p-value shows the chance of obtaining the observed results (or more extreme results) [19]. The null hypothesis in this scenario would be that there is no difference between the two reaction times for the compared distance. The p-value calculated for a two-tailed test performance stated in Table 4 is 0.000152, less than the generally used significance level of 0.05 in hypothesis testing. The null hypothesis is rejected because the p-value (0.000152) is less than the significance level, and the conclusion that there is a significant difference between station2 response time when the receiver is 1m away vs 2m away is reached, which means that the difference observed in the sample means (-13.9768) is unlikely to occur by chance alone if there is no true difference between the variable in the population. The negative t-statistic value indicates that the response time at 1m has a lower mean than the response time at 2m, and the p-value confirms that this difference cannot be explained by chance. The two-tailed p-values of 0.000139 and 0.001997378 reveal a significant difference when the distance between the receiver stations is adjusted. The Pearson correlation from each table also shows a strong association between the response times for each distance, indicating a definite proportionality between response time and distance [20].
Table 3. T-Test data section for station 2 at 1m vs 3m
|
|
Variable 1 |
Variable 2 |
|
Mean |
3.434 |
4.442 |
|
Variance |
0.02318 |
0.06727 |
|
Observations |
5 |
5 |
|
Pearson Correlation |
0.831008 |
|
|
Hypothesized Mean Difference |
0 |
|
|
Df |
4 |
|
|
t Stat |
-14.3069 |
|
|
P(T<=t) one-tail |
6.93E-05 |
|
|
t Critical one-tail |
2.131847 |
|
|
P(T<=t) two-tail |
0.000139 |
|
|
t Critical two-tail |
2.776445 |
|
Table 4. T-Test data for station 2 at 2m vs 3m
|
|
Variable 1 |
Variable 2 |
|
Mean |
4.06 |
4.442 |
|
Variance |
0.0206 |
0.06727 |
|
Observations |
5 |
5 |
|
Pearson Correlation |
0.989904203 |
|
|
Hypothesised Mean Difference |
0 |
|
|
Df |
4 |
|
|
t Stat |
7.175686227 |
|
|
P(T<=t) one-tail |
0.000998689 |
|
|
t Critical one-tail |
2.131846786 |
|
|
P(T<=t) two-tail |
0.001997378 |
|
|
t Critical two-tail |
2.776445105 |
|
Regarding response time and data transmission reliability, the pipeline condition monitoring system created to identify leaks in a pipeline conveying fuel has shown encouraging results. The system detected flashing fuel leaving leak spots and sent concentration data to the reception station using four transmitter stations equipped with MQ-5 sensors and ESP32 microcontrollers. At various distances, the response time was recorded and analyzed, defined as the time it takes for the receiving station to get an alert after the transmitter detects a leak. According to the data analysis, the system consistently achieved response times within an acceptable range for all transmitter stations at varying distances. The average reaction times were less than 5 seconds, demonstrating a rather rapid transmission of sensor data. The two-tailed p-values of 0.000139 and 0.001997378 reveal a significant difference when the distance between the receiver stations is adjusted. This illustrates the system's effectiveness and efficiency in detecting and transmitting concentration data on time. Furthermore, the system's transmission dependability was adequate, with no delayed or lost data transfer seen during the data collection procedure.
The following recommendations for further improvement and future work are based on the project's results and conclusions.
Environment testing–Conduct comprehensive environmental testing to evaluate the system's performance across various situations, such as temperature fluctuations, humidity, potential interference sources, and wind speed and direction changes. This will ensure the system's dependability and efficacy in various operational environments.
Data analysis visualisation–exploring other data analysis and visualisation approaches to elicit more insights from the obtained data. Statistical analysis, graphical representations, or machine learning methods may be used to find patterns or anomalies in the sensor.
Integration with monitoring infrastructure–Consider integrating the pipeline condition monitoring system with existing pipeline monitoring infrastructure, such as supervisory control and data acquisition (SCADA) systems. This interface will allow for real-time monitoring, automated alarms, and smooth integration into the pipeline management framework.
[1] Al-Janabi, Y.T. (2020). An overview of corrosion in oil and gas industry: Upstream, midstream, and downstream sectors. Corrosion Inhibitors in the Oil and Gas Industry, 1-39. https://doi.org/10.1002/9783527822140.ch1
[2] Noon, A.A., Jabbar, A.U., Koten, H., Kim, M.H., Ahmed, H.W., Mueed, U., Shoukat, A.A., Anwar, B. (2021). Strive to reduce slurry erosion and cavitation in pumps through flow modifications, design optimization and some other techniques: Long term impact on process industry. Materials, 14(3): 521. https://doi.org/10.3390/ma14030521
[3] Hariharan, M., Shamsudheen, S.P., Varghese, N., Nair, A.B. (2023). Application of UPR in pipeline corrosion: Protection and applications. Applications of Unsaturated Polyester Resins. Elsevier, pp. 309-340. https://doi.org/10.1016/B978-0-323-99466-8.00011-3
[4] Solovyeva, V.A., Almuhammadi, K.H., Badeghaish, W.O. (2023). Current downhole corrosion control solutions and trends in the oil and gas industry: A Review. Materials, 16(5): 1795. https://doi.org/10.3390/ma16051795
[5] Khan, A., Qurashi, A., Badeghaish, W., Noui-Mehidi, M.N., Aziz, M.A. (2020). Frontiers and challenges in electrochemical corrosion monitoring; surface and downhole applications. Sensors, 20(22): 6583. https://doi.org/10.3390/s20226583
[6] Alamri, A.H. (2020). Localized corrosion and mitigation approach of steel materials used in oil and gas pipelines–An overview. Engineering Failure Analysis, 116: 104735. https://doi.org/10.1016/j.engfailanal.2020.104735
[7] Parapurath, S., Ravikumar, A., Vahdati, N., Shiryayev, O. (2021). Effect of magnetic field on the corrosion of API-5L-X65 steel using electrochemical methods in a flow loop. Applied Sciences, 11(19): 9329. https://doi.org/10.3390/app11199329
[8] Mahmoodzadeh, Z., Wu, K.Y., Lopez Droguett, E., Mosleh, A. (2020). Condition-based maintenance with reinforcement learning for dry gas pipeline subject to internal corrosion. Sensors, 20(19): 5708. https://doi.org/10.3390/s20195708
[9] Wu, X., Huang, H., Xie, J., Lu, M., Wang, S., Li, W., Huang, Y., Yu, W., Sun, X. (2023). A novel dynamic risk assessment method for the petrochemical industry using bow-tie analysis and Bayesian network analysis method based on the methodological framework of ARAMIS project. Reliability Engineering & System Safety, 109397. https://doi.org/10.1016/j.ress.2023.109397
[10] Qureshi, F., Yusuf, M., Khan, M.A., Ibrahim, H., Ekeoma, B.C., Kamyab, H., Rahman, M.M., Nadda, A.K., Chelliapan, S. (2023). A State-of-The-Art review on the latest trends in hydrogen production, storage, and transportation techniques. Fuel, 340: 127574. https://doi.org/10.1016/j.fuel.2023.127574
[11] Azamfirei, V., Psarommatis, F., Lagrosen, Y. (2023). Application of automation for in-line quality inspection, a zero-defect manufacturing approach. Journal of Manufacturing Systems, 67: 1-22. https://doi.org/10.1016/j.jmsy.2022.12.010
[12] Zhang, J., Lian, Z., Zhou, Z., Song, Z., Liu, M., Yang, K. (2022). Leakage detection in a buried gas pipeline based on distributed optical fiber time-domain acoustic wave signal. Engineering Failure Analysis, 141: 106594. https://doi.org/10.1016/j.engfailanal.2022.106594
[13] Somov, A., Baranov, A., Savkin, A., Spirjakin, D., Spirjakin, A., Passerone, R. (2011). Development of wireless sensor network for combustible gas monitoring. Sensors and Actuators A: Physical, 171(2): 398-405. https://doi.org/10.1016/j.sna.2011.07.016
[14] Ramírez-López, F., Yáñez-Casas, G.A., Casillas-Aviña, G.E., Hernández-Gómez, J.J., Mata-Rivera, M.F., Ramírez-Espinosa, S. (2022). Simulation and implementation of an environmental monitoring system based on LPWAN/IoT. In International Congress of Telematics and Computing, Cham: Springer International Publishing, pp. 237-269. https://doi.org/10.1007/978-3-031-18082-8_16
[15] He, L., Feng, B. (2022). Principles of Sensors. In Fundamentals of Measurement and Signal Analysis, Singapore: Springer Nature Singapore, pp. 189-270. https://doi.org/10.1007/978-981-19-6549-4_7
[16] Adedotun, A., Emmanuel, E., Adeoye, A., Okokpujie, I.P. (2023). An IoT controlled smart grid system for theft detection and remote power redirection. In 2023 International Conference on Science, Engineering and Business for Sustainable Development Goals, (SEB-SDG), Vol. 1, pp. 1-6. https://doi.org/10.1109/SEB-SDG57117.2023.10124530
[17] Okokpujie, K., Jacinth, D., James, G.A., Okokpujie, I.P., Vincent, A.A. (2023). An IoT-based multimodal real-time home control system for the physically challenged: Design and implementation. Information Dynamics and Applications, 2(2): 90-100. https://doi.org/10.56578/ida020204
[18] Wang, J., Wang, Q., Meng, Y., Yao, H., Zhang, L., Jiang, B., Liu, Z., Zhao, J., Song, Y. (2022). Flow characteristic and blockage mechanism with hydrate formation in multiphase transmission pipelines: In-situ observation and machine learning predictions. Fuel, 330: 125669. https://doi.org/10.1016/j.fuel.2022.125669
[19] Wong, V.K., Rabeek, S.M., Lai, S.C., Philibert, M., Lim, D.B.K., Chen, S., Raja, M.K., Yao, K. (2022). Active ultrasonic structural health monitoring enabled by piezoelectric direct-write transducers and edge computing process. Sensors, 22(15): 5724. https://doi.org/10.3390/s22155724
[20] Wei, H., Liao, K., Zhao, X., Kong, X., Zhang, P., Sun, C. (2019). Low-coherent fiber-optic interferometry for in situ monitoring the corrosion-induced expansion of pre-stressed concrete cylinder pipes. Structural Health Monitoring, 18(5-6): 1862-1873. https://doi.org/10.1177/1475921719826360