Joni*![]() | Johni J. Numberi
| Johni J. Numberi![]() | Enos Tambing
| Enos Tambing![]() | Samuel P. Siregar
| Samuel P. Siregar![]() | Radite P.A. Setiawan
| Radite P.A. Setiawan![]() | Armansyah H. Tambunan
| Armansyah H. Tambunan![]() | Kiman Siregar
| Kiman Siregar![]()
© 2023 IIETA. This article is published by IIETA and is licensed under the CC BY 4.0 license (http://creativecommons.org/licenses/by/4.0/).
OPEN ACCESS
The removal of alkaline chemicals, particulates, and other impurities from syngas is a challenge in the biomass gasification process. Wet scrubbers are frequently used to clean the industrial exhaust gases before being released into the atmosphere. Cleaning fluid is sprayed or pumped through the apertures and comes in touch with the gas to be cleaned of most wet scrubbers. Therefore, this paper proposes a new technology that uses a bubble wet scrubber system to flow syngas at a constant height into a pool of cleaning water. The syngas will come into direct contact with the cleaning water to form bubbles containing gas and other impurities that are absorbed mostly by the cleaning water. The objective of this study is to develop a simple and cost-effective bubble system scrubber and investigate its impact on the scrubber's performance for tar removal from biomass gasification. The results show that 2.6 L of cleaning water can remove particles and tar from syngas with an 83.26% efficiency.
bubble, effectivities, syngas, wet scrubber
The gasification system has been selected and designed to reduce impurities, but the gasification process still requires additional processing units to clean the syngas. These additional units include the cyclone separator and scrubber or filter, where each additional unit has the characteristics of removing one or several contaminants or impurities. The gasification system that generates syngas must include an additional unit capable of removing five major impurities, including particulate matter, alkali content, tar, nitrogen-containing components, and sulfur [1]. The fuel gas must also contain a minimal amount of light hydrocarbons, such as methane or ethane, even though these two hydrocarbons are actually useful as fuel gas because they can increase the syngas' heating value. Methane and ethane, however, should not be present in combustible gas because they are difficult to react with. This reduces the efficiency of syngas conversion and harms the catalyst system, which may alter the ratio of syngas molecular components.
Gas cleaning is an essential component of any biomass gas installation in order to meet the end-user specifications for syngas. For example, for applications as fuel in internal combustion engines (ICE), which require tar compound and particulate concentration limits of around 100 mg/Nm3 and 30 mg/Nm3, respectively [2]. Conventionally, gas cleaning is performed using various systems, such as wet-dry and wet-cleaning. Most frequently, wet scrubbers are utilized in gasification processes for cleaning syngas, conditioning gas temperatures, and capturing smaller particles.
After passing through cyclone equipment, the raw synthesis gas produced by the gasification process is fed to the wet scrubber system via an insulated connecting pipe (to reduce tar condensation). The pipe is installed with a specific slope to allow condensate to flow to the wet scrubber unit via gravity. Generally, wet scrubbers operate counter-current to remove tar and particulates and prevent backfires. Generally, wet scrubbers operate in co-current to remove tar and particulate matter and prevent backfires.
Wet scrubbers capture tar and particulate compounds bound to water mist, and then separate the tar and particulate compounds in wet conditions. The syngas is cooled to a temperature of 35–60℃, making it possible to use water in the tar separation procedure. The research findings indicate that using a wet scrubber to separate tar is both feasible and efficient enough for large-scale gasification processes. The tar compounds are separated from solid particulates first using this system, which can cool gas to a temperature of about 240℃. The gas is then cooled before passing through the wet scrubber. The majority of the organic compounds found in tar compounds, which range from phenol to multi-ring aromatics, are readily soluble in water. As a result, the waste produced by the wet scrubber process is an emulsion that is difficult to separate. The deposition process can only separate a small portion. Cleaning is required for more than 50% of tar components, such as organic acids, aldehydes, and phenols, that are still dissolved in water. Cleaning up wastewater that contains tar is a different issue, particularly in terms of operational costs and environmental concerns [3].
2.1 Materials
The materials used to evaluate the performance of the cyclone separator were 20 kg of empty palm fruit bunches adjusted to the volume capacity of the gasification reactor chamber and 150 mL of an isopropanol solution with a concentration of 98% used as a tar and particle trap. Meanwhile, the equipment used included a downdraft fixed-bed type gasification reactor with a capacity of 200 kg (for wood chips) and 20 kg (for oil palm fruit bunches); a wet scrubber built according to Figure 1; a Konax-6501 anemometer to measure gas flow velocity; a U manometer to measure the pressure drop at the cyclone's inlet and outlet; digital scale Excellent DJ-A 600 G; up to 2.6 liters of water for cleaning gas in the scrubber; digital hanging scales with a capacity of 20 kg; gas wash bottles; a DA-240S diaphragm vacuum pump for gas sampling; a centrifugal blower model 02-370 with a capacity of 690 m3/hour which is used to suck gases from the gasification reactor and forward these to other cleaning equipment; a rotameter with a capacity of 2 mL/min for adjusting the suction velocity of the gas sample; a Pyro-GCMS PY-2020iS and a GCMS-QP2010 for compound identification; a gas analyzer GASBOARD-3100P for CO, CO2, H2, and CH4 concentration measurements.
Figure 1. Wet scrubber construction
2.2 Methods
The performance test of the water bubble column scrubber was conducted in conjunction with cyclones, blowers, and gasification reactors via 5-inch galvanized pipes and ¾-inch flexible pipes (Figure 2). The scrubber chamber is filled with cleaning water with a capacity of 2.6 L until it reaches a depth of 14 cm from the bottom. Temperature measuring devices, gas samples, and pressure gauges are installed in their respective designed positions. When the chamber of the gasification reactor is filled with empty fruit bunch biomass, the rate of gas flow into the chamber containing water is measured using an anemometer. The gasification process is carried out by igniting LPG gas, leaving the smoldering empty fruit bunch for 5 minutes, and regulating the incoming air flow by measuring its velocity until it reaches a minimum of 0.25 m/s. This process is allowed to continue until combustible gases are produced, as indicated by the cleaner color of the smoke emerging from the scrubber, and then the gas is ignited. In these circumstances, gas samples were collected using a vacuum pump at a rate of 0.5 L/min in order to completely fill the gas pack bag.
In order to determine the composition of the gas sample, an analysis was performed on it using a gas analyzer. After the gasification process has been completed, the waste water from the gas cleaning that was held in the scrubber is taken out and put into a sample bottle for GC-MS testing.
Figure 2. Installation set-up of gas cleaning equipment
Parameters like gas measured after the cyclone separator, including gas flow rate, temperature, gas concentration (CO, CO2, CH4, and H2), and dimensions of the scrubber along with fluid (water) used, will be compared theoretically and experimentally to evaluate the effectiveness of the developed equipment (Figure 1). Bubble column theory, which is based on the pattern of gas flow, provides the basis for the analytical method used. Equipment performance parameters include gas bubble diameter (db), gas bubble resistance coefficient ($\varepsilon_b$), liquid hold-up coefficient ($\varepsilon_l$), gas concentration, pressure drop, and efficiency.
2.2.1 Water surface tension
The surface tension and density of the liquid are calculated using the exponential regression equation developed by the Design Institute for Physical Properties Research–DIPPR 105 and DIPPR 106 [4] in response to changes in the temperature of the cooling fluid. The surface tension and density equations for water are as follows:
$\sigma =A{{\left( 1-{{T}_{r}} \right)}^{B+C{{T}_{r}}+DT_{r}^{2}+ET_{r}^{3}}}$ (1)
where, Tris the ratio of the temperature of the liquid (K) to its critical temperature (Tc), expressed as T/Tc, and where A, B, C, and E are constants of regression.
For liquids affected by temperature changes, density expresses the ratio of mass per unit volume and can be calculated using Eq. (2):
$\rho =\frac{A}{{{B}^{1+{{\left( 1-\frac{T}{C} \right)}^{D}}}}}$ (2)
where, T is the liquid temperature (K) and A, B, C, and D are constants of regression.
2.2.2 Maximum bubble diameter
The mechanism of gas bubble breakdown can be explained using the stability of the bubble size in the reactor. Using the Rayleigh-Taylor instability approach or the isotropic turbulence theory, the behavior of gas bubbles in a turbulent flow is analyzed to predict the maximum stable size of the bubbles prior to bursting. The Rayleigh-Taylor instability is basically a balance between surface tension and gravitational forces operating on gas bubbles [5]. The bubble will eventually burst if the size of the most recent bubble formed is greater than the size of the first bubble formed. If the diameter of the gas bubble is larger than its critical wavelength, the bubble will also burst. The following equation can be used to determine the stable diameter of the maximum bubble [6].
$d_{b}^{max}=4\sqrt{\frac{\sigma }{g\left( {{\rho }_{l}}-{{\rho }_{g}} \right)}}$ (3)
2.2.3 Bubble velocity
Gas bubbles formed in a liquid as a result of gas injection pressure will rise at a specific velocity determined by the surface tension of the liquid and the size of the bubble itself. The velocity of gas bubbles is calculated using the following equation [7]:
${{v}_{b}}=\sqrt{\frac{2\sigma }{{{\rho }_{l}}{{d}_{b}}}+\frac{g{{d}_{b}}}{2}}$ (4)
where, vb is the gas bubble velocity (m/s), vcis the liquid circulation velocity (m/s), vg is the incoming gas velocity (m/s), eg is the retained gas volume, el is the retained liquid volume, ρ is the density (kg/m3), $\sigma$ is the surface tension (N/m), and g is the gravitational constant (g = 9.81 m/s2).
2.2.4 Bubble and liquid resistance
The bubble resistance of gases and liquids is a dimensionless design parameter that defines the transport phenomenon of a bubble column system as the volume fraction of the gas phase occupied by gas or liquid bubbles. The retention of gas in a bubbling column is primarily determined by the superficial velocity of the gas, which is the average velocity of the gas sprayed into the column. Based on this definition, the overall resistance of the gas in the bubble column can be determined using the bed expansion method [8, 9] as shown below:
${{\varepsilon }_{g}}=\frac{{{V}_{g}}}{{{V}_{l}}+{{V}_{g}}}=\frac{{{h}_{d}}-{{h}_{l}}}{{{h}_{d}}}$ (5)
${{\varepsilon }_{l}}=1-{{\varepsilon }_{g}}$ (6)
where, Vg is the volume of the gas phase (bubbles), Vl is the volume of the liquid phase, V is the total volume of the gas-liquid mixture, hl is the initial height of the liquid, and hd is the dynamic height of the gas-liquid system.
2.2.5 Bubble circulation velocity
Bubbles will form in a liquid when a gas is introduced into it at a specific velocity. The liquid will circulate in the column if the gas is continuously flowing. The velocity value resulting from the circulation of this liquid can be determined using the following formula [7].
${{v}_{c}}=1.36{{\left[ gD\left( {{v}_{g}}-{{\varepsilon }_{g}}{{v}_{b}} \right) \right]}^{\frac{1}{3}}}$ (7)
2.2.6 Gas bubble circulation time
Circulation time (t) is the ratio between the diameter of the bubble and its slip velocity. The bubble slip velocity is the bubbles' relative velocity to the circulating liquid. The velocity of liquid circulation and bubbles is calculated using Eq. (8).
$t=\frac{{{d}_{b}}}{{{v}_{c}}-{{v}_{b}}}$ (8)
2.2.7 Exit gas concentration
The exit gas concentration is the ratio of the gas velocity and concentration entering the liquid to the total velocity of gas bubble production and gas velocity. The concentration of the exit gas can be determined using the following formula [10, 11]:
${{C}_{out}}=\frac{{{v}_{g}}}{{{\varepsilon }_{b}}{{v}_{b}}+{{v}_{g}}}{{C}_{in}}$ (9)
2.2.8 Pressure drop
The pressure drop value is the result of bubble formation, droplet formation, and bubble frequency. Bubble formation has a greater impact on pressure drop than the droplet interface. Since the viscosity of the organic and aqueous phases differs significantly, the pressure drop caused by friction on the aqueous phase has the least impact on the total pressure drop [12].
$\Delta p=\left( {{\rho }_{l}}g{{h}_{l}} \right)+\frac{4{{\sigma }_{l}}}{{{d}_{b}}}-0.5{{\rho }_{g}}v_{b}^{2}-\frac{4{{\sigma }_{g}}}{{{d}_{b}}}$ (10)
In general, there are three methods for reducing tar compounds and impurity particles, i.e., impaction, absorption, and diffusion. The impaction method is very effective for particles larger than 0.1 m, whereas the diffusion and absorption methods are effective for particles smaller than 0.1 m [13]. The results of the cyclone analysis indicated that particles with a cut-size diameter between 0.828 m and 0.892 m at temperatures between 30℃ and 70℃ could be removed, allowing the syngas, which still contains smaller sized particles not captured by the cyclone, to enter the wet scrubber. The tar can be eliminated with considerably less effort by employing a bubble-flow type wet scrubber.
The efficiency of a wet scrubber is determined by the type of liquid, particle size, gas velocity, and temperature of the coolant. The performance of wet scrubbers was evaluated using water as the cleaning medium and syngas for cooling. Water is a polar substance that can be used to dissolve other polar substances. Tar class 2 is easily soluble in water and consists of phenol compounds and their polar derivatives. Nonetheless, if the tar produced by the biomass gasification process is non-polar (classes 3 and 4), then water molecules cannot dissolve this type of tar [3]. When the water reaches equilibrium temperature, its capacity to absorb tar will decrease. Increased water temperature also results in water evaporation, which decreases tar absorption. By reusing the cooling water that was previously used, this problem can be solved.
3.1 Temperature distribution, gas and water physical properties
The temperature distribution of gas and water in the wet scrubber equipment used for syngas cleaning can be seen in Figure 3. During the gasification time range of 50–100 minutes, the water temperature rises from 45–50℃ after the gas enters the scrubber. After 150 minutes, the temperature of water and gas tends to remain constant between 50 and 55℃. This condition indicates that heat has been transferred from syngas containing impurities and other compounds to water, which serves as a coolant and cleaning agent.
Figure 3. Temperature distribution on the wet scrubber equipment unit
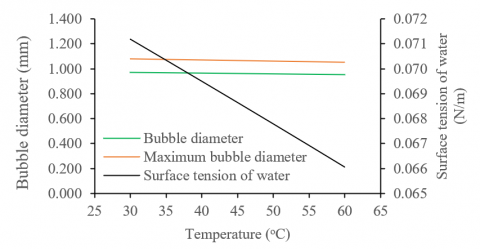
As a result of accumulation, the water temperature will gradually rise. This also affects the temperature of the released gas, which increases to 35–45℃ or decreases by 10–15℃ on average when absorbed by water. Temperature variations have an effect on the cleaning water gas's physical properties, i.e., the density and surface tension. The density of gas and water is calculated using Eq. (2), where the density and surface tension values of water at temperatures of 30, 35, 40, 45, 50, 55 and 60oC obtained are 995.87, 992.66, 989.42, 986.14, 982.83, 979.48, and 976.09 kg/m3, respectively; meanwhile the surface tension values of water are 0.071, 0.070, 0.069, 0.069, 0.068, 0.067, and 0.066 N/m, respectively. Temperature variations caused by the interaction of water and gas will have an effect on bubble characteristics, gas concentration, and pressure drop.
3.2 Bubble wet scrubber characteristics
The performance of a submersible wet scrubber system is determined by the size of the bubbles since a larger surface area of the bubbles transfers more heat [14]. According to the findings of the study, the effect of the temperature of the gas when it is in contact with the cooling water shows that the bubble diameter will decrease when the temperature of the cooling water increases (Figure 4). The diameter of the bubbles that formed was 0.973 cm at 30℃, 0.970 cm at 35℃, 0.967 cm at 40℃, 0.964 cm at 45℃, 0.961 cm at 50℃, 0.958 cm at 55℃, and 0.955 cm at 60℃. Under all conditions of gas and water temperature, it is assumed that the average diameter of the formed bubbles is constant. Meanwhile, the maximum diameter of the bubble when it is about to burst is 1,081 cm; 1077 cm; 1072 cm; 1067 cm; 1062 cm; 1057 cm; and 1.052 cm. The inertial and buoyant forces are responsible for the constant volume of formation and coalescence of bubbles [15].
The frequency of small bubble formation increases with increasing temperature, whereas large bubbles form at low temperatures; the bubble size distribution is greatest at 18℃ compared to 25℃ and 35℃ [16]. Water temperature changes contribute to the formation of bubbles, which affect water viscosity and surface tension. Compared to surface tension, which appears to have a lesser effect on bubble formation, viscosity has a significant effect on bubble formation. The higher the viscosity of the fluid, the greater the increase in the fractional area of flow for the circulating fluid. If the gas is injected below the surface of the liquid in a wet scrubber at a rate that is not constant, it will cause the formation of non-uniform bubbles that are discontinuous and will lead to continuous coalescing [17].
Figure 4. The effect of temperature on the surface tension of water and bubble diameter
Temperature has an impact on the formation of bubble diameter as well as the velocity at which bubbles move through water. Based on Eq. (7), which describes the relationship between the physical properties of water, gas, and bubble diameter as well as the effect of gravity, the bubble velocity is found based on changes in water temperature, i.e., 0.250 m/s (30℃), 0.250m/s (35℃), 0.249 m/s (40℃), 0.248 m/s (45℃), 0.248 m/s (50℃), 0.247 m/s (55℃). The decrease in bubble velocity is affected by the surface tension of the water, and the force required to move in water is less per trajectory (Figure 5). The relationship between the gas resistance and gas flow rate is linear.
In the homogeneous flow regime, bubble resistance decreases velocity, whereas in the transitional flow regime, the presence of large bubbles and increased circulation (which increases bubble velocity) reduces gas retention. Low viscosity stabilizes homogeneous flow patterns and enhances gas retention, which is characterized by the formation of an abundance of small bubbles. In contrast, increased viscosity disrupts the homogeneous flow regime and decreases gas retention, causing the bubble size distribution to shift toward larger bubbles [18].
This also influences the circulation velocity of the bubbles, which move at 1.598 m/s in 0.007 seconds. The velocity of bubble circulation is affected by water level and gas resistance. The gas resistance (eb) displays a value of 0.10 when the water level (H) in the scrubber is maintained at 13.5 centimeters. This indicates that the percentage of gas that is retained in the circulating water reaches 10%.
Pressure drop in mass transfer equipment determines liquid hold-up, surface contact area, and operating costs [19]. Figure 6 presents a the relationship between water temperature and pressure drop in a wet scrubber. The water temperature rises by 30-60℃ when the average gas velocity remains the same at 7.9 m/s, which leads to a lower pressure drop. An increase in the temperature of water causes a decrease in its surface tension, which in turn results in a reduction in the amount of force that is generated by the friction that exists between the liquid and the gas.
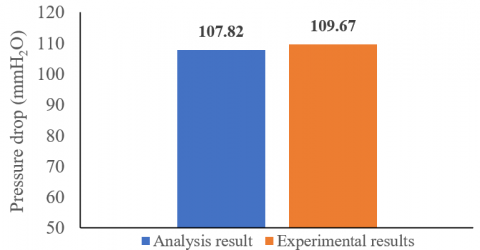
There is a significant difference of 1.60% between the measured value of 109.67 mmH2O and the calculated value of 107.82 mmH2O that was derived from Eq. (10), which indicates that the average pressure drop value is significantly lower than the measured value. Figure 7 presents a comparison of pressure drop measurement and experimental results. Impurities and tar will begin to accumulate in the water as the pressure continues to rise over time. Due to this, there is a greater drag force, which results in an even greater difference in velocity [20]. With the difference between the measurement results and the analysis, it can be concluded that the developed wet scrubber with a cooling water capacity of 2.6 L is capable of operating to support the gasification system.
Figure 5. Effect of water temperature and bubble velocity
Figure 6. The relationship between water temperature and pressure drop in a wet scrubber
The bubble will expand as it moves up due to the decrease in static pressure (Figure 6). This must be considered because the terminal velocity of the same molecule in a surfactant solution (where molecules with hydrophilic groups combine with water and molecules with lipophilic groups combine with oil/fat) will be delayed at the top of the water column, resulting in larger bubbles [21]. The effect of increasing temperature on drop pressure, density, viscosity, and surface tension will reduce bubble size and maximum bubble size, as well as the rate of bubble coalescence [22].
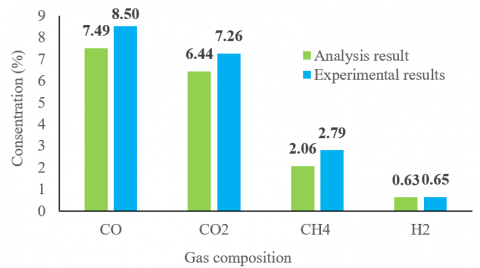
The relationship between water and gas temperature parameters and the formation of bubble characteristics by the syngas flow will have a significant impact on the concentration of syngas produced. The measured gas concentration values are calculated by using Eq. (9) to predict the concentration of the gas produced after the cleaning process. As a result, CO (7.73%), CO2 (6.64%), CH4 (2.13%), and H2 (0.65%) are the predicted initial measured gas concentration values obtained from syngas measurements leaving the cyclone.
Table 1 displays the generated predictions of syngas concentration based on the influence of the previously discussed parameters, as well as a comparison between the results of the analysis and the experiments conducted (Figure 8).
Figure 7. Comparison of pressure drop measurement and experimental results
Table 1. Predicted syngas concentration
|
Syngas |
Concentration (%) |
||
|
Before |
After |
Prediction |
|
|
CO |
7.73 |
8.50 |
7.71 |
|
CO2 |
6.64 |
7.26 |
6.62 |
|
CH4 |
2.13 |
2.79 |
2.12 |
|
H2 |
0.65 |
0.65 |
0.65 |
Figure 8. Comparison of analysis results and syngas concentration experiments
The prediction results show error rates of 9.00% (for CO and CO2), 24.00% (for CH4), and 0.00% (for H2). This demonstrates that the relationship equation used in this analysis can be relied on to predict the CO, CH4, and H2O concentration values that exit the wet scrubber system via a bubble flow pattern.
The wet scrubber device was developed by using water as a cleaning medium and cooling syngas from empty fruit bunch gasification with a gas flow pattern in contact with water to form syngas-filled bubbles. This study measures and analyzes pressure drop, which is an important parameter in determining the device's power requirements for flowing gas. The results of the experiment's analysis and measurements revealed a 1.60% difference in error between the measured and analytical pressure values of 109.67 and 107.82 mmH2O, respectively. The characteristics of the bubbles produced have a significant impact on the concentration of syngas that remains after leaving the scrubber device, and the concentration of syngas is 9.00% for CO and CO2, 24.00% for CH4, and 0.00% for H2 based on the findings of this study. Tar compounds that can be removed by this device include phenol, acetic, and guaicol compounds with concentrations of up to 66.48%. The scrubber's efficiency for removing particles and tar from syngas is 83.26%, which matches the findings of several studies.
This research was supported by the Ministry of Finance of the Republic of Indonesia through the Indonesia Endowment Funds for Education (Lembaga Pengembangan Dana Pendidikan or LPDP scholarship) and the Ministry of Education, Culture, Research, and Technology of the Republic of Indonesia.
|
Cin |
Entre gas concentration |
% |
|
Cout |
Exit gas concentration |
% |
|
d |
Gas pipe diameter |
m |
|
db |
Gas bubble diameter |
m |
|
D |
Diameter scrubber |
m |
|
eg |
Retained gas volume |
m3 |
|
el |
Retained liquid volume |
m3 |
|
g |
Gravitational constant |
m/s2 |
|
H |
Height scrubber |
m |
|
hd |
Dynamic water level |
m |
|
h1 |
Water height |
m |
|
h2 |
Empty height |
m |
|
t |
Circulation time |
s |
|
T |
Liquid temperature |
K |
|
Tc |
Critical temperature |
K |
|
Tr |
Ratio of the temperature of the liquid |
K |
|
vb |
Gas bubble velocity |
m/s |
|
vc |
Liquid circulation velocity |
m/s |
|
vg |
Gas velocity |
m/s |
|
V |
Water volume |
L |
|
Vg |
Volume of the gas phase |
m3 |
|
Vl |
Volume of the liquid phase |
m3 |
|
$\Delta p$ |
Pressure drop |
mH2O |
|
$\varepsilon_b$ |
Gas bubble resistance coefficient |
- |
|
$\varepsilon_l$ |
Liquid hold-up coefficient |
- |
|
$\rho_l$ |
Density liquid |
kg/m3 |
|
$\rho_g$ |
Density gas |
kg/m3 |
|
$\sigma$ |
Surface tension |
N/m |
|
A, B, C, D, E |
Constants of regression |
- |
[1] Woolcock, P.J., Brown, R.C. (2013). A review of cleaning technologies for biomass-derived syngas. Biomass and Bioenergy, 52: 54-84. https://doi.org/10.1016/j.biombioe.2013.02.036
[2] Hasler, P., Nussbaumer, T. (1999). Gas cleaning for IC engine applications from fixed bed biomass gasification. Biomass Bioenergy, 16: 385-95. https://doi.org/10.1016/S0961-9534(99)00018-5
[3] Balas, M., Lisy, M., Kubicek, J., Pospisil, J. (2014). Syngas Cleaning by Wet Scrubber. WSEAS Transactions on Heat and Mass Transfer, 9(1): 195-204.
[4] DDBSP. (2014). Pure Component Equations: Fitting of Pure Component Equations Dortmund Data Bank Software Package, [GR]: Jerman, DDBST Software & Separation Technology GmbH, p7. https://www.ddbst.com/files/files/ddbsp/2020/Documentation/PCPEq.Fit.pdf.
[5] Wilkinson, P.M., van Dierendonck, L.L. (1990). Pressure and gas density effects on bubble break-up and gas hold-up in bubble columns. Chemical Engineering Science, 45(8): 2309-2315. https://doi.org/10.1016/0009-2509(90)80110-z
[6] Grace, J.R., Wairegi, T., Brophy, J. (1978). Break-up of drops and bubbles in stagnant media. The Canadian Journal of Chemical Engineering, 56(1): 3-8. https://doi.org/10.1002/cjce.5450560101
[7] Mendelson, H.D. (1967). The prediction of bubble terminal velocities from wave theory. AIChE Journal, 13(2): 250-253. https://doi.org/10.1002/aic.690130213
[8] Xue, J., Al-Dahhan, M., Dudukovic, M.P., Mudde, R.F. (2008). Four-point optical probe for measurement of bubble dynamics: Validation of the technique. Flow Measurement and Instrumentation, 19(5): 293-300. https://doi.org/10.1016/j.flowmeasinst.2007.10.004
[9] Rollbusch, P., Becker, M., Ludwig, M., Bieberle, A., Grünewald, M., Hampel, U., Franke, R. (2015). Experimental investigation of the influence of column scale, gas density and liquid properties on gas holdup in bubble columns. International Journal of Multiphase Flow, 75: 88-106. https://doi.org/ 10.1016/j.ijmultiphaseflow.2015.05.009
[10] Hikita, H., Kikukawa, H. (1974). Liquid-phase mixing in bubble columns: Effect of liquid properties. The Chemical Engineering Journal, 8(3): 191-197. https://doi.org/10.1016/0300-9467(74)85024-0
[11] Anabtawi, M.Z, Ibrahim, G.A. (1996). Gas holdup and volumetric liquid-phase mass transfer coefficient in a spout-fluid bed. Journal of Chemical Engineering of Japan, 29(1): 20-24. https://doi.org/10.1252/jcej.29.20
[12] Mândrea, L., Oprina, G., Chihaia, R.A., El-Leathey, L.A., Mirea, R. (2017). Theoretical and experimental study of gas bubbles behavior. International Journal of Modeling and Optimization, 7(3): 145-151. https://doi.org/10.7763/IJMO.2017.V7.574
[13] EPA. (2002). US EPA, Air Pollution Control Cost Manual. EPA/452/B-02-001, Research Triangle Park, NC. https://www.epa.gov/sites/default/files/2020-07/documents/cost_toc.pdf.
[14] Abdulwahid, A.A., Situ, R., Brown, R.J. (2018). Underground diesel exhaust wet scrubbers: current status and future prospects. Energies, 11(3006): 1-2. https://doi.org/10.3390/en11113006
[15] Higuera, F.J., Medina, A. (2006). Injection and coalescence of bubbles in a quiescent inviscid liquid. European Journal of Mechanics-B/Fluids, 25(2): 164-171. https://doi.org/10.1016/j.euromechflu.2005.06.001
[16] Zhang, X., Dong, H., Huang, Y., Li, C., Zhang, X. (2012). Experimental study on gas holdup and bubble behavior in carbon capture systems with ionic liquid. Chemical Engineering Journal, 209: 607-615. https://doi.org/10.1016/j.cej.2012.08.047
[17] Bandyopadhyay, A., Biswas, M.N. (2006). Fly-ash scrubbing in a tapered bubble column scrubber. Process Safety and Environmental Protection, 84(1): 54-62. https://doi.org/10.1205/psep.05040
[18] Besagnia, G., Inzolia, F., De Guidob, G., Pellegrinib, L.A. (2017). The dual effect of viscosity on bubble column hydrodynamics. Chemical Engineering Science, 158(2): 509-538. https://doi.org/10.1016/j.ces.2016.11.003
[19] Dragan, S., Miclaus, A.G. (2016). Hydrodynamic parameters of gas-solid-liquid three phase fluidized bed with low density solids. Revista de Chimie -Bucharest- Original Edition, 67(5): 887-891. http://bch.ro/pdfRC/DRAGAN%20S%205%2016.pdf
[20] Thapa, S., Indrawan, N., Bhoi, P.R., Kumar, A., Huhnke, R.L. (2019). Tar reduction in biomass syngas using heat exchanger and vegetable oil bubbler. Energi, 175: 402-409. https://doi.org/10.1016/j.energy.2019.03.045
[21] Zhang, Y., Sam, A., Finch, J. (2003). Temperature effect on single bubble velocity profile in water and surfactant solution. Colloids and Surfaces A: Physicochemical and Engineering Aspects, 223(1-3): 45-54. https://doi.org/10.1016/s0927-7757(03)00189-4
[22] Lin, T.J., Tsuchiya, K., Fan, L.S. (1998). Bubble flow characteristics in bubble columns at elevated pressure and temperature. AIChE Journal, 44(3): 545-560. https://doi.org/10.1002/aic.690440306