Nadir Benamira* | Azzeddine Dekhane | Samir Kerfali | Abdelkarim Bouras | Omar Reffas
© 2022 IIETA. This article is published by IIETA and is licensed under the CC BY 4.0 license (http://creativecommons.org/licenses/by/4.0/).
OPEN ACCESS
Numerous studies examine the electrical and mechanical, internal and exterior problems of induction motors separately. However, this type of machines is also susceptible to several combined faults which affect it at the same time. The aim of this work is to study firstly the effects of the mass imbalance with the supply voltage unbalance faults in a combined state, and specifically its effects on the stator currents (distortion of currents waveform and augmentation of current unbalance factor (CUF)). The findings of this research were derived from experimental tests, which enabled us to produce the combined voltage and mass imbalance fault intentionally. The second purpose of this paper is to identify these irregularities. In the field of induction motor fault diagnosis, the stator current analysis techniques have shown to be quite successful and have gained widespread use. Therefore, we used the well-known method motor current signature analysis (MCSA). In addition, we have strengthened the research by using spectral analysis on the Park's components (Id and Iq). The obtained results demonstrate the efficacy of analyzing stator currents and Park components spectra (particularly the direct Park component (Id)) for detecting this kind of electrical and mechanical combined defects.
induction motors, mass unbalance, voltage unbalance, combined faults detection, MCSA, park currents analysis
Induction motors (IMs) are a category of devices widely used in various domains, including industrial and residential applications; they represent a popular choice for a lot of applications due to their dependability, ruggedness, low maintenance requirements, and affordable pricing. Pumps, compressors, blowers, fans, machine tools, cranes, conveyors, and electric vehicles are all applications where induction motors are used. Whose state must be effectively detected, these electromechanical systems must be reliable and available to ensure continuous and trouble-free operation in the industry [1].
Nevertheless, integrated IM must deal with industrial and environmental conditions and witnesses different types of stresses that cannot be avoided. These stresses can be caused by harsh and dusty environments, improper power or voltage, overload or unbalanced load, contamination and corrosion, manufacturing fault and natural aging. These stresses lead to various unexpected faults in different components of the IM [1, 2].
Most of the time, these faults are not noticed immediately, leading to a catastrophic motor failure [1]. Therefore, these faults can cause huge cost damages [3]. So, online condition monitoring of these electric machinery is a challenging duty for early stages detection of failures manifestation [3]. Nowadays, to avoid these sudden faults, serious attention is given to predictive maintenance and to the development of new diagnosis methods [3]. Several effective methods are employed to collect information on the induction motors components, for example bearing faults. Among these methods, the stator currents signatures analysis is an efficient procedure that used to detect induction motors faults [4].
One of the issues that have been looked at and identified as problematic in induction motors is mechanical mass unbalance fault. This fault has been the subject of investigation and analysis in a wide variety of researches, including [5-9], and a great deal of other individuals. This is due to its numerous detrimental impacts on the class mentioned above of devices. Several studies have examined the anomaly of imbalanced supply voltage situations in terms of its harmful effects on induction motors and its diagnosis and detection. For example, we refer to the following study: Throughout [10], the unbalance in the voltage magnitude, and phase angle of a three-phase induction motor is explored and detected as one of the first examples. The diagnosis of imbalanced voltage based on numerical simulation and experimental tests [11]. Three new indices based on current measurements [12]. These indices are used in conjunction with the line voltage unbalance ratio (LVUR) to evaluate the impact of unbalanced voltage abnormally. Dekhandji et al. [13] assessed the performance of the induction motor under unbalanced three phase supply voltage circumstances. Gonzalez-Cordoba et al. [14] presented a way for obtaining a time-protection model for induction motors against voltage imbalance circumstances. Hussain et al. [15] described various defect detection techniques for three-phase induction motors. Among these flaws is the imbalanced supply voltage.
The simultaneous occurrence of these two defects in real life may be possible, and if it does, the combined impact they have on three-phase asynchronous motors can be quite detrimental.
An experimental study is an innovative idea that has the potential to enrich scientific research in the field of induction motors fault detection, which is the primary objective of this paper. In this work, we explore the possibility of studying experimentally these two faults in a combined state, analyzing their effects, and diagnosing them. This is the primary objective of this paper. This concept was designed to achieve this aim.
The findings also show that the afflicted phase that produced the voltage unbalance may be identified by comparing the three-phase currents spectra in the defective condition. Also, these two unbalances conditions may be determined simultaneously by monitoring their stator currents frequency signatures.
The following is the outline for this paper: Section 1 is dedicated to the introduction. In section 2, the conceptual underpinnings of the suggested diagnosis techniques and definitions of the faults that have been researched are discussed. The presentation of the experimental setup, as well as the data acquisition, is going to take place in Section 3. Section 4 presents the stator currents measurements and the results obtained by the employed analysis techniques. Additionally, the results discussions of normal and faulty circumstances are included in section 4. Finally, the conclusion of the paper is given in section 5.
2.1 Motor current signature analysis
Motor current signature analysis is one of the most successful diagnosis techniques of induction motors faults that have been used in many researches. In order to analyze the data of the stator current signal, a fast Fourier transform (FFT) is executed [16]; which is a mathematical procedure to extract the frequency information from the time domain data and transform it into the frequency domain [16]. The next step of analysis is calculation of frequencies characteristic for specific fault [17].
2.2 Spectral analysis of direct and quadrature components of Park’s transformation
In 1929, Robert H. Park presented a mathematical transformation which simplified the study of three phase systems [18]. By applying Prak’s transformation, the information from the three phase currents (IA, IB and IC) is combined in two equivalent currents (Id and Iq). Therefore, it has been shown in several studies that the Park vector includes all the information of the three phase stator currents [7]. The current components of the Park’s transformation are expressed as [19]:
$I_d=\sqrt{\frac{2}{3}} I_A-\frac{1}{\sqrt{6}} I_B-\frac{1}{\sqrt{6}} I_C$
$I_q=\frac{1}{\sqrt{2}} I_B-\frac{1}{\sqrt{2}} I_C$ (1)
where, Id and Iq are the direct and quadrature currents; IA, IB and IC are the three phase currents.
So, the Idea of this work is to applied spectral analysis to Id and Iq components and to see their changes under normal and malfunction circumstances.
Under these hypotheses and according to the Eq. (1), all the information carried by the original three phase system is contained in the single direct component Id [20], hence, the spectral analysis of the Id component, gives more significant spectrum than that obtained by the conventional spectral analysis [21].
2.3 Mass unbalance fault
Rotor mechanical unbalance is the unequal mass distribution around the rotation center; this fault is the most common problem in induction motors [6]. The main cause of rotor unbalancing is manufacturing fault. Manufacturing flaw is the primary factor in rotor unbalance. However, the nonsymmetrical addition or removal of mass around the rotor's rotational center might cause this problem even after a sudden period of operation. Additionally, internal misalignment or shaft bending caused by thermal expansion may result in rotor unbalancing fault [5].
This inadequate mass is subjected to a centrifugal force which may cause serious problems in high-speed rotating machines [5, 8]. The rotor is pulled away from the center of the stator bore by this imbalance force, which leads to torque oscillations at frequencies related to the motor speed [5, 8]. Hence, in this instance, the stator current spectrum presents harmonic peaks at particular frequencies as presented in the following equation [8]:
$f_{\text {unb }}=f_s \pm k f_{\text {rot }}$ (2)
where, funb is the mass unbalance defect frequency; fs is the supply frequency (fs=50 Hz); frot is the rotation frequency; k=1, 2, 3 …
2.4 Voltage unbalance fault
Voltage unbalance is repeatedly encountered phenomena in electric power distribution system [12]. Directly or indirectly, an induction motor may be supplied by a three-phase power system [13]. Consequently, poor power quality, such as harmonics, sags, swells, and unbalanced voltage, may deteriorate the performance of induction motors [13]. When the voltage magnitudes of a three-phase system are unequal and/or vary by a phase angle of 120°, an unbalanced voltage situation exists [14].
Voltage unbalance has dangerous effects on induction motors including overheating, high unbalanced, power losses, derating, torque pulsation, inefficiency, etc. [13].
Unbalanced supply voltage will generate sidebands frequencies in the spectrum of the stator current upon occurrence of fault at [15, 22]:
$f_{\text {unv }}=(1+2 k) f_s$ (3)
where, funv is the unbalanced voltage fault frequency; fs is the supply frequency; k=1, 2, 3…, $k \in$ ℕ.
It should be noted that the simulation results of the work [15] which studied a 20 V under voltage fault, shows a sideband frequency generated at 150 Hz (3rd) component, which indicates the presence of the voltage supply unbalance fault, and this is according to Eq. (3).
2.4.1 Voltage unbalance standards definitions
When measuring and calculating the voltage imbalance in line with the various standards, we use a few distinct definitions. The following is a statement of these definitions:
NEMA (National Equipment Manufacturer’s Association) definition. NEMA defines the unbalanced voltage as the line voltage unbalance rate (LVUR) its equation is given by [23, 24]:
$\operatorname{LVUR(\% )}=\frac{\operatorname{Max}\left[\left|V_{A B}-V_{a v g}\right|,\left|V_{B C}-V_{a v g}\right|,\left|V_{C A}-V_{a v g}\right|\right]}{V_{a v g}} \quad \times 100$ (4)
where, VAB, VBC and VCA are line –to– line voltages.
And,
$V_{a v g}=\frac{V_{A B}+V_{B C}+V_{C A}}{3}$ (5)
IEEE (Institute of Electrical and Electronics Engineers) Definition. The IEEE describes also the voltage unbalance as the phase voltage unbalance rate (PVUR), its formula is given by [23, 24]:
$PVUR (\%)=\frac{\operatorname{Max}\left[\left|V_A-V_{\text {avg }}\right|,\left|V_B-V_{\text {avg }}\right|,\left|V_C-V_{\text {avg }}\right|\right]}{V_{a v g}}\quad \times 100$ (6)
where, VA, VB and VC are phase voltages.
And,
$V_{a v g}=\frac{V_A+V_B+V_C}{3}$ (7)
IEC (International Electrotechnical Commission) definition (True definition). The IEC explains the unbalanced voltage as the ratio of the negative sequence voltage component to the positive sequence voltage component. The ratio of Voltage Unbalance Factor (VUF) or true definition with symmetrical components, is given by [23-25]:
$V U F(\%)=\frac{V_2}{V_1} \times 100$ (8)
where, V1(Vp or V+) and V2(Vn or V-) signify the positive and negative sequence phase voltage components. These components can be computed with the application of the well-known Fortescue transformation in the complex plane, as the following matrix formula:
$\left[\begin{array}{l}V_0 \\ V_1 \\ V_2\end{array}\right]=\frac{1}{3}\left[\begin{array}{ccc}1 & 1 & 1 \\ 1 & a & a^2 \\ 1 & a^2 & a\end{array}\right]\left[\begin{array}{l}V_A \\ V_B \\ V_C\end{array}\right]$ (9)
where, VA, VB and VC are the three-phase voltages; V0 represent the zero (or homopolar) sequence component; a=e j (2π / 3) is the Fortescue operator.
2.5 Current unbalance calculation in a three phase system
2.5.1 Symmetrical components
The unbalance quantity of currents is calculated by the ratio of negative to positive sequences. The ratio of the Current Unbalance Factor (CUF) is given by [26, 27]:
$C U F(\%)=\left|\frac{I_2}{I_1}\right| \times 100$ (10)
where, I1 (Ip or I+) and I2 (In or I-) are the positive and negative sequences of the stator currents.
In a similar manner to Eq. (9), I1 and I2 can be calculated as follow [28]:
$\left[\begin{array}{l}I_0 \\ I_1 \\ I_2\end{array}\right]=\frac{1}{3}\left[\begin{array}{ccc}1 & 1 & 1 \\ 1 & a & a^2 \\ 1 & a^2 & a\end{array}\right]\left[\begin{array}{c}I_a \\ I_b \\ I_c\end{array}\right]$ (11)
A test bench has enabled the suggested induction motor abnormalities and their detection via the analysis of stator currents.
There are previous studies and researches based on this experimental setup, some examples of these researches include [7, 9, 11, 21].
These studies have investigated various faults separately, such as mechanical unbalance, voltage unbalance, rotor broken bars and bearing faults. Therefore, studying the combined faults is considered new work that adds a contribution to these previous researches.
Figure 1. Schematic representation of the proposed experimental test rig
The different test components and instruments consist of the following:
A three-phase IM with the following specifications: 270 W; 50 Hz; Y connection; 220 V; 1,43 A; 2 pole pair; 1400 rpm.
The artificial mechanical imbalance is generated by fixing an additional mass of m=90 g on a disc attached on the side coupling rotor shaft.
Then, the voltage imbalance is established by following the steps below: The phases B and C were directly connected to the alternate power supply, the phase A and the neutral wire have been linked to a single phase autotransformer to produce any desired voltage from 220 V to a null voltage. In this experiment, we decreased about 9% (upper than this percentage by a negligible value) in the RMS value of the phase A voltage.
The stator currents were measured using a current sensor attached to a digital oscilloscope HAMEG 507 equipped with an acquisition card and connected to a personal computer. The data processing is performed using MATLAB software. Figure 1 shows a schematic illustration of the experimental test apparatus.
4.1 Stator currents measurement
4.1.1 Normal condition
Figure 2 depicts the experimental three-phase stator currents absorbed by the induction motor under typical working conditions. This graph demonstrates that the three-phase currents are broadly balanced. As seen in Figure 2, this operating state is deemed normal because the amplitudes are almost similar.
Figure 2. The measured three phase stator currents in normal operating condition
Figure 3 depicts the time domain of direct and quadrature currents and the Park's Vector Modulus (PVM). In case of normal condition of an ideal machine. The supply current has only a positive sequence component, resulting in a constant PVM [29]. Nonetheless, in actual practice as in this research, there is always small degree of imbalance resulting in an alternative curve of Park's vector modulus with T=1/(2fs) and modest amplitude. The presence of this imbalance is due to the inherent asymmetry in induction motors, also it can be proved by the measurement of the three phase currents and by the guarantee that the supply voltage source was balanced [29].
Figure 3. The direct and quadrature currents and the Park’s vector modulus in normal condition
4.1.2 Combined faults condition
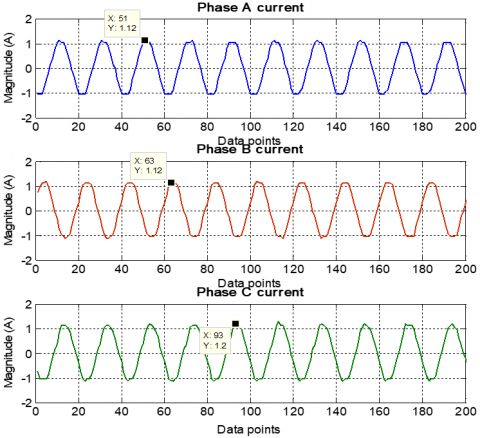
As previously stated, exposing the induction motor to voltage and/or mass imbalances has several negative consequences. Figure 4 depicts the experimental three phase stator current findings with 9% under voltage in phase A and a mass imbalance of 90 g at the same time. In comparison to normal operation condition, there is a modest decrease in the amplitude of the phase A current (1,12 A to 1,01 A) and a significant increase in the phase B and C amplitudes (especially phase B). These severely unbalanced currents on the stator are considered the worst effect.
Figure 4. The measured three phase stator currents under voltage and mass unbalances condition
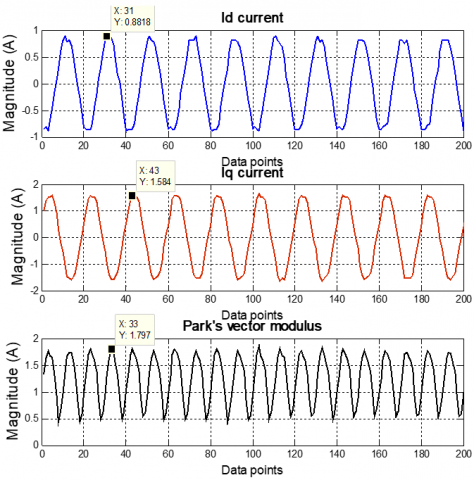
Figure 5 illustrates the direct and quadrature currents and the Park’s vector modulus in the combined voltage and mass unbalances faults, it is observed that the amplitudes of the signals are increased. Also, we can clearly distinguish the distortion of the PVM signal comparing to the normal case one. These signs indicate that the induction motors are working under faulty conditions.
Figure 5. The direct and quadrature currents and the Park’s vector modulus under voltage and mass unbalances condition
4.1.3 Effects of the combined unbalances faults on the stator currents
Figure 6 shows the evolution of the stator currents peak values in faulty case compared to normal conditions so that the influence of these combined unbalances faults on stator currents can be visualized more clearly. In addition, the CUF is provided for both operating circumstances; the CUF was calculated according to the Eq. (10), and using the website [30] to determine I1 and I2 currents.
Figure 6. Evolution of the peak values of the stator currents in normal condition and with combined unbalances faults
It can be observed that even in an average instance, a nominal value of the current imbalance occurs (CUF=2.6%). due to the small unbalances existing in both power supply systems and induction motors. However, in the faulty case we can clearly observe the huge unbalance of the stator currents, especially phase B, and the CUF has reached in this case 21.17%. Because of this value of the current imbalance, the machine may have serious problems such as excessive heating, losses, and reduction of efficiency. To this list of topics, you must now add the considerable vibrations effects brought on by the mass imbalance fault.
4.2 Stator currents analysis
4.2.1 Normal condition
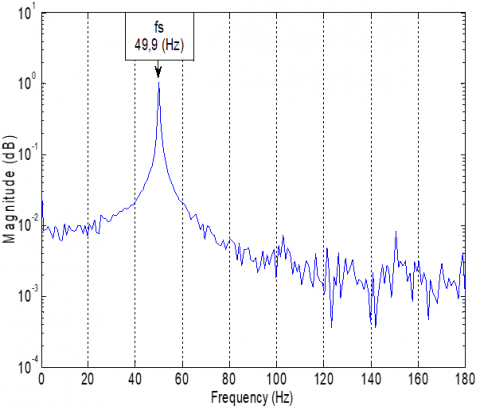
Figure 7 shows the spectrum of the phase A stator current for a normally working induction motor at no load condition. This spectrum is presented between the frequency ranges [0-450 Hz] and [0–180 Hz], the principal spectral component that appears in this situation is the first harmonic fs (Which according to our findings, is equal to 49.9 Hz), indicating that the equipment is working as it should. In addition to the fundamental component fs, we can observe the presence of other spectral components such as 150 Hz, 250 Hz, and 350 Hz. This is because of the previously mentioned reasons, which were represented in the small unbalance in the supply network and the inherent asymmetry of induction motors.
(a) Frequency range of [0 – 450 Hz]
(b) frequency range of [0 – 180 Hz]
Figure 7. Spectrum of the phase A stator current corresponding to a normal operating condition
Figure 8 depicts the three phase spectra in low frequencies range [0-180 Hz], for a normal state under no load situation. The supply frequency component fs is always noted as the dominant component.
Figure 8. Spectra of the three phase stator currents in normal operating condition
The Park components Id and Iq spectra of the stator currents are portrayed in Figure 9. These spectra are shown during healthy and no load conditions. As is the case with the three phase stator currents spectra, they range from 0 to 180 Hz, and are dominated by the first harmonic fs, which indicates that the machine is functioning correctly.
Figure 9. Spectra of the Id and Iq currents in normal operating condition
4.2.2 Combined faults condition
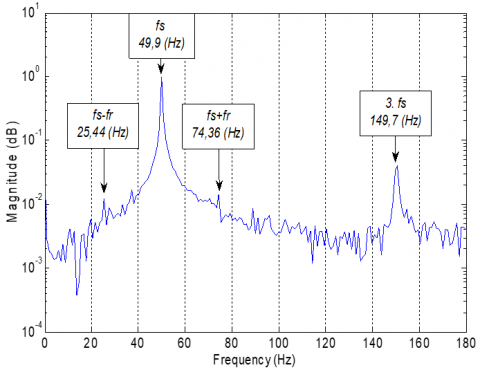
Figure 10 presents the phase A stator current spectrum in the coupled unbalances cases. Starting with the mass unbalance, as we have seen theoretically before, the characteristic frequencies of this fault are on both sides of the fundamental frequency fs. The experiment was realized at no load condition, for the rotation speed of the induction motor, and according to Bouras et al. [7] who utilized the same induction motor, the measured speed (under no load condition and fs=50 Hz) was nrot = 1470 rpm. Therefore, the rotation speed could be determined accurately, and the rotational frequency of the motor is fr = 24.5 Hz. Consequently, according to the Eq. (2), the mass unbalance calculated frequency signatures are funb=[49,9 ± 1. 24,5], then the frequencies are about funb=[25,4 Hz and 74,4 Hz]. For the unbalanced voltage signature, and in accordance with the Eq. (3), also we can obviously see the significant rise of the 3rd harmonic component funv=3.49,9=149,7 Hz, indicating the presence of the voltage unbalance anomaly. The harmonic signatures of the two combined faults are clearly presented in the figure, which demonstrate, the ability of the MCSA technique to identify these faults in the combined state.
(a) Frequency range of [0 – 450 Hz]
(b) Frequency range of [0 – 180 Hz]
Figure 10. Spectrum of the phase A stator current under voltage and mass unbalances condition
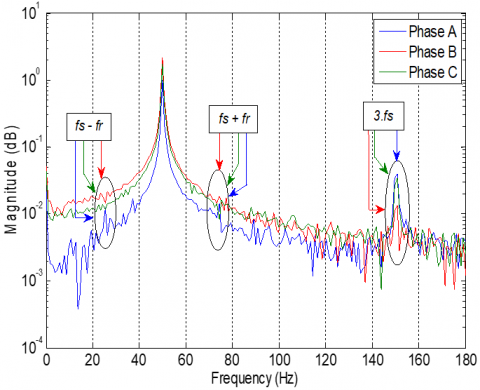
Figure 11 shows the three phase spectra in faulty case plotted in the same plane. This is done so that the effects of these faults on the machine may be shown in a more complete manner. In contrast to the scenario when everything is operating normally, the mass imbalance frequencies (fs±fr) are present, especially in phase A and B spectra. Concerning the voltage imbalance, we can see a significant increase in the third spectral component, most noticeably in phases A and C.
Moreover, we can notice through this figure, that the spectrum A is clearly lower than the rest of spectra, particularly at the beginning, this indicates that the affected phase by the voltage drop is phase A. Additionally, when focusing on the third spectral component of the voltage imbalance, we see that the magnitude of the phase A spectrum is greater than that of the others. This observation also indicates that the affected phase is A. Consequently, by comparing the three phase spectra in the same plane, we can also determine the disruptive phase causing the voltage to be imbalanced.
Figure 11. Spectra of the three phase stator currents under voltage and mechanical unbalances condition
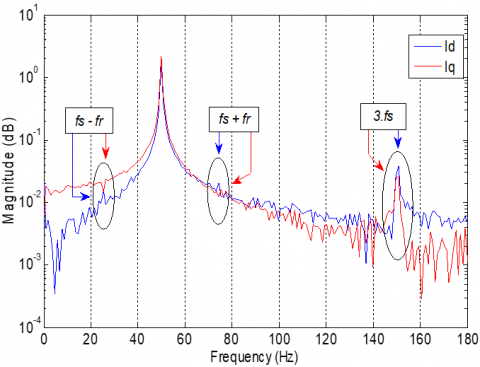
Figure 12 illustrates the spectra of the Id and Iq components under unbalanced operating circumstances. As the spectra of the three phases, we can see the simultaneous emergence of the distinctive frequencies of the two faults with practically the same observations. In addition, it is important to point out that the Id current spectrum appears better the characteristic frequencies of the two faults compared to the Iq current spectrum, this is because the current Id contains all the information of the three phases, as we explained previously (see Eq. (1)).
Figure 12. Spectra of the Id and Iq currents under voltage and mass unbalances condition
4.3 Diagnosis procedure flowchart
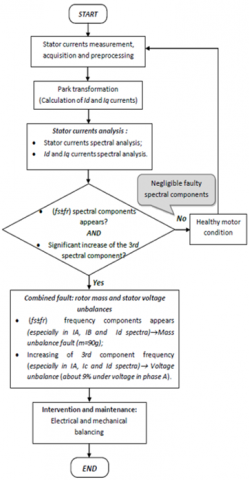
Figure 13 presents the flowchart of the employed diagnosis procedure. This diagram provides a summary of the different steps followed to diagnose these combined defects, and the points noted when the recommended diagnosis techniques were being carried out.
Figure 13. Flow chart of the used diagnosis procedure
Researches that deal with combined faults of electrical and mechanical natures in asynchronous motors are relatively limited. For that, the study provided in this paper based on experimental results, has treated voltage with mass unbalances that affected a three phase induction motor simultaneously. To analyze the machine’s state under these abnormal and aggressive conditions, the spectral analysis of the stator currents, followed by the spectral analysis of the park components (Id and Iq) are applied. Based on the obtained results, we can conclude that our research work has been satisfactory and successful, we can also infer the following benefits: The analysis of the results shows that these faults can be recognized at the same time by observing their frequency signatures in the low frequency domain of the spectra. Furthermore, by comparing the three phase spectra in the faulty state, it was possible to identify the affected phase which caused the voltage imbalance. Finally, the frequency signatures of the defects have been better shown in the Id component spectrum than in the Iq component spectrum, as the Id component spectrum includes all the information of the three phase currents. Therefore, we can conclude that the proposed diagnosis methods in cases of similar defects can be implemented easily and successfully in practice.
Because it is so easy to use and gives much information about the state of health of the motors or systems, current analysis is the finest diagnostic approach in practice. As evidence of this, the method accurately detected two defects at the same time.
The main limitation of the experimental result is the approach necessitating more powerful acquisition hardware, such as the dSPACE card, to respond rapidly to new learning and validation rounds. This, in turn, will allow the data cycles to be shortened as much as feasible for more accuracy.
Also, experimenting while the machine is under load may make defects more apparent.
As perspectives, and in order to improve the obtained results, we can reinforce this work by employing an advanced signal processing methods and intelligent diagnosis techniques, both of which have the potential to yield more accurate and significant outcomes.
[1] Gangsar, P., Tiwari, R. (2020). Signal based condition monitoring techniques for fault detection and diagnosis of induction motors: A state-of-the-art review. Mechanical Systems and Signal Processing, 144. https://doi.org/10.1016/j.ymssp.2020.106908
[2] Gundewar, S.K., Kane, P.V. (2021). Condition monitoring and fault diagnosis of induction motor. Journal of Vibration Engineering & Technologies, 9: 643-674. https://doi.org/10.1007/s42417-020-00253-y
[3] Salah, M., Bacha, K., Chaari, A. (2013). Comparative investigation of diagnosis media for induction machine mechanical unbalance fault. ISA Transactions, 52: 888-899. http://dx.doi.org/10.1016/j.isatra.2013.07.011
[4] Belkacemi, B., Saad, S., Ghemari, Z., Zaamouche, F. Khazzane, A. (2020). Detection of induction motor improper bearing lubrication by discrete wavelet transforms (DWT) decomposition. Instrumentation Mesure méTrologie, 19(5): 347-354. https://doi.org/10.18280/i2m.190504
[5] Rahman, Md. M., Nasir Uddin, M. (2017). Online unbalanced rotor fault detection of an IM drive based on both time and frequency domain analyses. IEEE Transactions on Industry Applications, 53(4): 4087-4096. http://dx.doi.org/10.1109/TIA.2017.2691736
[6] Carbajal-Hernández, J.J., Sánchez-Fernández, L.P., Hernández-Bautista, I., Medel-Juárez, J.D.J., Sánchez-Pérez L.A. (2016). Classification of unbalance and misalignment in induction motors using orbital analysis and associative memories. Neurocomputing, 175: 838-850. http://dx.doi.org/10.1016/j.neucom.2015.06.094
[7] Bouras, A., Bouras, S., Kerfali, S. (2018). Prediction of the mass unbalance of a variable speed induction motor by stator current multiple approaches. Turkish Journal of Electrical Engineering & Computer Sciences, TÜBiTAK, 26: 1056-1068. http://dx.doi.org/10.3906/elk-1702-58
[8] Lahouasnia, N., Rachedi, M.F., Drici, D., Saad, S. (2020). Load unbalance detection improvement in three-phase induction machine based on current space vector analysis. Journal of Electrical Engineering & Technology, 15(3): 1205-1216. https://doi.org/10.1007/s42835-020-00403-y
[9] Kerfali, S., Bouras, S., Bouras, A. (2015). Experimental investigation on different faults diagnosis by combining two stator current approaches. Technics Technologies Education Management, 10(3): 313-318.
[10] Benamira, N., Rachedi, M.F., Bouraiou, A. (2013). The investigation of induction motors under abnormal condition. The Online Journal of Science and Technology (TOJSAT), 3(4): 150-158.
[11] Benamira, N. (2017). Contribution au diagnostic de la machine asynchrone triphasée en présence de défaut. Ph.D. thesis. Department of electromechanical engineering, Badji Mokhtar–Annaba university, Annaba, Algeria.
[12] Singh, S.B., Singh, A.K., Thakur, P. (2014). Accurate performance assessment of IM with approximate current unbalance factor for NEMA definition. In 2014 16th International Conference on Harmonics and Quality of Power (ICHQP), pp. 674-678. http://dx.doi.org/10.1109/ICHQP.2014.6842805
[13] Dekhandji, F.Z., Refoufi, L., Bentarzi, H. (2017). Quantitative assessment of three phase supply voltage unbalance effects on induction motors. International Journal of System Assurance Engineering and Management, 8(Suppl.1): S393-S406. http://dx.doi.org/10.1007/s13198-015-0401-3
[14] Gonzalez-Cordoba, J.L., Osornio-Rios, R.A., Granados-Lieberman, D., Romero-Troncoso, R.D.J., Valtierra-Rodriguez, M. (2018). Thermal-impact-based protection of induction motors under voltage unbalance conditions. IEEE Transactions on Energy Conversion, 33(4): 1748-1756.
[15] Hussain, M., Rizwan Ahmed, R., Hussain Kalwar, I., Memon, T.D. (2020). Multiple faults detection and identification of three phase induction motor using advanced signal processing techniques. 3C Tecnología. Glosas de innovación aplicadas a la pyme, Special Issue: 93-117. http://dx.doi.org/10.17993/3ctecno.2020.specialissue6.93-117
[16] Hosseini, E., Mirzaei, A. (2020). An improved method for diagnosis of induction motor load mechanical unbalance fault using current signal analysis. Russian Electrical Engineering, 91(3): 217-224. http://dx.doi.org/10.3103/S1068371220030086
[17] Roczek, K., Rogala, T. (2019). Induction motor diagnosis with use of electric parameters. Diagnostyka, 20(4): 65-74. http://dx.doi.org/10.29354/diag/113000
[18] Irfan, M., Saad, N., Ibrahim, R., Asirvadam, V.S., Alwadie, A. (2019). Analysis of distributed faults in inner and outer race of bearing via Park vector analysis method. Neural Computing and Applications, 31: 683-691. http://dx.doi.org/10.1007/s00521-017-3038-0
[19] Parra, A.P., Enciso, M.C.A., Ochoa, J.O., Peñaranda, J.A.P. (2013). Stator fault diagnosis on squirrel cage induction motors by ESA and EPVA. In 2013 Workshop on Power Electronics and Power Quality Applications (PEPQA), pp. 1-6. http://dx.doi.org/10.1109/PEPQA.2013.6614937
[20] Granjon, P., Vieira, M., Sieg-Zieba, S. (2009). Surveillance du désalignement d’un moteur asynchrone par analyse du vecteur d’espace courant. Workshop du GIS “Surveillance, Sureté, Sécurité des Grands Systèmes”, Nancy, France.
[21] Bouras, A., Bennedjai, S., Bouras, S. (2020). Experimental detection of defects in variable speed fan bearing using stator current monitoring. SN Applied Sciences, 2(5): 1-8. http://dx.doi.org/10.1007/s42452-020-2687-2
[22] Messaoudi, M., Sbita, L. (2010). Multiple faults diagnosis in induction motor using the MCSA method. International Journal of Signal and Image Processing, 1(3).
[23] Ghanbari, S., Sheikhzadeh-Baboli, P. (2013). Three-Phase Induction Motoras Torque Under Voltage Unbalance. Global Journals of Research in Engineering, 13(F9): 29-33.
[24] Cherif, H., Benakcha, A., Khechekhouche, A., Menacer, A., Chehaidia, S.E., Panchal, H. (2020). Experimental diagnosis of inter-turns stator fault and unbalanced voltage supply in induction motor using MCSA and DWER. Periodicals of Engineering and Natural Sciences, 8(3): 1202-1216. http://dx.doi.org/10.21533/pen.v8i3.1058
[25] Chauhan, S., Singh, S.B. (2019). Effects of voltage unbalance and harmonics on 3-Phase induction motor during the condition of undervoltage and overvoltage. 6th International Conference on Signal Processing and Integrated Networks (SPIN), Noida, India, pp. 1141-1146. http://dx.doi.org/10.1109/SPIN.2019.8711753
[26] Crghavani, H., Peyravi, M. (2017). Unbalanced current based tarrif. 24th International conference on electricity distribution, Glasgow.
[27] Kini, P.G., Bansal, R.C., Aithal, R.S. (2006). Impact of voltage unbalance on the performance of three-phase induction motor. The South Pacific Journal of Natural and Applied Sciences, 24(1): 45-50. http://dx.doi.org/10.1071/SP06007
[28] Morsi, W.G., El-Hawaryb, M.E. (2011). On the application of wavelet transform for symmetrical components computations in the presence of stationary and non-stationary power quality disturbances. Electric Power Systems Research, 81(7): 1373-1380. https://doi.org/10.1016/j.epsr.2011.02.003
[29] Cruz, S.M., Cardoso, A.M. (2001). Stator winding fault diagnosis in three-phase synchronous and asynchronous motors, by the extended Park's vector approach. IEEE Transactions on Industry Applications, 37(5): 1227-1233. https://doi.org/10.1109/28.952496
[30] https://voltage-disturbance.com/power engineering/sequence-components/, accessed on September 20, 2022.