Durairaj Kandepan* | Dhilip Kumar Venkatesan
© 2022 IIETA. This article is published by IIETA and is licensed under the CC BY 4.0 license (http://creativecommons.org/licenses/by/4.0/).
OPEN ACCESS
Monitoring the health of humans in everyday life is quite challenging. Smart wearables have been increasingly important in recent technologies for monitoring and indicating our current health status, which is utilised to appropriately diagnose our health. Monitoring animals' health raises several concerns. We must wait for veterinary specialists to assess and diagnose whether the animals are suffering only in known regions. The result is delayed treatment and degradation of animal health. Therefore, primary health diagnosis is needed. However, mounting equipment was required to identify these features. This research leads to the recognition of the behaviour of animals through this technique, which facilitates the assessment of the health of animals. The use of Wireless Sensor Networks (WSN) and IoT features an Animals Smart Healthcare Monitoring (ASHM) system for this research to track animal behavior with high precision using sensors and to detect animals' health with great precision. We proposed designing a system that would track the movement and health of an animal. This can be achieved by developing a system with animal smart health monitoring system. The sensor can be mounted on the animal body to get the desired physiological parameters like temperature, heart rate, respiratory rate, ECG, and Blood pressure. This health surveillance system method has reduced the mean latency by 75% and provides results with an output accuracy of 98%.
IoT, ASHM, WSNs, machine learning, health monitoring, behavioural analysis, wild animal monitoring
In the 1990s, telemetry methods rely upon this Global Positioning System (GPS) have all been developed to continue providing comprehensive information to studies conducted to handle environmental issues and evaluate policies [1]. Furthermore, the GPS has experienced numerous improvements in terms of volume and achievement and a significant reduction in costs. Detectors and webcams were installed in strategic locations, like the freshwater resources and food areas. The type of analysis is determined by taking into account the behaviour of animals, which would be collected through the different sensors. The proposed method may determine the habitat in which an animal lives IoT- Based smart sensor data. Environmental consciousness & general concern for animals have grown steadily since the 1980s, and this trend has persisted into the twenty-first century.
Department of forestry in India currently handling more projects related to animal health care using IoT and species care such as Near Real Time Monitoring of Active Fires Using MODIS Based Web Fire Mappers, Monitoring of Forest Cover in Selected Protected Areal, Status of Forest Cover in Tiger Reserves etc. Researchers should plan and pick a suitable framework to solve specific biological concerns, given the range of configuration & functionalities available in modern GPS devices [2]. The impacts of human activities such as hunting of wild creatures and tree trimming, which also pose a major risk to animals, have made wildlife safety a priority in recent years. Wildlife safety & preservation are difficult to achieve, particularly in natural reserves, risky areas, or hotspots close to inhabited areas. With the expanding human species and the hunt for new environments, and the excessive use of natural assets, forests & animal degradation is occurring all over the community. This method aids in the diversion of wildlife entering the countryside. The designed system is an integrated operating system that has been collecting scientific data for more than 6 years. Conventional observation techniques or other similar technologies, such as global position monitoring, are unable to track the performance of these wild creatures at a far better resolution than just this technology. We've been hearing about the importation of plants like sandals, Sagwan, as well for a long time. Those plants are extremely expensive and hard to find [3]. Preventative methods must be devised to prevent future traffic to save the world's rainforests.
Animals, as a whole, are unable to express any health problems to humans. As a result, this study developed a design of such a wireless sensor for wildlife using Healthcare Monitoring Systems (HMS) that can be placed on animals and send alert messages about their health problems to the forest official's space and veterinarian physicians working in the forest for the further analysis or treatment. Temperatures, smoke control detector, pulse rate, respiration, heart rate, and ECG component are among the sensory physical devices included in the proposed WSN are indeed an excellent choice for providing efficient and cost-effective services for a wide range of application fields, including monitoring systems, agricultural production, environmental control, military activities, and multi-functional WSNs gateways installed in some kind of a decentralized geographic region for tracking a particular instance. has a substantial impact on a wide range of monitoring areas. To connect with other networking sensors, the wireless device runs on rechargeable batteries [4]. The focus of this research is to track and monitor animals’ function and health. There are numerous aspects to this study. For example, the study will focus on an animal within the wild, and the detectors & webcams would be placed throughout the surroundings rather than within individual animals.
A WSN is made up of multiple sensors that can sense, compute, and communicate wirelessly. Our lives are dependent on the proper functioning of human health, which is the most crucial aspect of human bodies. If indeed the system isn't performing properly, it can impair one's conduct and ability to operate. There seem to be numerous reasons for poor fitness. Sickness, stiffness, oestrus, mammary, ovary tumors, displacement antrum, ketosis, prolonged placental, heifers’ diarrhea, heifer sickness, and other Animal diseases are mentioned. The animal body sensors give data like heart rate, respiratory, and pulse rate to WSN-based Animal Monitoring Systems, whereas the surrounding detector transmits information including water pollution concentration, dirt infections degree, the dusty amount within the atmosphere, and humidity information. All of this sensory data should be generated regularly and be of a manageable quantity [5]. The Wearable sensing Animal Healthcare Monitoring system is installed on the user's Emulator device or pc that is linked to that same web. The proposed system relies on WSNs and is a realistic, limited, and environmentally friendly Animal Care Management (ACM) System. ACM is used to manage the animal's wellness in these applications. Using several devices, AHM will read the physical readings of the animal's body. With the use of detector measurements computations, ACM can immediately conclude whether Animal health is good or bad obtained from the sensors data. This aids in the improvement of wild animal welfare and the resolution of challenges relating to animal disease detection. SHMs would be used to transmit information, with IoT devices as the driving principle of IoT [6]. The most significant parameter would be to examine the creatures on such a regular schedule to see if they are sick or at risk from environmental disasters such as floods or wildfires. As a result, this model will be easy to utilize for animal tracking evaluations.
Animals seem to be the most long-lived terrestrial creatures on the planet. Asian animals, African animals (Savannah animals), and African forest animals are indeed the 3 categories of animals found worldwide [7]. Asian animals, like dolphins and chimpanzees, have the highest intellect levels. It identifies themselves, much as humans do. Animals have a far longer gestation period than other living animals, at around 22 months. Animals consume food for approximately 16 hours each day, of which only 40% is digested and the remaining 60% is excreted with the feces. As a result, these dungs help to expand the forests. Animals are now on the verge of extinction, even though we all understand. In today's society, it's critical to safeguard this species' health to ensure forest wealth and success for future generations. Animals generate a strong body temperature, according to scientists. Animals constantly fan their ears and disperse mud on their bodies to maintain their body heat. Animals were shown to have poor vision, making it more difficult for them to perceive vast distances. As a result defend them by employing noise and group force, though both are characteristic animal behaviors.
The IoT is critical in today's digital environment and it is a technology that links multiple physical gadgets. The phrase IoT was coined by Kevin Ashton just before a lecture to Procter &Gamble in 1999 with the goal of drawing managers' awareness to a reality of social media and the internet remained completely reliant upon humans' different datasets [8]. Even though he had little influence over how others will use the phrase, the notion would be that individuals possess restricted attention and time, and makes them unsuitable for data gathering; therefore, possessing machines competent of independent information gathering would enable everyone to record & measure things. The second biggest motivation for using IoT to handle animal issues would have been to track the animal's behavior. The majority of them have been worried about animal care, such as the one that measured dog stages to see whether the animal needed to become more energetic, another one that monitored the number of times, duration, and period expended by cats within litter box to alert about their owners to every irregularity, and yet another that has used cameras to track animal activity after already being fed a nutritional supplement intake and published the performance to those from a regular diet [9].
The phrase of IoT, on the other hand, is still in its infancy. It is scattered and it has not been sufficiently formed [10]. To fully achieve the IoT, all devices can communicate to one another, independent of who developed the device or who has commercial links with whom. The phrase IOT has become quite popular in recent years. It isn't a secondary network; instead, this is a network of interconnected gadgets that are being used every week to search Google, post photos, and socialize with people [11]. It's a collection of items connected to the Internet, each with its Internet address and the ability to communicate with one another to automated simple operations. IoT, on the other hand, is still in its development. It is scattered but hasn't been sufficiently formed. To fully achieve the Internet of Things, all devices will be able to communicate to one another, independent of who developed the products or who has commercial links with whom [12, 13].
The construction of an ASHM system with Animal Health Monitoring requires the formulation of a solution for managing characteristics such as temperature, digestion, pulse rate, and moisture. The devices that can be utilized to monitor animal health characteristics are discussed in detail in this research study. The scope requires looking into the possibility of using a sensor network built on extremely wide frequency range radiation for animal health monitoring.
The remaining session in this paper as follows: in section 2, the survey on animal health monitoring and issues present in the existing system are explained. In section 3, describes about the IoT sensors used in the proposed system and section 4 describes about the results and discussions based on performance measures. Finally, section 5 concludes it.
Table 1. Comparison of existing work features, techniques and limitations
|
S. No |
References |
System |
Methodology used |
H/w and S/w used |
Observed characteristics |
Outcomes |
Limitations |
|
1 |
[3] |
ML based Computational Analysis Method for prediction of Lamp in cattle |
ML algorithms (RF, SVM, ANN) in Model 1 and 2 |
Not Applicable |
(Walking steps per day, Eating, Sleeping) |
Model 2 with RFaccurately identifies the lamp in the cattle or not |
4 features used in Jameness detection model |
|
2 |
[5] |
Domestic animal Health Monitoring System using IoT |
3 levels of architecture used |
Sensors, devices: Wi-Fi access points, routers and hub |
Rumination feeding, heat, physiological behaviours |
Monitor and detects the health problems of domestic animals |
N/A |
|
3 |
[9] |
Calculate the temperature and Humidity index |
Calculate the temperature and Humidity Index automatically |
Not Applicable |
Humidity, Temperature |
Accurately predict and rank the humidity and temperature |
Sunlight received by the animal and climate |
|
4 |
[11] |
e-monitoring system for measuring the Ruminants of temperature and Heart Rate |
Designed equipment tested and controlled and compute the statistical analysis of the equipment |
Radio frequency receiver, sensors and Xbee Series 2 fixed base unit |
Temperature and Heart rate |
e-monitoring device, Comparison results of temperature and heart rate with existing system |
Low energy autonomy |
|
5 |
[4] |
Health monitoring and detection of castle using Arduino device |
Sensors, Arduino device to take and process real time data, Graphical representation and analysis |
Arduino device and sensors Xbee Series 2 |
Rumination, Humidity, pulse and temperature |
Detect the accuracy of health disease of animals in castle |
Due to the simple system the accuracy is not reached up to the level |
|
6 |
[8] |
Health monitoring and detection of castle using Arduino device |
Arduino UNO is used to read the data and GSM is to monitor the website |
Sensors, GSM/Wi-Fi, Arduino device |
Humidity, Heart beat and temperature |
Tracking of animals using parameters from the desired range |
Not Applicable |
|
7 |
[12] |
Recording behavior of indoor-housed farm animals automatically using machine 3vision technology |
Image based analysis of animals focused on detecting behavioral changes & their characterization |
Sensors, RFID detectors, digital cameras (2 Dimensional), depth cameras (3 Dimensional) |
Activity level, area occupancy, aggression, temperature, resource use, posture, rate of production |
Location and tracking data used to detect health problems |
Lack of link between different studies. Mostly repetitive or completely different work |
|
8 |
[7] |
ML based method for Monitoring the behaviour of Dairy Calf |
Predict the background and movement of animals |
2 Dimensional cameras |
Movement, sleeping, running, drinking, feeding remaining stationary |
Evaluation tool gave these accuracies. Rest area (95%). leaving (94%), turning (98%). drinking (82%), feeding (80%), stationary (98%) |
Large dataset required to build and train the model. Some behaviors are predicted with less accuracy |
Temperature, humidity, height, wind, light, camera, and other monitoring devices have indeed been employed to observe the habitat environment. Cellular & capillaries communications elements are utilized in this experiment. For long-distance connectivity, Global Systems for Mobile Communication (GSM), Third Generation (3G), and Long Term Evolution (LTE) were utilized [14, 15]. Sensors were put up inside the observing region and communicated via sensing devices in habitats environmental monitoring. The information is collected by the detectors, and a notification is transmitted to the appropriate authority. The study explains how to follow animals and deliver a warning message if they violate a boundary line. This WSN was employed as an artificial wall to enclose animal paths or settlements to conduct this research. Because the virtual border is positioned outside the settlement and employs the height & width of an animal for detection criteria, this can be employed as just an early warning system.
The network remotely connects with the village's ground station, and this can notify a designated individual via the mobile phone network. The sensors network includes just a virtual perimeter around a community. Infrared (IR) & passive infrared (PIR) detectors were used to construct this boundary [16]. To distinguish & identify the animals from the rest of the animals, the system characteristics and other characteristics of animals are taken into account. An RF module-based artificial fence system is described in this study. If the animal attempt to cross the transmitter's area, the reception will sound an alarm and send a message on the LCD. Whenever cattle approach the artificial barrier, a WSNs system with microcomputers, radios, and detectors works as a transmitter & emits sounds [17]. Animals are terrified of the sound that is made when they breach the barrier, so they make sure to stay inside. When the animals cross the boundary, the forestry officials receive an alarm notification.
The article discusses an IoT-based animal infiltration. A camera is used to image the wildlife. Sound is utilized to calculate the distance of a wild animal using a sensor module. The ultrasonic emit high-frequency sound pulses, which are then recorded by the time required is for actual sounds echoes to return. When an animal is spotted, the ultrasonic sensor transmits messages and the taken image to the IoT platform, and a warning and alerts are sent to the user at the same time. Once the animal is recognized by the ultrasonic sensor, the alarm will be activated. The DHT 11 sensor is used to monitor humidity [18, 19]. The DHT 11 sensor monitors the forest's temperature and humidity 24 hours a day, 7 days a week, and the values are saved in Ubidots. If some variations in moisture or temperature are noticed, the user receives an instant notification [20]. The comparative analysis of the existing work based on techniques, hardware utilize, and limitations shown in Table 1.
The research proposed a WSNs network-based animal surveillance system for identifying forest fires. Some sensors detect changes in the environment regularly and send them to the monitoring station over a wireless connection. These measures are put together to see if there is any sign of a forest. The development of a wireless distributed network for object detection and tracking is described. This system is designed to keep a constant eye on the animals. A detector, an infrared sensor, or a Radar-based detector are utilized in wildlife monitoring devices. An Intrusion detection system is being used to identify animals across great distances in addition to monitoring animals.
This system is designed to monitor the health issues of animals by using sensors and cameras. The data collected from the sensor and the thermal images which are captured by the cameras are stored and processed via the WSNs with Think speak cloud server. These data are further analyzed and classified the data with a Naïve Bayes classifier and predict the illness of the animal and messages are transmitted via mobile application or web application to the forest officer and the doctor. Figure 1 shows the overall architecture of the proposed system.
Each WSNs gadget in the proposed design is powered by batteries. It may be essential to replace the batteries at periodic intervals based on the usage of the wirelessly sensing device. Transmission of data consumes a lot of battery capacity. A single channel is commonly used in the arrangement to transmit data across network elements. As a result, among some of the sensors, it is necessary to build an effective transmission technique & network architecture. Wireless sensor Veterinary Health Management using NodeMCUs is the proposed technology. The node Micro Controller is suitable for Animal Care Management since it is open-source, participatory, customizable, limited, easy, intelligent, and WI-FI capable.
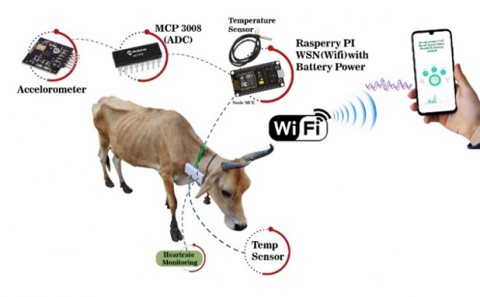
Figure 1. Animal smart health monitoring system
5.1 Wildlife tracking and health monitoring
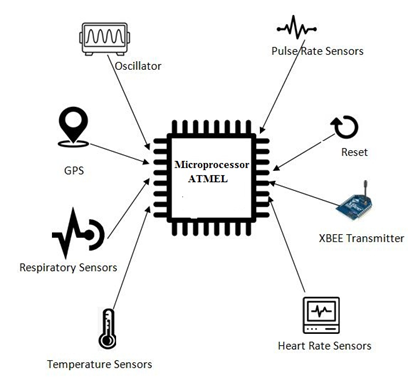
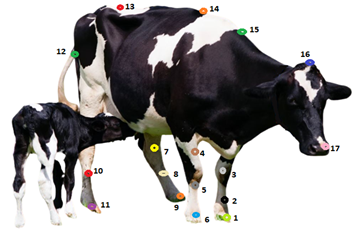
The framework is designed and it is also useful for all wildlife rescuers and physicians who really can keep a careful eye on animal diseases. In the scenario of a wildlife savior, people could even hunt for abandoned wild creatures. Pulse rate detector, temperature, heart rate detector, and respiration detector are the four crucial devices shown in Figure 2. Throughout the event that an animal goes missing or gets lost, a GPS is used to trace its movements. ZigBee will be the wireless network adopted. ZigBee has a relatively low power bandwidth of 10- two kilometers and can support up to 62000 devices over a 50 m range. Figure 3 shows how the ZigBee transmitter and receiver get information mostly from the program's integrated microprocessor and transfer this to a Computer via the UART protocol. It's possible that the information is unprocessed & requires to be edited. But, in the next stage, a software application to analyze the information will be constructed. Figure 3 shows how the device raw data would be sent to a webpage to be analyzed. All five values will be included in the webpage and a study of them. After the evaluation is complete, we can see if there is a hazard to animal welfare based on a bunch of criteria (a pet's temp should be between 37.5 and 39.98 degrees). An abrupt rise in temperature after minutes of observation, for instance, could indicate that an animal is experiencing a cold. Medications can also be recommended. A professional doctor may well be notified if a severe situation exists. The system would've been accessible on every gadget utilizing IoT could improve and align it along with recent trends. IoT will connect gadgets and allow customers & landlords to monitor their animals and wildlife from everywhere. The information would've been saved in the cloud because the received data from a gadget was live and uninterrupted.
For all three sensors stated, the proposed animal health observation & monitoring system was tested in real-time. The data from the sensors were transmitted over GPRS and stored in the Cloud servers. And it's displayed on the LCD. As a result, it’s been established that the incorporation of GPS with the sensor in the very same microcontroller was feasible or whether the information obtained is precise and free of disturbance. The GPS, on the other hand, only functions while the model is moving. Furthermore, earlier models were unable to reach the accuracy and precision that this model does. Advantages: 1. Improved technology enables long-range monitoring. 2. Real information 3. Increased environmental information collecting. 4. Improved knowledge of wildlife populations and range 5. Survivability data collecting. Drawbacks: 1. Advanced tech costs a lot of money. 2. Program research is necessary to use the information recorded. 3. Researchers must be trained to use technologies. 4. Technique must be matched to animals and habitats (one size does not fit all) 5. Inadequate data-sharing procedures.
Figure 2. Sensor-based transmitter for animal monitoring
Figure 3. Zigbee monitoring unit
The method is essentially constituted of Renesas microprocessor, Gsm, Gps receiver, Various sensors, Smoke detector, Transistor, Accelerometer, and cloud-based databases in this proposed project. A smoky sensor can detect a wildfire. To prevent destruction, a PIR sensor is utilized. The existence of humans near wildlife limits or prohibited zones is detected using a PIR sensor. When a heat transmitter device is placed around an animal’s region, it assists the animal remains in a specific confined area; however, if the animals leave the restricted area, the animals suffer from physical discomfort caused by the gadget. Animal's whereabouts are tracked via GPS.
5.2 IoT-based animal behaviour detection devices
Here, this system provides a brand-new program that consists of a framework enabling animal care tracking to achieve intelligent Animal Care Management and fill in the gaps among breeders and specialists by presenting animal disease remedies using the following sensor and cameras.
5.2.1 IoT Sensor system
5.2.2 Animal behaviour monitoring
Webcam trapping's difficulties Animal type identification in webcam photos can be viewed as an object classification challenge. In this situation, an animal appears visible there in the image and should be identified and categorized that is (refer to Figure 4(a)). Images that encompass and cover the full animal body (such as Figure 4(a)) are a rare and perfect situation. External factors, wildlife behavior patterns problems, and technology restrictions are indeed the 3 primary groupings of difficulties within camera trap architecture. The sharpness of an image taken is affected by the context, which is referred to as external conditions. Because the cam trap is placed in the field and left somewhere for longer timeframes, many items can obstruct animals, as shown in Figure 4(b). Because the surroundings don’t remain constant (for example, vegetation expand and trees fall), interference can happen at any point. Although the light levels most of the day and night-time vary, the changeover with them can be problematic (see Figure 4(c)). The underexposed portions in Figure 4(d) are created by the incoming sunlight. Rainfall and drips upon that lens are examples of cases that have a direct effect on hardware technology. The lens is usually pointed toward the naturalistic passage or a location where the animals are expected to pass through in a camera capturing structure.
Animals, on the other hand, rarely act inconsistent ways. This increases the difficulty of recognizing difficulties by requiring all animals there in the image to be located. All of the aforementioned scenarios could occur independently or simultaneously in any combination. Cameras capture technology is made up of high-resistance and low-power devices. There seem to be a variety of commonly produced versions with various parameter combinations. Once deciding on a camera, the pixel density, trigger detector, images per second, and night artificial light (infra-red or flicker) are all important considerations. Blurriness photos and underexposed animals’ images, as Figure 4(e) and Figure 4(f) indicate, depend on the main camera and set the parameters (period among images and flashing intensity for reference).
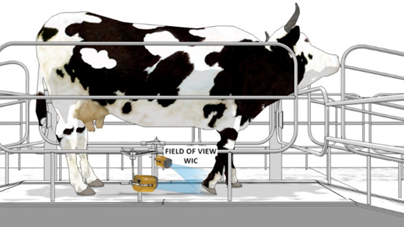
Temperature & heart rates were recorded via detachable collar gadgets using Sensor camera technology. A camera mobile agent placed mostly on animals during observation and a fixed core department make up the measurement testing device. As indicated in Figure 4, a fixed-base unit sensor measures the temperature difference, whereas a mobile-based device measures the animal's temp and heartbeat. The Zigbee wireless system controls the wireless broadband exchange in between two main components. Some of the functions of the mobile unit bases, including data acquisition, processing, and transportation, are managed by the microprocessor. The permanent unit communicates with the databases, and the HyperTerminal program is used to visualize and analyze information in real-time. The results from the testing equipment Smart Electrocardiogram (SE) mobile electrocardiograph type SE1 were comparable to the readings from the control ECG technology have been no substantial differences between both the data processing equipment depending on the outcomes of the pulse rate readings. An infrared (IR) camera & thermometer were utilized as control systems for surface temperatures. The air temperature acquired from test equipment is slightly greater than that of the testing values, as can be seen. The major sources of disturbance were contacting sensors and weather conditions.
Figure 4. Various animal behaviour: (a) Ideal image; (b) Occlusion; (c) Bad illumination; (d) Overexposed area; (e) overexposed animal; (f) Animal away from the camera
The IR camera's images emphasize the heat temperature zones about an animal's body as shown in Figure 5(a). The basis of thermal energy is that it works on the same premise as black body radiation. Because animals were dark objects, thermal images provide information about their body temp, which may be contrasted to sensor information for a more systematic evaluation. Temperature Humidity Index (THI) Temperature and pressure data can provide a lot of information about animal care and how to anticipate it. The DHT-11 sensor, which is attached to the animals’ shoulder with a belt, measures the temperature and relative humidity.
THI = db - [0.55 - (0.55xHR/100)] x (Bt-58) (1)
db is the bulb's temp in degrees Fahrenheit. The humidity (HR) is expressed as a percentage. Also, there are color scheme graphs that can be used to evaluate the intensity of the diseases.
5.3 Use of machine learning to detect lameness in an animal
Depending on the outcomes, the calculation best matches the conditions and expectations for detecting the Lame Potential (LP) in animals. The count of footsteps, walking distance per day (m), sleeping each day (min), and eating each day are all listed throughout this computation (min). The training dataset has six instances both for favorable and unfavorable instances, while the testing set contains two situations in each. Simple visualizations produced satisfactory results because it was discovered that animals traveled an average of about 3500cross - a reference to sick animals which walked on a mean of about 3,000 m. Healthy animals spend less than 700 minutes per day sleeping, but ill animals spend more than 780 minutes per day lying. The ill animal's daily eating hours vary from 140 to 180, whereas the normal animal's range from 200 to 300.
(a)
(b)
(c)
Figure 5. Sensors to monitor the cows: (a) Side view hoof in the cattle; (b) Straight view hoof in the cattle; (c) Sensors in identifying the cow movement (cow hoof)
This conversion limit for the probability to select an appropriate identity is 0.5. A positive screening instance is one with a likelihood score greater than 0.5. The confusion matrix, that yielded exact outcomes, was evaluated for some more investigation. In the selectivity versus sensitivities graph, the area under the roc curve is 1. There have been no False Positive (FP) or False Negative (FN) occurrences, in other terms. As a result, when compared towards the LP computational model, all efficient Machine learning algorithms fully identify among positively and negatively sick data.
The Naive Bayes classifier is quick and progressive, could handle discrete or continuous variables, and therefore can justify its conclusions as that of the total of information improvements. Its naivety, on the other hand, could lead to poor performance in detecting the thermal images with significant attribute relationships. According to the paper, the Naïve Bayes classifier's process is utilized sequentially, allowing it to handle non-linear issues while keeping all of the benefits of the Naive Bayesian classifier. The benefits of consecutive studying are confirmed by comparisons of performance across domains, implying that it might be applied to many other learning techniques. Eq. (2) is used to compute the conditional probability of classifying the thermal images.
Q(I|F) =Q(F|I)*Q(I) / Q(F) (2)
Q(I) seems to be the likelihood that hypothesis I is correct. The likelihood function is indeed the term for this. Q(F) is the evidence's possibility (regardless of the hypothesis). Q(F|I) denotes the likelihood of the findings if the premise is true. Q(I|F) denotes the likelihood of the assumption given the facts.
5.4 Animal emotion
Humans are using a percentage of animals' natural environments and source of food for agriculture reasons even as the population expands. As a result, animal populations are rapidly dwindling. Because of the lack of habitats, most of such animal population is forced to seek foods in human habitation. This leads to clashes with people, which lead to huge agriculture destruction and terrible loss including both people & animal life. This suggests that current natural reserves and sanctuaries are incapable of ensuring the long-term survival of such creatures. In this perspective, information obtained by the Animals Protection Department of Animal Conservation (DAC) shows that somewhere between 1992 and 2010, killed 2814 animals and murdered 1038 humans, destroying 3103 residences in India. Furthermore, since 2008, an average of 225 animals have perished each year as a result of the disease. These figures clearly show that long remedies are desperately needed, so the government would take some necessary actions. As a result, villagers who have been attacked by wild animals continue pushing the administration for a reasonable response.
This has a lot of shortcomings, including expensive fence construction costs, a lack of cooperation from individuals who are subjected to animals’ attacks in terms of fencing maintenance, a limited fence lifespan, and periodic investment costs. As a result, an electrified fence is not the best option in this case. Many farms and people employ handmade weaponry including trigger pistol nets and mouth exploders to defend their farms and houses from animals due to its weakness in preventing attacks. The animal suffers fatal injuries and is eventually killed as a result of this. As a result, environmental groups have expressed worry over animal deaths as a result of these unlawful improvised weapons. The research focuses on identifying animal arrivals, while other attempts to forecast animals’ health issues. A geophone is used to identify animals in the very first phase. Following the detection of animals, the system determines whether the animal's wellness is normal or not. Thermal images information has been used in this system to anticipate animals’ health problems. The flow diagram for the proposed system is shown in Figure 6.
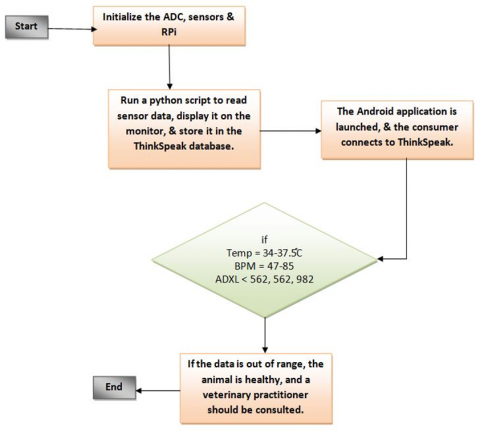
Devices (Digital Temperature, Cardiac Sensor, and Rumination Sensor) tightly integrated with MCP-3008 & Raspberry Pi are being used to monitor the wellness characteristics of the animal. a) Information is communicated via "Thing-Speak" using the RPi's inbuilt Wi-Fi once it has been measured, i.e., usual range/out of normal limit. b) An area is formed for information gathering upon that Thing-Speak Cloud after enrolment. Sensor’s information is moved towards the clouds, where it is graphically displayed. c) A mobile app installed just on later part user accesses connects to the cloud, allows users to access the data about the animal's wellness and very well.
Figure 6. Data flow of IoT based AHMS
With the fast advances in the development of IoT, various ideas about how to integrate automatic non-linear and non-board have surfaced. Turnkey Sensor Board, ROHM kit, and other boards with various sensors fully installed as SMD are the most prevalent types of motherboards. Nevertheless, instead of existing fixed detectors, various devices can be connected to a microcontroller upon the multi-sensor panel, providing the user with more comprehensive management. Main types of data collection methodologies could be used: 1. Base unit for portable devices 2. Unit with a Permanent Base The pulse sensor (SEN-115-74), digital temperature (MLX-906-14), with accelerator (GY521) would be installed mostly on animal's head as a Mobile-Based Component, with the LoRa module (SX-1278) serving as a transmitter gate for information transfer mostly from the mobile unit.
On the permanent base station, DHT-22 sensors would be utilized to measure environmental temperature and relative humidity, and a camera to capture photos (images). The information from the mobile station would be collected by the Permanent Base Unit via LoRa, & then all of the information will indeed be broadcast to the cloud using NodeMCU. There will be two sorts of information recorded: sensor data (numerical) and movies (images). The obtained data would be utilized to study the behavior of the animals, and various machine learning algorithms would be used to learn the large dataset depending upon it. Each one of the information processing approaches presented in related research does have its own set of benefits. They're all tailored to satisfy the requirements of specific mobile users in terms of various user-friendliness factors. The proposed platform is built to save time, reduce manual work, and increase production.
To emphasize the relevance of technologies, the main theme of 'IoT' has now been utilized in the development of the proposed system. i.) A commonly used programming architecture was used to integrate the aforementioned devices and the application servers and for end-user file transfer. The Raspberry Pi device, ADC, and sensors all are linked together using Python code upon this Raspberry Pi. ii.) Thing-Speak Cloud: The Thing-Speak Interface is a "fully accessible software IoT that receives incoming data, timestamp information, and creates that for both people (through visual graphs) and machines.
Proposed Algorithm:
Step 1: Install sensors upon that animal to begin the program.
Step 2: Sensors capture physical parameters from the wildlife, such as temperatures, moisture, weight sensor, and pulse rate.
Step 3: The control microcontroller receives effect& acts as a bridge and middleman in between detectors and the cloud server software.
Step 4: Use a data analysis classifier to identify and analyze the sensor information, including the Naive Bayes technique.
Step 5: In the node MCU, information is analyzed and processed.
Step 6: Save the sensed data, and any relevant serious diseases, inside the cloud server.
Step 7: The nod microcontroller chooses with the support of a cloud database server, and then handles those activities on such a computer or an Android smartphone.
(a)
(b)
(c)
Figure 7. (a) Animal physiological activities; (b) Animal Movement activity’s function; (c) SV transmission and Interconnect time(M) node k and l on contact
It serves as a repository including all records related to animal care, and then it graphically presents the information obtained from the Raspberry pi board. Furthermore, Thing-Speak allows us to build applications based on the data collected by sensing devices. It offers consumers real-time data collection, data analysis, and easy visualizations. Information is kept in streams that provide a set of proposed to a viewer.
The proposed system's goal is to build a simple controlled model based upon Bluetooth meshes that can allow herds movement while outperforming various methods. Whenever a source node S wants to send information to a destination network D, it transfers the information to the nearest node, and the process is performed until the information arrives at D, as seen in Figure 7(b). We consider that networks always interact whenever their sensors bands are into each other's communication range (Figures 7(a) and 7(b)). If somehow the connection is lost a route to D, one or even more vertices will most likely interact with some other node at a later phase owing to natural animal migration.
As a result, data is dispersed all through the networks and it will soon achieve D. In WMS, the algorithm allows node-to-node (n: n) or even many to many (m: m) connectivity. As a result, there have been no topological constraints inside a wild-life observation situation. That can be used on top of every packet data bearer's level, such as Bluetooth Low Energy transmitters. It's doesn't involve complex route-cache administration and seems to be naturally multi-path, contrasting conventional protocols, whereas Algorithm 1 describes the function to transmit the information performed out by another node whenever an operational forward transaction with some other recipient is triggered. Consider the situation when a forwarder unit i is considering replicating information from node o to node l.
Algorithm 1: movement node k, repeat with start node
l event
input: nk: set msg on node k, M,ID(k,n),ok,fq.
Output: Choose to repeat msg to node l,Scost
For oϵokthen // sort receiving node
If fqi>= fqjthen
// Ok based neighbour pruning
Continue
End
Calculate M,Scost(o,k), Scost(o,l) using 3,4
αScost = Rcost (o,k) -Scost(o,l)) then
if (Scost<= 0) then
repeat o to k
end
end
We use a simple store-carry-forward technique that involves the transfer of summary vectors (SV) - a set of data IDs held inside a node's buffers - and delivering probabilities (fq), which is comparable among most selective technologies. Whenever a node that receives an SV from some other unit, it determines which information should be duplicated or not. The algorithm enhances previous opportunist methods by controlling data aggregation decisions on routed characteristics like inter-contact time (M), Iteration (Idk,o), Frequency of Repetitions (fr), and delivering likelihood (fq).
The forwarding decision must be based on the per-link Repetitioncost (Rcost) calculated using Mk&ID(k,n),(Alg. 1). Where Mk, becomes the moment whenever nodes k’s preceding contact at node l comes to an end. The exponentially smoothing estimate of the next inter-contact interval (Mk,l(u)) value of node i would then be revised as Mk,l(u) = M0,k+ (1)Mk,l(u1) at the next connection occurrence with j at time instant (u), in which M0,k seems to be the values at a time frame (u), and 0 <α<1 is the softening component of Mk,l. As a result, a Rcost of storing information m at nodes k.
Rcost(o,k) =Mk,l(u) * [1 + ID(k,n)] (3)
Rcost(o,k) =Mk,l(u) * [2 + ID(k,n)] (4)
To avoid the cost function from approaching 0 at the data provider, the hop-count (Idk,o) is increased by one. When n is duplicated to l, the hop-count of n at k increases by a factor of one. To put it another way, the replication action allows data to spread one hop, increasing the value of its routing cost. Other opportunistic routing techniques agree with this. As a result, Eqns. (3) and (4) are used to derive the replication function at receiver l. If the Scost is 0, the sender node k chooses to duplicate. To put it another way, such repetition will assist the information in moving from a higher to reduced cost functions as given in Eq. (5).
$\delta$Sd = Sd(n, l)−Sd(n, k). (5)
Algorithm 1 initiates replica choice to next hop using the routing information estimation methods in Eq. (5).
Figure 8. Sensor reading on animal
Figure 8 depicts mainly the sensed data from an actual animal, not the complete result. Sensor data would be reported on a daily, monthly, and regular basis. The signals from the detectors are then used to determine if the animal is already in excellent health or not. Eventually, an incident happens on the user's computer, causing the animal's condition to be notified. Mistakes might occur when the Wi-Fi link is broken or when the screen shows incorrect results.
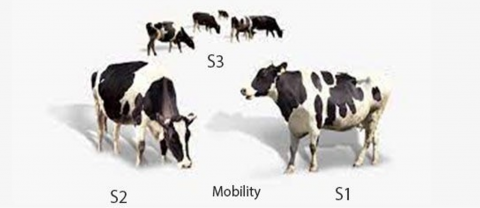
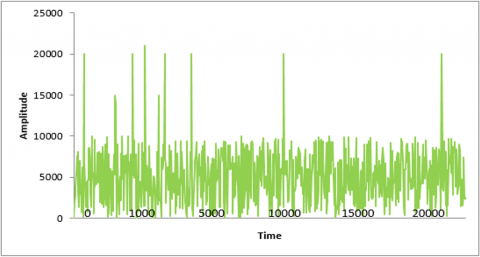
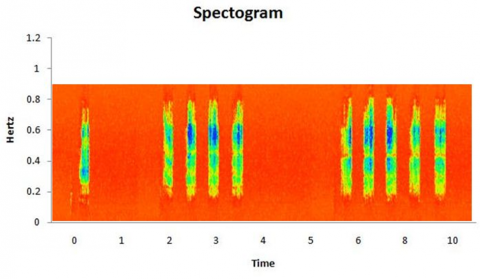
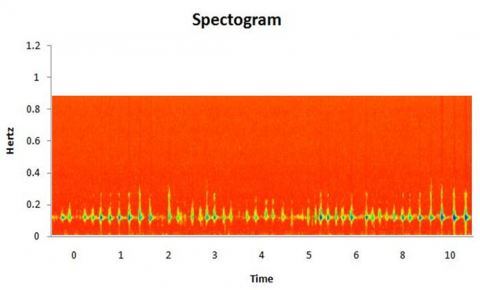
In August 2020, 10 animals were used in controlled testing there at Pinnawala animals’ sanctuary from Sri Lanka. Just on a property, cameras and sensors were installed. The animals’ caregivers also were asked to stand and walk their animals around the sensor while recording the transmitted wave frequencies. During the controlled study, each animal was forced to walk ten times from and to the transmitter. Data containing the GPS information of animals collected each thirty min between 2019 - 2020 was also acquired from such an online library, in addition to real information collected from confined space. It was challenging to obtain GPS data in Sri Lanka due to the present epidemic condition. In Sri Lanka, a study is underway to gather relevant information by attaching GPS transmitters to animals. Once the epidemiological scenario has passed, this information will be obtained or used in the prototype system. The plotted graph of geophone core samples is shown in Figure 9. It shows the waveform files of seismic surveys that were retrieved using microphones sounds. A 10-pulse pattern is shown in the figure. The intensity can be seen on the y-axis, while the series is shown on the x-axis inside the chart ahead. Inside the absence of significant seismic waves, the magnitude values were reduced and presented as lower numbers as much as practicable. This diagram illustrates how well the seismic wave operated over ten seconds while animals walked between three to four meters of a node. The spectral attributes of the waveform files obtained from the neural net were only analyzed by converting them to spectrograms. A frequency spectrum is just a visual representation of a signal's signal strength, or "loudness," across time at various frequencies contained in that information. The vivid yellow lines inside the spectrum analyzer, as seen in Figures 10 and 11, showed those frequencies emitted while the animals were travelling. The sensor's frequency in Hertz (Hz) is just on the 'y' plane, while time is measured in minutes here on the 'x-axis. The strolling animal's legs were more frequent than the racing animal's movements in Figure 11. The yellow stripe marked by "1" in each spectrum has a higher frequency if attentively examined. A sequence with the number "2" has a substantially lower probability than the streak before it.
Figure 9. Geophone sensor seismic information
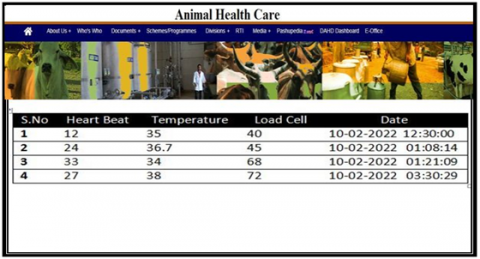
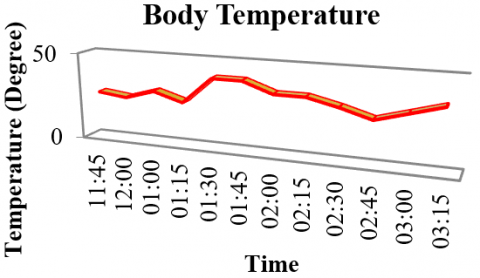
Whenever the program was run just on Raspberry Pi, it provided the observed body temp by degrees Centigrade and Fahrenheit, pulse in BPM, and ruminating on terms of mobility inside the X, Y, and Z axes. Area network based on the IEEE 802.11 specification is used to send the presented data from the console to a Thing-Speak cloud. The information can be accessed from wherever via the online and Mobile apps here on the user's phone. A person may readily determine the overall health of an animal simply by carefully observing the relevant data in the Thing-Speak cloud. The body temperature reading from the sensor is given in Table 2, the readings of the heartbeat sensor are also shown in Table 3 and then the result of rumination is shown in Table 4. The temperature data is transmitted from the raspberry pi to the sensor and thinks to speak cloud for processing is shown in Figure 12.
Figure 10. Spectrograms on Animal walking samples
Figure 11. Spectrograms on animal running samples
Table 2. Animal body temperature output
|
Animal type |
Normal body temperature in Celsius |
Upper limit in Celsius (any higher temperature in fever) |
|
Cattle |
38.7 |
39.7 |
|
Calves |
39.2 |
40.2 |
|
Horses, mules, donkeys |
37.8 |
39.2 |
|
Foal |
38.7 |
39.7 |
|
Sheep |
39.2 |
40.2 |
|
Goats |
39.5 |
40.7 |
|
Pigs |
39.2 |
40.2 |
|
Rabbits |
39.2 |
40.7 |
|
Dogs |
38.7 |
|
|
Birds |
40.6 |
|
Table 3. Console heartbeat of animals
|
Serial No. |
Animals |
Pulse rate/min |
|
1 |
Cattle |
58-90 |
|
2 |
Young calves |
100-120 |
|
3 |
Horse |
30-40 |
|
4 |
Foal up to one year |
70-80 |
|
5 |
Goat |
70-90 |
|
6 |
Sheep |
70-90 |
|
7 |
Dog |
60-90 |
|
8 |
Pig |
90-120 |
|
9 |
Chicken |
190-400 |
|
10 |
Cat |
110-128 |
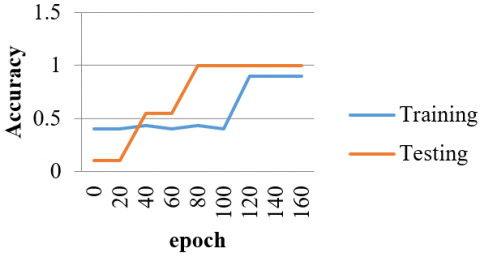
The proposed model's accuracy is depicted in Figure 13. This data comprises 72 instances, four of which have been set aside for validation as new data whereas the remaining 68 samples were utilized to fit the data. These 68 data were divided into two categories: 'run,' which has had 33 observations, and 'walk,' which also had 37 specimens. It shows the number of correct predictions made by this system. Accuracy is measured as (percentage of correct guesses divided by a total number of forecasts). The system had a training accuracy of 99 percent and validation data of 90 percent in this situation.
Figure 12. Temperature data from Raspberry pi sensors and thing speak cloud
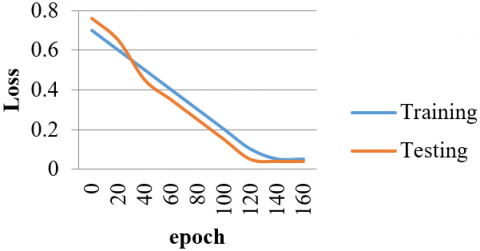
The model's losses are depicted in Figure 14. A loss is a financial consequence for a faulty prediction, i.e., a value that represents how wrong a model's forecast was in a particular case. The loss becomes 0 if the system prediction is accurate; else, the cost is bigger. The training loss was 0.83 percent, while the validation loss was 0.9 percent in this effort. The model's ability to forecast previously unseen information determines the prediction's reliability. As previously stated, there have been four samples of new data. They have been used to forecast accurateness based on real-time data. The testing result showed that the theory was 98 % accurate.
Figure 13. Smart health system performance and accuracy
Figure 14. Smart health system performance and loss
Table 4. Rumination sensor data output
|
Variable |
Measuring technique |
n |
Mean |
Standard deviation |
Minimum |
Maximum |
|
Number of rumination stage
Duration of ruminating stage (min)
Ruminating total time (min) |
D P D P D P |
10 10 10 10 10 10 |
13.5 13.5 30.5 30.4 390.1 389.2 |
2.9 2.9 2.2 2.0 50.7 50.8 |
10 10 18.7 18.5 285 275 |
20 20 38.7 37.8 456 451 |
|
D Direct observation, P Pressure sensor methods |
||||||
For varied packet traffic levels inside the network, the methodology enhanced the network transmission rate by up to ten percent. As a result, the smart animal health monitoring system is a better option for deploying than current random methods for sparse wildlife populations. Furthermore, we intend to test these simulations outcomes in the future by creating a collared prototype with double wireless platforms and undertaking a full implementation of the proposed systems in the real multiple sensors. Cameras are essential for evaluating animal care with pre-determined measured value and collecting real-time information of various parameters for machine learning research, whereas cameras could be utilized using information visualization to forecast animal behavior and health. This seems to be critical because many diseases were transmitted from animals. This can therefore by identifying the animals' sickness and movement in advance as future work.
The research article's ultimate purpose is to create "a model of an IoT intelligent animals healthcare application". With the support of both a Raspberry Pi 3 (including integrated Wi-Fi), MCP-30008 (analog to digital conversion), bodily temperature controller, pulse detector, and ruminating sensor, the constructed system must be capable of real-time tracking of body temp, pulse, and ruminate. Wi-Fi-based on IEEE 802.11 specification is used to send the collected information from the interface towards the Thing-Speak cloud. This information can be accessed from anywhere via the internet and an Android app on the person's device. A person could readily determine the medical status of an animal simply by carefully observing the access to information inside the Thing-Speak cloud. If there would be any irregularity, they may contact veterinarian experts, and treatments may begin at the earliest possible time, decreasing the expense of therapy. Understanding the quality of service of the collected results would improve the study job even more. The created unique prototype could also be deployed using a Raspberry Pi 0, which is significantly less expensive than a Raspberry Pi 3. In several animals' sanctuaries, the actual execution can indeed be performed on a huge scale. We will be using the Gsm technology to send texts to landowners and operators to follow animal movements in real-time.
We concluded this animal health tracking is indeed a required technological breakthrough point discussed and analyzed. As a result, technology-based technologies such as IoT & ML may help the farmer's track animals and other wildlife. The efficiency of the proposed system outperformed that of existing schemes. The proposed approach improves standard methods, according to the evaluations. Our method decreased average latency by 75 percent on average.
Briefly and descriptively title each table and caption each figure. Place figure captions below the figures whereas table titles above the tables. Please do not include captions as part of the figures or put them in “text boxes” linked to the figures. Also, do not place borders around the outside of your figures.
[1] Bi, P., Du, X. (2021). Application of locally invariant robust PCA for underwater image recognition. IEEE Access, 9: 29470-29481. https://doi.org/10.1109/ACCESS.2021.3058761
[2] Wang, Y., Ma, X., Wang, J., Hou, S., Dai, J., Gu, D., Wang, H. (2022). Robust AUV visual loop closure detection based on variational auto-encoder network. IEEE Transactions on Industrial Informatics, 18(12): 8829-8838. https://doi.org/10.1109/TII.2022.3145860
[3] Yan, Z., Zhang, J., Tang, J. (2021). Modified whale optimization algorithm for underwater image matching in a UUV vision system. Multimedia Tools and Applications, 80(1): 187-213. https://doi.org/10.1007/s11042-020-09736-2
[4] Islabudeen, M., Vigneshwaran, P., Madhuri, G.S., Kumar, B.M., Ragaventhiran, J., Sharmila, G. (2021). Feature extraction of underwater images using principal component analysis with image registration. Materials Today: Proceedings. https://doi.org/10.1016/j.matpr.2021.03.341
[5] Wang, Y., Wang, Q., Jin, S., Long, W., Hu, L. (2022). A literature review of underwater image detection. Design Studies and Intelligence Engineering, 347: 42-51. https://doi.org/10.3233/FAIA220009
[6] Jiang, Q., Zhang, Y., Bao, F., Zhao, X., Zhang, C., Liu, P. (2022). Two-step domain adaptation for underwater image enhancement. Pattern Recognition, 122: 108324. https://doi.org/10.1016/j.patcog.2021.108324
[7] Abu, A., Diamant, R. (2022). Feature set for classification of man-made underwater objects in optical and SAS data. IEEE Sensors Journal, 22(6): 6027-6041. https://doi.org/10.1109/JSEN.2022.3148530
[8] She, M., Nakath, D., Song, Y., Köser, K. (2022). Refractive geometry for underwater domes. ISPRS Journal of Photogrammetry and Remote Sensing, 183: 525-540. https://doi.org/10.1016/j.isprsjprs.2021.11.006
[9] Li, T., Yang, J., Zhou, H., Lian, T. (2021). Research on the method of underwater image enhancement. In Journal of Physics: Conference Series, 1982(1): 012075. https://doi.org/10.1088/1742-6596/1982/1/012075
[10] Jian, M., Liu, X., Luo, H., Lu, X., Yu, H., Dong, J. (2021). Underwater image processing and analysis: A review. Signal Processing: Image Communication, 91: 116088. https://doi.org/10.1016/j.image.2020.116088
[11] Fan, H., Qi, L., Chen, C., Rao, Y., Kong, L., Dong, J., Yu, H. (2021). Underwater optical 3-D reconstruction of photometric stereo considering light refraction and attenuation. IEEE Journal of Oceanic Engineering, 47(1): 46-58. https://doi.org/10.1109/JOE.2021.3085968
[12] Chen, L., Dong, J., Zhou, H. (2021). Class balanced underwater object detection dataset generated by class-wise style augmentation. arXiv preprint arXiv:2101.07959. https://doi.org/10.48550/arXiv.2101.07959
[13] Xin, L., Shi, Z., Chen, Y. (2021). Robust detection of lighting LEDs by analyzing the geometric structure of the tunnel interior-environment in vehicle-mounted video sequences. In 2021 40th Chinese Control Conference (CCC), Shanghai, China, pp. 3327-3333. https://doi.org/10.23919/CCC52363.2021.9550607
[14] Al-Shimiry, I.F., Al-Zuky, A.A., Al-Obaidi, F.E. (2021). Geometrical models for simulating the properties of underwater bodies using digital image processing. In AIP Conference Proceedings, 2404(1): 030003. https://doi.org/10.1063/5.0068897
[15] Latchoumi, T.P., Raja, K., Jyothi, Y., Balamurugan, K., Arul, R. (2022). Mine safety and risk prediction mechanism through nanocomposite and heuristic optimization algorithm. Measurement: Sensors, 23: 100390. https://doi.org/10.1016/j.measen.2022.100390
[16] Jian, B., Ling, Y., Zhang, X., Ou, J. (2021). Computer image recognition and recovery method for distorted underwater images by structural light. In Journal of Physics: Conference Series, 2083(4): 042019. https://doi.org/10.1088/1742-6596/2083/4/042019
[17] Pugazhendhi, L.T., Kothandaraman, R., Karnan, B. (2022). Implementation of visual clustering strategy in self-organizing map for wear studies samples printed using FDM. Traitement du Signal, 39(2): 531-539. https://doi.org/10.18280/ts.390215
[18] Sharma, S., Varma, T. (2022). Graph signal processing based on underwater image enhancement techniques. Engineering Science and Technology, an International Journal, 32: 101059. https://doi.org/10.1016/j.jestch.2021.09.005
[19] Yuan, F., Zhan, L., Pan, P., Cheng, E. (2021). Low bit-rate compression of underwater images based on the human visual system. Signal Processing: Image Communication, 47: 96-114. https://doi.org/10.1016/j.image.2016.06.001
[20] Latchoumi, T.P., Kumar, A.S.D., Raja, J.Y. (2022). Detection of Diabetic retinopathy with ground-truth segmentation using fundus image. In 2022 7th International Conference on Communication and Electronics Systems (ICCES), Coimbatore, India, pp. 1770-1774. https://doi.org/10.1109/ICCES54183.2022.9835848