Kongphope Chaarmart | Sureeporn Narongwongwattana | Ronnarit Rittiron | Worawat Sa-Ngiamvibool*
© 2021 IIETA. This article is published by IIETA and is licensed under the CC BY 4.0 license (http://creativecommons.org/licenses/by/4.0/).
OPEN ACCESS
The chemical quality of juices and wine produced from Mamao fruit was evaluated by Fourier transform near-infrared (FT-NIR). The calibration equation was created by the cross-validation method to be si+mulated the accuracy. Statistical values composed of correlation coefficient (R), standard error of cross-validation (SECV) and bias were used. Brix values and acidity values of Mao juice and the Brix, acidity, and alcohol values of Mao wine products were evaluated through the standard and cross-validation relation. It was found that was observed with NIR spectrometer to be absorbed in the same IR wavelength (1450 nm) which indicated that the water is the main composition. Based on FT-NIR analysis, the spectrum latices of juices and wine were revealed in the same range of the absorption bands at 1450 nm and 1940 nm to be confirmed the water composition. Also, the FT-NIR spectra from region 2258-2312 nm in Mao wine product have been predicted to the Ethanol functions.
chemical quality, Mao juices, Mao wine, near-infrared spectroscopy
Mamao Luang (Antidesma puncticulatum Miq.) is one of the geographical indications (GI) of Sakon Nakhon province, Thailand, found on Phu Phan mountain [1-4]. In addition, the Mamao Luang is the main crop used for a juice-making process (juices and wine), which is conducted by the cooperation and small and micro-community enterprise (SME) of Sakon Nakhon. The benefit of natural products is claimed the health-enhancing functional foods. However, the quality of products could be observed from the chemical composition to be demonstrated the quality of the products. Nowadays, the researcher presented several techniques to monitor various parameters and chemical properties of wine by using sensors, including optical sensors and a color camera, and to determine the moisture content of wet and dry oak wood conditions affecting oxygen transmission [5]. It was found that the water saturation in wood is a factor that affects oxygen transmission decreased on wine curing with oxygen transmission rate (OTR). For advanced method is electronic tongue; to analyze and classify the different types of wines from wine aromas with metal oxide gas sensors within the digital microfluidic (DMF) [6]. Based on the electronic tongue [7, 8], there are classification methods of white and red wine with machine learning, artificial neural network (ANN) worked with models or analysis instruments such as Principle Component Analysis (PCA), Soft Independent Modeling Class Analogy (SIMCA) and Partial Least Squares (PLS) regression for the classification of the wine and quantification of the grape sequence. All these methods can classify each type of wine, but some methods require preparation for substance testing, parameter measurement in a laboratory, and prediction, which make technical complexity. However, there is a method for measuring parameters that have the principle of working by lighting up through the solution or substance, light absorption in near-infrared light makes the molecules of substance vibrate at high frequencies. The vibrations of various bonds occur at different wavelengths, which is a non-destructive inspection method. All of the above methods are near-infrared (NIR) spectroscopy [9]. This method could be easily carried and transferred to analytical precision for chemical identification and quantitation from spectral resolution. The advantages of this method are uncomplicated, fast (15-90 s), accurate analysis, no chemicals or fewer chemicals and can measure the compositions or properties of agricultural products, food, and various elements simultaneously [9, 10], such as measuring quality components of canola seed [11], determination of moisture content of in-shell peanuts [12], measuring the chemical composition of the gas [13, 14], determination of ammonia content in Para rubber latex [15], the detection of milk adulterations with water [16], detection of postharvest quality of Cherry tomatoes [17] and developing instruments [18] for determining ripeness including Brix, Potential of Hydrogen Ion (pH), and Anthocyanin concentration in grape wine. The parameters have been verified with a root mean square error of calibration (RMSEC), the root mean square error of validation (RMSEV), and R2 (Multiple correlation index). This research can measure the Brix and pH in grapes, but Anthocyanin must require other techniques that are accurate to help to measure for greater accuracy. The researcher [19] studies the effect of temperature variation on the visible and NIR spectra between white and red wine because the temperature affects the vibration and frequency of molecular bonds. The results show that the length of the spectrum at approximately 970 nm and 1400 nm affected the O-H bond the PLS calibration was inversely when the temperature increased.
In this work, we used NIR spectroscopy within the Fourier transform (FT-NIR) mode to analyzing the chemical identification and quantitation to be evaluated of chemical quality on juices and wine produced from Mamao fruit.
2.1 Samples
In this study, 30 samples each for juices and wine produced from Mamao fruits were used with different shelf-life ranges. Shelf life from 2016 to 2019 is juice product samples and shelf life from 2018 to 2019 is the wine product samples. Both product samples composed of the 1st order and 2nd order of squeeze processing were measured to be provided a variance range of sweetness, alcohol content, and acidity values covering samples as expected in all products. All samples were separated into two sets, one set was transported to Near Infrared Laboratory at Kasetsart University and measured by Near-Infrared Spectrometer. Each sample was measured at room temperature (25℃) and relative humidity of 30%.
2.2 Instrumentation
This study was used two instrumentations compose of Fourier transform near-infrared (FT-NIR) spectrometer (MPA model, Bruker) within wavelength range 800 – 2500 nm (around 12500 to 4,000 cm-1) [15] at the Near Infrared Laboratory, Food Engineering Department, Engineering at Kamphaengsaen Faculty, Kasetsart University, Thailand. FT-NIR spectrometer measured all samples under a transfection system within a petri dish (34.00 mm of diameter) and then covered with a reflector at a physical pathlength of 0.1 mm.
2.3 Data analyses
The calibration equation for analyzing the quality of juices and wine produced from Mamao fruits was created based on the relationship between the NIR absorption region and standard quality values. Which the processing was carried by partial least squares regression (PLS) through the software package of the FT-NIR spectrometer (OPUS 6.5) and the unscramble (version 9.7) program. All analysis results were created by the cross-validation method and then used to simulate the accuracy of the created equation. Statistical values of the created equation have consisted of correlation coefficient (R), standard error of cross-validation (SECV), and bias. These values could be investigated the performance of created equations for the determination of Brix and acidity values of Mao juice and the Brix, acidity, and alcohol values of Mao wine products.
3.1 NIR spectra for juices and wine
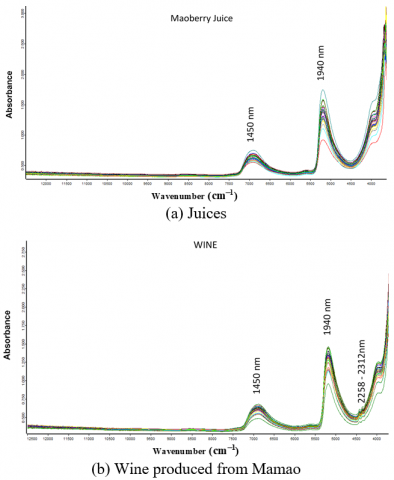
Figure 1 shows the original spectrum field of (a) juices and (b) wine produced from Mamao fruit as obtained within FT-NIR spectrometer in wavelength around 800-2500 nm. Both textures are the same with the dominant absorbance at the same IR wavelength of 1450 nm and 1940 nm, which indicated the water for all produces from Mamao fruit to be absorbed with NIR spectrometer [15, 20]. It also appeared a slight absorption at around 2258-2312 nm for Mamao wine (Figure 1(b)) which was corresponding to the absorption band of Ethanol [20].
Figure 1. The original FT-NIR spectra lattices obtained from FT-NIR Spectrometer
3.2 Calibration equation development
Mamao juices and wine products each for 30 samples were measured by FT-NIR spectrometer to be analyzed the chemical quality as shown in Tables 1 and 2, respectively. The data analysis as listed in Tables 1 and 2 were statistical parameters of the samples in the calibration set and the validation set based on the full cross-validation method. According to the original spectra, the baseline shift due to the light scattering effect has occurred. Also, sample pretreatments were used to reduce unwanted influences on spectra before developing calibration equations.
Focus on Table 2, the correlation coefficient (R) of calibration (Rc) and cross-validation (Rcv) groups affected onto the calibration equation for L*, a*, and b* values have been more differenced with more than 0.5. This result demonstrated that the calibration equation is not suitable for L*, a*, and b* values determination since these parameters express to physical properties of the sample, which the responding with suitable in this case should be visible light in wavelength 400-700 nm. While FT-NIR spectrometer is detected the wavelength within 800-2500 nm. Hence, the specific data was affected to be not evaluated the color quality of the wine.
Table 1. Statistical parameters of the Mamao juice samples in the calibration set and the cross-validation set
|
Parameters |
Pretreatment |
Calibration set |
Cross-Validation set |
Factors |
RPD |
Region (cm-1) |
|||
|
R2 |
SEC |
R2 |
SECV |
bias |
|||||
|
Brix |
1st derivative |
0.994 |
0.269 |
0.888 |
1.046 |
0.011 |
6 |
2.99 |
7502.1 - 6098.1 |
|
2nd derivative |
0.935 |
0.825 |
0.888 |
1.048 |
-0.074 |
2 |
2.99 |
9403.7 - 6098.1, 4601.6 - 4246.7 |
|
|
Vector Normalization (SNV) |
0.993 |
0.305 |
0.891 |
1.034 |
-0.057 |
6 |
3.03 |
7502.1 - 5446.3 |
|
|
1st derivative +SNV |
0.995 |
0.254 |
0.901 |
0.984 |
-0.007 |
5 |
3.18 |
7502.1 - 5446.3 |
|
|
Acidity |
1st derivative |
0.988 |
0.094 |
0.860 |
0.287 |
-0.016 |
6 |
2.68 |
7502.1 - 5446.3, 4601.6 - 4246.7 |
|
2nd derivative |
0.837 |
0.316 |
0.806 |
0.339 |
0.011 |
1 |
2.27 |
7502.1 - 5446.3, 4601.6 - 4246.7 |
|
|
Vector Normalization (SNV) |
0.986 |
0.102 |
0.917 |
0.222 |
-0.008 |
6 |
3.46 |
6102 - 5446.3, 4601.6 - 4246.7 |
|
|
1st derivative +SNV |
0.995 |
0.059 |
0.903 |
0.239 |
0.022 |
6 |
3.22 |
6102 - 5446.3 |
|
Table 2. Statistical parameters of the Mamao wine samples in the calibration set and the cross-validation set
|
Parameters |
Pretreatment |
Region (nm) |
rank |
Rc |
SEC |
Rcv |
SECV |
bias |
|
Brix |
2nd derivative |
1332-2175 |
3 |
0.85 |
1.34 |
0.63 |
1.88 |
-0.04 |
|
Acidity |
1st derivative + SNV |
1332-1470 |
1 |
0.47 |
0.08 |
0.31 |
0.08 |
-0.00 |
|
alcohol |
MSC |
800-1836, 2173.4-2356.9 |
4 |
0.98 |
0.52 |
0.73 |
1.83 |
0.00 |
|
L* |
1st derivative + MSC |
800-1639, 2173-2354 |
2 |
0.94 |
0.45 |
0.29 |
1.23 |
0.02 |
|
a* |
1st derivative + MSC |
800-1639, 2173-2354 |
3 |
0.97 |
0.39 |
0.40 |
1.42 |
0.01 |
|
b* |
1st derivative + SNV |
800-1639, 2173-2354 |
2 |
0.93 |
0.36 |
0.29 |
0.97 |
0.01 |
|
h |
SNV |
2173-2354 |
2 |
0.56 |
133.92 |
0.44 |
142.09 |
-2.67 |
3.3 Chemical quality of juices and wine produced from Mamao fruit
3.3.1 Sweetness analysis or Brix value
Brix value or sweetness of juices and wine produced from Mamao fruit was processed based on the partial least squares regression (PLS) method through OPUS 6.5 software. The best equations for analyzing the sweetness in the wavelength range 1332-2175 nm were optimized from the spectrum with the 1st derivative and vector normalization (SNV) combination method for Mao juices, and the 2nd derivative for Mao wine. All scatter plots of creating and testing of equation results through the full cross-validation method were showed in Figure 2.
Figure 2. Scatter plots of predicted Brix values in the calibration set and the validation set for (a)-(b) juices and (c)-(d) wine produced from Mamao fruit, respectively
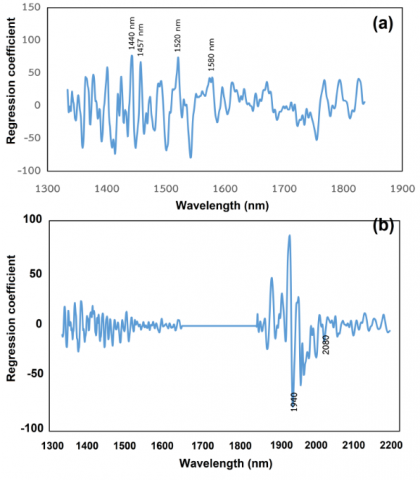
From scatter plots of calibration and validation graph, both results indicated that the sampling points were tended distributed around a diagonal line. The values of data analysis via NIR techniques and values as analyzed by standard methods must be related to the correlation coefficient (R), standard error of cross-validation (SECV) and bias mean. A sweetness analysis of Mao juices carried by NIR techniques to be obtained the correlation coefficient, standard error of cross-validation and bias of approximately 0.90, 0.98 ºBrix, and 0.007 ºBrix, respectively, within the group of validation set equations. However, the value from the paired t-test indicated that sweetness as analyzed with NIR and standard methods was related significantly with 95 % confidence intervals. For the Mao wine products, the values of data analysis via NIR techniques and values as analyzed by standard methods were related to the correlation coefficient (R) of around 0.853 and 0.632 and error standards of around 1.337 and 1.882 ºBrix in the calibration set and cross-validation set, respectively. The coefficient of the standard equation for analyzing the amount of sweetness in juices and wine is showed in Figure 3. Figure 3(a) shows the coefficient of the calibration equation of sweetness in Mao juices. This result is noticed that the variables influencing the standard equation for analyzing the sweetness in the wine (ºBrix) are located at positions 1440 and 1580 nm, which are the absorption positions of the 0-H str. 1st overtone bond, which is the structure of Sucrose and Glucose sugar [21]. It also corresponds to the absorption position of Sucrose and Glucose as reported by Williams and Norris [20] and at the absorption position of 1457 nm. It is also another variable that influences the equation. It is the absorption position [20], which is also an element of sugar contained in fruits. In addition, at the absorption position 1520 nm, Osborne et al. [21] reported the absorption position of the O-H str. 1st overtone of the starch structure which not Glucose, Sucrose, or Fructose. Therefore, the starch or polysaccharide structure in pants will be had the monomer of Glucose sugar as connected with glycosidic bond. Hence, this variable may be critical to the calibration equations that are created. Figure 3(b) shows the coefficient of the equation of sweetness in Mao wine products. The coefficient of variables influencing the equation is 1940 nm, which corresponds to the combination absorption position of the bond of O-H str. and O-H def., the main bonds of water [20, 21] are the main elements in the wine. In addition, the variable influencing the analysis of the sweetness (ºBrix) of the wine is 2080 nm, which is the combination absorption position of the bond. O-H str. and O-H def., which are the bonding structures of Sucrose sugar [21] and close to the crystalline Sucrose absorption position at 2100 nm corresponding with reported from [20].
Figure 3. The coefficient of the calibration equation for analyzing Brix value of (a) juices and (b) wine produced from Mamao fruits
3.3.2 Alcohol analysis of wine product
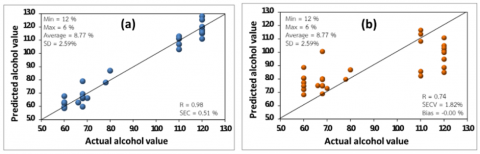
Figure 4 shows the calibration set (a) and the validation set (b) scatter plots of Mao wine product to be analyzed of Alcohol value using the 1st derivative spectrum and vector normalization combination methods in the wavelength range of 800 – 1836 nm. This method may be not suitable for alcohol prediction due to an R-value in the cross-validation group of less than 0.75 within the correlation coefficient and standard error of cross-validation of 0.74 and 1.82%, respectively.
Figure 4. Scatter plots of predicted alcohol values of Mao wine product (a) the calibration set and (b) the validation set
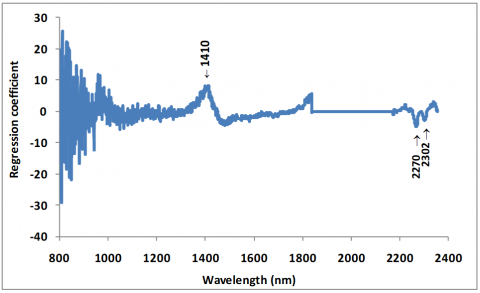
Figure 5 shows the coefficient of the standard equation for analyzing the alcohol value of Mao wine. The regression of the standard equation to estimate the alcohol value of Mao wine indicated the wavelength position of 1410 nm has influenced the standard equation to be absorbed of the O-H str. bond in conjunction with the Alkyl group (ROH) [21, 22]. This claimed the alcohol structure and also have the wavelength positions of 2270 nm and 2302 as yielded the ethanal absorption [20].
Figure 5. The coefficient of the standard equation for analyzing the alcohol value of Mao wine
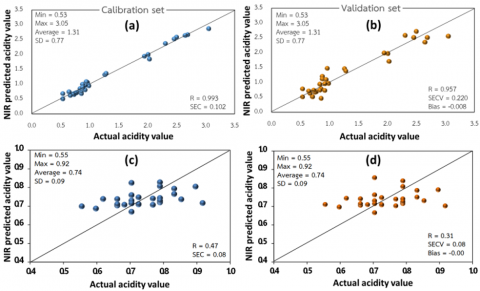
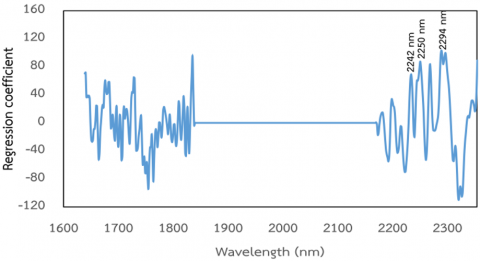
3.3.3 Acidity values analysis
Figure 6 shows the prediction of acidity values of juices and wine produced from Mamao fruit within the calibration set and the validation set through the scatter plots. The calibration set (Figure 6(a)) and the validation set (Figure 6(b)) of Mao juices, the best equations for analyzing the acidity were used Vector normalization method within the wavelength range of 1638 – 1828 and 2170 – 2354 nm. Base on NIR analyzing results, the correlation coefficient, standard error of cross-validation, and bias were obtained of 0.92, 0.22, and -0.008, respectively. Also, have the value from the paired t-test as analyzed with NIR and standard methods were related significantly with the reliability of 95 % similarly with Brix values analyzing the result. While the calibration set (Figure 6(c)) and the validation set (Figure 6(d)) of Mao wine product, the best equations for analyzing the acidity were used the spectrum with the 1st derivative and vector normalization combination methods within the wavelength range of 1332 – 1470 nm. Both reports could be not good for analysis due to an R-value in the cross-validation group of less than 0.75, which is inconsistent with other research that uses NIR techniques to analyze the quality of wine. One of the most probable reasons is that all samples were divided into 2 sets, one set for NIR measurement and the other one for chemical analytical method, while fermentation or termination process is incomplete of wine and the infections contained within the sample will still be active. Accordingly, the amount of sugar, acidity, and alcohol in wine from the 2 sets are different.
Focus on acidity values of Mao juices, the coefficient of the standard equation of acidity in Mao juices was shown in Figure 7. This result is noticed that the variables influencing the standard equation for analyzing the acidity as located at NIR wavelength positions 2242 and 2294 nm to be absorbed of the N-H str. + NH3+ def. bond and N-H str. + C=O str. bond, respectively. In specially, these locations are performed the structure of Amino acid [21] which important for healthy within more than 18 types from net 20 types. At wavelength positions, 2294 nm yielded the absorption as related with the Vitamin C or Ascorbic acid [20] with more than 8.97 mg per 100 g of Mao fruit.
Figure 6. Scatter plots of predicted acidity values in the calibration set and the validation set for (a)-(b) juices and (c)-(d) wine produced from Mamao fruit, respectively
Figure 7. The coefficient of the standard equation for analyzing the acidity value of Mao juices
Chemical quality on juices and wine produced from Mamao fruit compose of Brix and acidity values have been evaluated by the near-infrared spectroscopy method. All produce from Mamao fruit as observed with FT-NIR spectrometer to be indicated the main composition of water. Also, the FT-NIR spectra in the wavelength 2258-2312 nm of Mao wine product could be predicted and confirmed the Ethanol function or alcohol hybridization. Brix or sweetness of Mamao fruit products as analyzed have composed of Sucrose and Glucose sugar and abundant of Amino acid more than 18 types which obtained from acidity predication process.
In this work, we would like to acknowledge the Near Infrared Laboratory, Food Engineering Department, Engineering at Kamphaengsaen Faculty, Kasetsart University.
[1] Butkhup, L., Samappito, S. (2008). An analysis on flavonoids contents in Mao Luang fruits of fifteen cultivars (Antidesma bunius), grown in northeast Thailand. Pakistan Journal of Biological Sciences, 11(7): 996-1002. https://doi.org/10.3923/pjbs.2008.996.1002
[2] Jorjong, S., Butkhup, L., Samappito, S. (2015). Phytochemicals and antioxidant capacities of Mao-Luang (Antidesma bunius L.) cultivars from northeastern Thailand. Food Chemistry, 181: 248-255. https://doi.org/10.1016/j.foodchem.2015.02.093
[3] Puangpronpitag, D., Yongvanit, P., Boonsiri, P., Suttajit, M., Areejitranusorn, P., Na, H., Surh, Y. (2011). Molecular mechanism underlying anti-apoptotic and anti-inflammatory effects of Mamao (Antidesma thwaitesianum Müll. Arg.) polyphenolics in human breast epithelial cells. Food Chemistry, 127: 1450-1458.
[4] Suravanichnirachorn, W., Haruthaithanasan, V., Suwonsichon, S., Sukatta, U., Chantrapornchai, W. (2018). Stability of Mao (Antidesma bunius (L.) Spreng) powder in different food process models. International Food Research Journal, 25(6): 2666-2673.
[5] Nevares, I., Crespo, R., Gonzalez, C., Alamo‐Sanza, M. (2014). Imaging of oxygen transmission in the oak wood of wine barrels using optical sensors and a colour camera. Australian Journal of Grape and Wine Research, 20(3): 353-360. https://doi.org/10.1111/ajgw.12104
[6] Paknahad, M., Ahmadi, A., Rousseau, J., Nejad, H.R., Hoorfar, M. (2017). On-chip electronic nose for wine tasting: A digital microfluidic approach. IEEE Sensors Journal, 17(14): 4322-4329. https://doi.org/10.1109/JSEN.2017.2707525
[7] Díaz, Y.Y.R., Acevedo, C.M.D. (2014). Electronic tongue for wine discrimination, using PCA and ANN. In 2014 III International Congress of Engineering Mechatronics and Automation (CIIMA), pp. 1-5.
[8] Gutiérrez, M., Domingo, C., Vila-Planas, J., Ipatov, A., Capdevila, F., Demming, S., Büttgenbach, S., Llobera, A., Jiménez-Jorquera, C. (2011). Hybrid electronic tongue for the characterization and quantification of grape variety in red wines. Sensors and Actuators B: Chemical, 156(2): 695-702. https://doi.org/10.1016/j.snb.2011.02.020
[9] Osborne, B.G. (2006). Near‐infrared spectroscopy in food analysis. The Encyclopedia of Analytical Chemistry. https://doi.org/10.1002/9780470027318.a1018
[10] Sirisomboon, P., Deeprommit, M., Suchaiboonsiri, W., Lertsri, W. (2013). Shortwave near infrared spectroscopy for determination of dry rubber content and total solids content of Para rubber (Hevea brasiliensis) latex. Journal of Near Infrared Spectroscopy, 21(4): 269-279. https://doi.org/10.1255/jnirs.1061
[11] Daun, J.K., Clear, K.M., Williams, P. (1994). Comparison of three whole seed near‐infrared analyzers for measuring quality components of canola seed. Journal of the American Oil Chemists' Society, 71(10): 1063-1068. https://doi.org/10.1007/BF02675897
[12] Sundaram, J., Kandala, C.V., Butts, C.L., Windham, W.R. (2010). Application of NIR reflectance spectroscopy on determination of moisture content of in-shell peanuts: A non-destructive analysis. Transactions of the ASABE, 53(1): 183-189. https://doi.org/10.13031/2013.29485
[13] Li, X., Liang, J., Lin, S., Zimin, Y., Zhang, Y., Ueda, T. (2012). NIR spectrum analysis of natural gas based on hollow-core photonic bandgap fiber. IEEE Sensors Journal, 12(7): 2362-2367. https://doi.org/10.1109/JSEN.2012.2188099
[14] Bakar, N.A., Abu-Siada, A. (2017). A new method to detect dissolved gases in transformer oil using NIR-IR spectroscopy. IEEE Transactions on Dielectrics and Electrical Insulation, 24(1): 409-419. https://doi.org/10.1109/TDEI.2016.006025
[15] Narongwongwattana, S., Rittiron, R., Hock, L.C. (2015). Rapid determination of alkalinity (ammonia content) in Para rubber latex using portable and Fourier transform-near infrared spectrometers. Journal of Near Infrared Spectroscopy, 23(3): 181-188. https://doi.org/10.1255/jnirs.1160
[16] Moreira, M., de Franca, J.A., de Oliveira Toginho Filho, D., Beloti, V., Yamada, A.K., França, M.B.D.M., de Souza Ribeiro, L. (2016). A low-cost NIR digital photometer based on InGaAs sensors for the detection of milk adulterations with water. IEEE Sensors Journal, 16(10): 3653-3663. https://doi.org/10.1109/JSEN.2016.2530873
[17] Feng, L., Zhang, M., Adhikari, B., Guo, Z. (2019). Nondestructive detection of postharvest quality of cherry tomatoes using a portable NIR spectrometer and chemometric algorithms. Food Analytical Methods, 12(1): 914-925. https://doi.org/10.1007/s12161-018-01429-9
[18] Larraín, M., Guesalaga, A.R., Agosín, E. (2008). A multipurpose portable instrument for determining ripeness in wine grapes using NIR spectroscopy. IEEE Transactions on Instrumentation and Measurement, 57(2): 294-302. https://doi.org/10.1109/TIM.2007.910098
[19] Cozzolino, D., Liu, L., Cynkar, W.U., Dambergs, R.G., Janik, L., Colby, C.B., Gishen, M. (2007). Effect of temperature variation on the visible and near infrared spectra of wine and the consequences on the partial least square calibrations developed to measure chemical composition. Analytica Chimica Acta, 588(2): 224-230. https://doi.org/10.1016/j.aca.2007.01.079
[20] Williams, P., Norris, K. (2001). Near Infrared Technology in the Agricultural and FOOD INDUSTRies. American Association of Cereal Chemists, Second edition, USA.
[21] Osborne B.G., Fearn T., Hindle, P.H. (1993). Practical NIR Spectroscopy with Applications in Food and Beverage Analysis. Longman Singapore Publishers (Pte) Limited, Second Edition, Singapore.
[22] Workman, J., Weyer, L. (2012). Practical Guide and Srectral Atlas for Interpretive Near Infrared Spectroscopy. CRC Press, Taylor & Francis Group, NW.