Tsangue Ndzenyuy Jones | Gamom Ngounou Ewo Roland Christian* | Paune Felix
© 2021 IIETA. This article is published by IIETA and is licensed under the CC BY 4.0 license (http://creativecommons.org/licenses/by/4.0/).
OPEN ACCESS
Studies have been intensified over the past few years in wireless sensors network, which has become a fast emerging technology for many innovative applications related with monitoring. In this paper, we proposed a wireless sensors network using inexpensive nRF24l01 transceivers and Raspberry Pi to monitor linear infrastructures like pipelines, surfaces of buried optical fiber for bushfire or river beds for flood detection. We realized this network using a tree architecture, with three hierarchy levels which are: The base sensor node, the data relay node, the data dissemination node. Using the open source Arduino IDE software and Node-Red, we programmed the microcontrollers for the various nodes and ran the Network Control Center (NCC). The base nodes are placed in deep sleep mode, for energy saving reasons. Each of the payloads sent by the nodes is analyzed at the NCC, in case of an undesirable event, the base station generates an alert and sends through Twitter a message containing the address of the affected nodes. We got good results, the base nodes were placed 80m apart and we didn't lose any payload in our tests. Due to the low current draw of these nodes, the BSN is expected to operate on battery power within five years of battery life, as the microcontrollers and transceivers are placed in deep sleep most of the time.
MQTT, nRF24l01, raspberry Pi, wireless sensors network, Twitter
Natural disasters such as floods and bushfires are usually associated with loss of life and property damage in developing countries. Wireless sensors network (WSN) is a technology which can alert residents in case of an approaching danger, the technology requires cheap and long lasting nodes functioning on batteries [1] to monitor risk zones. The nodes being the devices deployed on the monitored field to sense and forward their data for analysis, usually is comprised of a microcontroller, a transceiver, a low power sensor and a power source. To obtain long battery life, a technique called clustering [2] is usually implemented where the nodes are divided into groups, one of the node in each group called the cluster head, collects data from the other nodes and forwards them to the base station.
Many have investigated and experimented wireless networks for the monitoring of environmental parameters [3-5]. Their approaches vary, from making a small local network around a home or factory, to using satellites to relay sensed data in case of a global network. The architecture of these networks usually is determined by the infrastructure to be monitored. Rahim et al. [6] built a low cost local network around the nRF24l01 low cost short range transceiver and the Arduino. The child nodes detect and transmit their data through the super nodes to the coordinator node in a framework of tree architecture. Each of the nodes are attributed an address for identification. The conception of this network around an nRF24l01 was as a cheaper alternative to a network around the Zigbee. This wireless sensor network is only around a specific locality, that is a limited area, the monitored areas should be controlled within the reach of the network, it doesn’t use the cloud to sink its data so that the monitoring can be done remotely.
The GSM technology too has been implemented in a WSN for monitoring purposes. Liu et al. [7] built sensor nodes around a GSM module that connects directly to the satellite to relay an outbreak detected on the field. Communication starts only when bush fire is detected on the node, the nodes send SMS indicating their position using GPS coordinates. Each node had a mobile phone module with a combined GSM and GPS receiver. The GPS receiver is used to obtain the location information and the GSM modem for transferring temperature, humidity and location information sensed to the remote mobile phone in an SMS format for further processing and necessary actions taken. This project presents limits in the cost of realization of the nodes and power consumption which is up to 1.9W. The nodes might require more attention for maintenance purposes.
Nikhade [8] proposed a network involving a Raspberry Pi and a Zigbee. The nodes are built around an Arduino Uno microcontroller, the data collected from the field is transmitted through a wireless canal to a base station. The base station posts the network data on the internet for access to clients either through a wireless local area network or internet connection. Zigbee devices can transmit within a distance ranging between 10 to 100 m line of sight. In order to realize a network out of it, theses nodes are made to transmit their data within themselves till the base station. These nodes are easy to implement for monitoring applications, but non the less they are to be awake to receive data from neighboring nodes since they serve also as routers, in this case more current will be drawn from the batteries, hence the time to change batteries will be frequent, Zigbee transceivers are expensive compared to other transceivers with the same range.
Fernández-Ahumada et al. [9] proposed an architecture to build a wireless sensors network to monitor and control the irrigation in a farm using SIGFOX transceivers. The sensors are deployed in key areas that will give relative data about the whole parcel. The data is disseminated through gate way base stations, and the utilization of cloud computing through free hardware technologies. The system controls the flow of water in the different compartments of the parcel based on the intelligent decisions due to the algorithm of the system. The communication is directly to the SIGFOX base station that sinks the received data into the cloud through SIGFOX Backend servers. The network is built around a HELTEC Wi-Fi LoRa 32 Board, which incorporates a 0.96 inch OLED display where messages established through software can be visualized, the sensors are SHT 15 that measures temperature and humidity. The measured parameters are analyzed with a provided mathematical tool conceived with MATLAB. The LoRa 32 used here was mainly because of its long range (more than 500m), though the cost to build such a system is relatively important for bigger monitoring infrastructures, but the architecture studied here is just for an agricultural parcel which could be some few hectares.
In this work, we proposed a very cheap wireless sensors network to monitor linear infrastructures like pipelines, surfaces of buried optical fiber cable [10, 11] for bush fire monitoring or river beds to detect flooding as the case with the Makepe Missoke river here in Douala, that usually overflows after heavy rains, without any alert, houses and properties are destroyed, more at times, the lives of kids and the elderly are lost. The network will store its data on the internet for remote monitoring and will be able to generate an alert on social media in case of and undesired event for necessary measures to be taken so as to avoid worsening.
We realized this network and kept tract of the payload exchange between the BSN and DRN, DRN and DDN, finally between DDN and the cloud. The BSN read the sensors every 15 minutes and sent to the DRN. The payload package contained the node address, the sensor state and a package counter for detecting lost payloads. Data transfer at all levels were successful and we recorded the network statistics on a GUI developed with Node-RED. We simulated a fault by changing the sensor state and the system generated a tweet as expected. Each of the payloads were stored on the Adafruit website for remote monitoring. Results were satisfactory.
This paper is organized as follows: Section 2. gap statement, 3. materials and methods, 4. results, 5. conclusion.
We proposed this network as a better solution for monitoring applications since it can monitor infrastructures anywhere in the world and is not limited to a specific locality as compared to Rahim et al. [6], this network also uses low cost, low power short range transmitters (nRF24l01) to relay monitored data until it is sunk in the cloud rendering our network more cost efficient over the GSM [7] and Zigbee [8] technologies. This network is expected to run for up to 5 years with the present power considerations and optimization routines, a scope not explored in the above mentioned papers.
In order to monitor natural hazards like bush fire along a buried pipeline, river banks to detect an overflow which could lead to floods, sensors need to be close to each other so that there could be real time response to the network and as such, necessary measures taken to avoid worsening. We therefore propose a network based on cheap nRF24L01+ 100m transceiver modules, used to monitor linearly spread infrastructures like pipelines or surfaces of underground optical fiber cables. The nRF24L01 is a cheaper alternative to Zigbee [8], SIGFOX [9] and LoRaWAN [12].
The system will, through social media, Twitter, send tweets to the concerned personnel with details about an outbreak in case one comes up. It renders communication adapted to today’s realities where communication is fastest through social media.
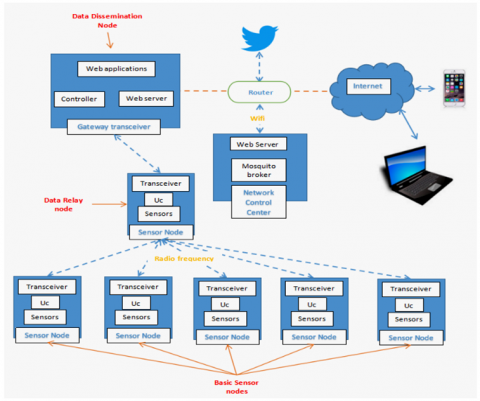
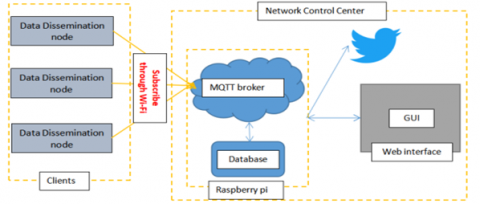
Figure 1. System architecture
3.1 Overall system architecture
The system architecture is represented in Figure 1 above, the Basic Sensor Node (BSN) constitutes a microcontroller (ATmega328P), a transceiver(nRF24l01), a sensor and battery. Placed within the reach of the Data Relay Node (DRN) where their payloads are delivered. Each BSN sends its data to its assigned DRN every 15 minutes, after sending data, it enters sleep mode for power saving raisons [13, 14]. Each DRN can have up to six child nodes. The DRN is also constituted with a microcontroller, a sensor and obviously a transceiver. They forward each payload received to the Data Dissemination Node (DDN), hence, they are expected to be always listening, coupled to that, they also pick sensor state each 15 minutes and sends to the DDN. The nodes are deployed within a distance of 70 - 80 meters from each other. Each node reads the sensors, sends the data as a payload to the next node in hierarchy (BSN to DRN and DRN to DDN), when the payload reaches the gateway node (DDN), according to the address of the payload, the DDN subscribes the payload as a topic to the online MQTT client web page designed by Adafruit as a platform for IoT applications. The Network Control Centre (NCC) is made of a Raspberry pi 3 B+ computer featuring the Message Queuing Telemetry Transport (MQTT) protocol. The NCC runs the Mosquito MQTT broker on its server with which all the gateway transceivers running on a NodeMCU ESP8266-12E, subscribe their payloads for package analyses. All the DDNs in the network [15] and the NCC are connected to the internet through WiFi. The System at the Network control center is programmed using Node-RED, a powerful graphical programming environment that runs all the different processes concerning the Network. In case of an outbreak, the control center posts a tweet indicating the affected zones.
The DDN and DRN nodes will be mounted with the nRF24l01+PA+LNA transceivers that have an on board amplifier which extends its distance to 1100 m.
3.2 Node design
3.2.1 Basic sensors node and data relay nodes
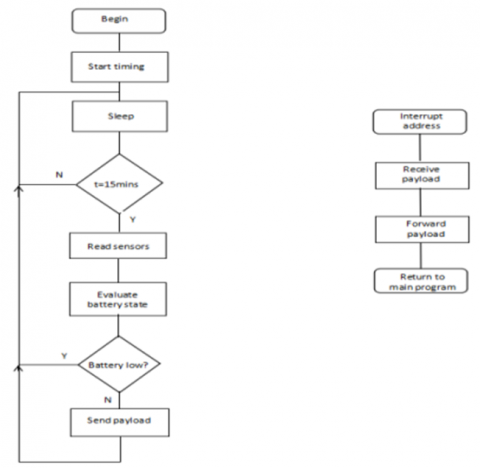
The nodes are controlled by the ATMEGA328P microcontroller which can function with 3.3V at 8MHz, the chip will be placed in deep sleep mode in order to limit current consumption, once every 15minutes, it senses the data around it and sends to the adjacent node. For this application, we use KY-026 flame sensor, to detect bushfire along an optical fiber cable. The flow chart in Figure 2 describes the functioning of the main program of each node [16].
The payloads are forwarded till the gateway node or sink node that bridges the data into the MQTT cloud which thanks to Adafruit website (io.adafruit.com), a free access is given for hosting sensor activity for projects of this nature. This node needs internet connection through Wi-Fi in order to sink its data. One of each sink node is to be placed every 2km.
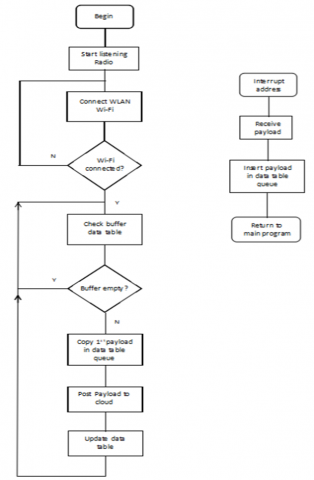
3.2.2 Gateway node
This node is built around a Node MCU ESP8266 12-E controller with an on board Wi-Fi shield that receives data from the router nodes (DRN) and bridges to the mosquito broker found either in the local server, Raspberry pi, or the online server offered by Adafruit. The flow chart in Figure 3 details it’s functioning:
Figure 2. Flow chart of the main program of each node
Figure 3. Flow chart of gateway node
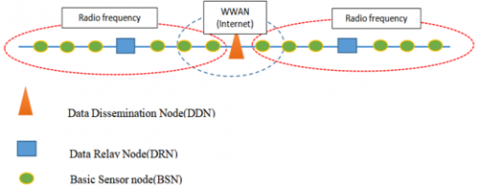
3.2.3 Node deployment
The node deployment is illustrated in Figure 4 below. Each DRN node listens to six BSNs and the DDN listens to two DRNs. The DDN is placed within the proximity of two DRN radio coverage.
Figure 4. Node deployment
3.3 Network control center design
The network control center is connected through a wireless local area network [17, 18], the same which connects the gateway nodes to periodically analyze the packets sent by all the sensor nodes. In case of an outbreak, the address of the affected node(s) is posted as a tweet to the personnel responsible for the given zone. Figure 5 presents a functional structure. The design is built around IBM’s graphical programming software Node-RED.
Figure 5. Functional structure of the NCC with the MQTT broker
3.4 Node power considerations
Each sensor node most of the time is on sleep mode, it wakes up each 15 minutes, powers up the sensors and the transceiver, reads the sensor and sends to the next node, then returns to sleep. With such considerations, consulting the data sheets of the different components to estimate the battery [19] life of each node, we have:
The ATMEGA328P [20]:
During sleep (Power down mode and watchdog enabled) draws 44uA,
During active mode (Vcc = 3V) draws 2.4mA
The nRF24l01 [21]:
During sleep mode (Standby 1 mode) it draws 26uA
During transmit mode (0dBm) draws 11.3mA
The KY-028 flames sensor:
Draws 11mA (measured with a digital multimeter)
Based therefore on 15 minutes functioning cycle:
Seconds in 15min = 900s
Current consumption during 899.5s(sleep)
Isleep = 44uA +26uA = 70uA
Current consumption during reading and sending data (during 0.5s approximation)
Itrans = 2.4mA + 11.3mA + 11mA = 24.7mA
Average current consumed in 900s:
I = (899.5/900)*70uA + (0.5/900)*24.7mA
= 69.96uA + 13.7uA = 83.66uA
We have an hourly current draw of average 85uA. Choosing a 3.3V, 3800mAh large capacity rechargeable lithium battery, we can estimate the node life to:
(3800mAh/85uA)/24 = 1862.74 days.
Our battery is expected to work for 5.1 years for the basic sensor nodes which only senses data and sends the payloads. Both DDN and DRN nodes will have an energy harvesting mechanism to keep them up to be able to receive the payloads coming from the BSN nodes.
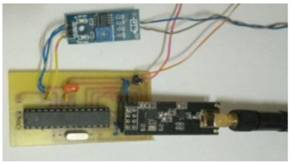
The final circuit boards for the monitoring of bushfire, were made and housed in a PVC 100mm*100mm water proof casing. The BSNs run on battery, meanwhile the DRNs and DDNs are expected to have energy harvesting mechanisms, not explored within the scope of this paper. The BSN are have the nRF24l01 transceivers covering a range of 100m (Figure 6), chosen for its low power characteristics, the DRN and DDN have the nRF24l01+LNA+PA (Figure 7) which has an on board power amplifier extending the range to 1.1km.
Figure 6. Basic sensor node
Figure 7. Date relay node
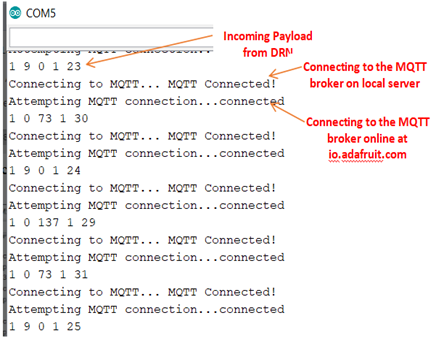
The Basic sensor node reads the sensors once every fifteen minutes and forwards the data as a payload to the Data Relay Node. Using the Arduino IDE Serial monitor, the code was modified to print out the received payloads so we could test all the levels of the network. Figure 8 below shows the forwarded payloads received from the BSNs. The payload contains the addresses of the nodes involved in the payload’s path. Each of the Nodes that handles the payload leaves a signature (its address) in order to facilitate tracing the payload at the level of the base station.
Figure 8. Communication between BSN and DRN
Each payload anyway between the radio network contains four vital informations: the address of the DRN (stored in octal format but displayed in decimal 910 = 118); the address of the BSN in case the payload comes from a BSN else the address is 0; the read sensor data, we used a logic level sensor that provides a logic “0” in case of a fire outbreak and “1” when there is no fire; and lastly a counter that increments every time a payload is sent.
The Data Relay Nodes in turn receives the payloads and sinks them into the cloud while including in the payload, its own address at the start of it, each of the different arrays are separated with a space to ease interpretation at the Network control center. Using Arduino IDE serial monitor, we could visualise the data reception and treatment as presented in Figure 9.
Each time a payload arrives each DDN from the daughter DRN, the DDN inserts its own address, then connects to the local server which is obviously connected to the same WLAN as the Raspberry pi, when connection is established, the payload is subscribed with a topic known to the base station, then disconnects. It in turn establishes another connection to the online MQTT broker found on io.adafruit.com. Once connection is established, according to the address of the sending node, the payload is then subscribed to that topic. Each sensor is represented online by individual feeds which happens to be the names of each of the nodes. The base station then analyses each of the incoming payloads and takes decisions in case of undesired circumstances around a particular sensor. The base counts the payloads and evaluates the efficiency of the network, gives the total number of payloads received and those lost. This permits us to know the optimal distance within which each of the sensor nodes are to be placed so as to avoid payload losses.
Figure 9. Debugging the payloads received at the NCC
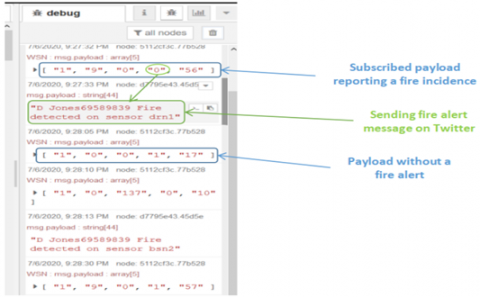
In Figure 10 below, we used Node-RED’s debug window to verify the payloads as the DDNs subscribe them, at same time when an incidence is detected a tweet is posted.
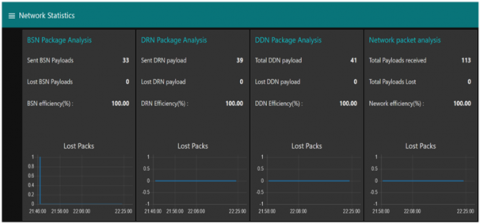
A user interface is designed (Figure 11) using Node-RED, access to this dashboard is through a web browser, entering the IP address and the port. This dashboard was used to analyze the payloads received from the network. We wanted to determine the efficiency of the network by counting the payloads as they arrive, in case of a lost payload, the dashboard shows the number lost and the statistics.
Figure 10. DDN nodes sinking their data into the cloud
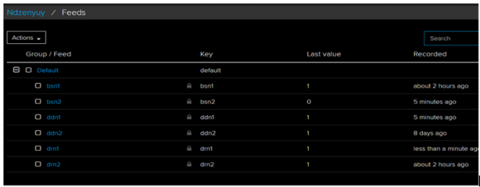
On Adafruit website (Figure 12), each node stores its data on feeds that were created earlier, the feeds are actually topics through which the payloads are subscribed. The feeds display the last subscribed value, to view other values, we click on the desired feed; In case of an outbreak, the Network control center sends a Tweet to the provided tweeter ID(s) for an alert (Figure 13).
Figure 11. Network statistics displayed on the NCC GUI
Figure 12. Network sensor data displayed on the internet
Figure 13. Generated alert messages on Twitter
In this paper, we presented how to implement a wireless sensor network around a cheap nRF24L01 to sense data and report to the base station, the atmospheric data picked around these sensors. The communication used two different frequencies 2.4MHz radio frequency and Wi-Fi to transmit the payloads from the basic nodes to the Network Control Center, the Data dissemination node is the gateway node that collects data from the radio transceivers and subscribes it as a topic to the MQTT servers, running in the raspberry pi and on Adafruit website. In case of an outbreak, a tweet is sent to a qualified personnel for necessary actions. Satisfactory results were obtained as far as the payloads transfer is concerned, nodes were deployed within a distance of 80m from each other and no payloads lost, with this algorithm, the batteries of the basic sensor nodes are expected to run for 5 years. This article provides a cost-effective solution to the establishment of a network of wireless sensors for monitoring floods, detecting bush fires, or reporting any malfunction along a perimeter, thanks to the hardware and software technologies that were used.
Further research can be carried out in order to build an automated system of drones dispatched throughout the monitored structure, such that in case of an outbreak, the identity of the concerned node is sent, the Network Control Center sends the coordinates to a drone connected to the network and closest to the affected area, which will automatically fly to the area with a problem to take a video of the fire/flood and broadcast back at the base for better appreciation and for necessary measures to be carried out.
[1] Potdar, V., Sharif, A., Chang, E. (2009). Wireless sensor networks: A survey. 2009 International Conference on Advanced Information Networking and Applications Workshops, Bradford, UK. https://doi.org/10.1109/waina.2009.192
[2] Zanjireh, M.M., Shahrabi, A., Larijani, H. (2013). ANCH: A new clustering algorithm for wireless sensor networks. 2013 27th International Conference on Advanced Information Networking and Applications Workshops, Barcelona, Spain. https://doi.org/10.1109/waina.2013.242
[3] Kafi, M.A., Challal, Y., Djenouri, D., Bouabdallah, A., Khelladi, L., Badache, N. (2012). A study of wireless sensor network architectures and projects for traffic light monitoring. Procedia Computer Science, 10: 543-552. https://doi.org/10.1016/j.procs.2012.06.069
[4] Ferdoush, S., Li, X.R. (2014). Wireless sensor network system design using raspberry Pi and Arduino for environmental monitoring applications. Procedia Computer Science, 34: 103-110. https://doi.org/10.1016/j.procs.2014.07.059
[5] Bouakkaz, F., Ali, W., Derdour, M. (2021). Forest fire detection using wireless multimedia sensor networks and image compression. Instrumentation Mesure Métrologie, 20(1): 7-63. https://doi.org/10.18280/i2m.200108
[6] Rahim, A., Ali, Z., Bharti, R., Sabeel, S. (2016). Design and implementation of a low cost wireless sensor network using Arduino and nRF 24 L 01 (+). https://www.semanticscholar.org/paper/Design-and-Implementation-of-a-Low-Cost-Wireless-24-Rahim-Ali/d7358c3c684c5e971d73da780f400cbee2bd15e5.
[7] Liu, L., Sun, R., Al-Sarawi, S. (2010). A smart bushfire monitoring and detection system using GSM technology. International Journal of Computer Aided Engineering and Technology, 2(2/3). https://doi.org/10.1504/IJCAET.2010.030546
[8] Nikhade, S.G. (2015). Wireless sensor network system using raspberry Pi and Zigbee for environmental monitoring applications. 2015 International Conference on Smart Technologies and Management for Computing, Communication, Controls, Energy and Materials (ICSTM), Avadi, India. https://doi.org/10.1109/icstm.2015.7225445
[9] Fernández-Ahumada, L.M., Ramírez-Faz, J., Torres-Romero, M., López-Luque, R. (2019). Proposal for the design of monitoring and operating irrigation networks based on IoT, cloud computing and free hardware technologies. Sensors, 19(10): 2318. https://doi.org/10.3390/s19102318
[10] Senior, J., Kazovsky, L. (1987). Optical fiber communications: Principles and practice. Physics Today, 40(10): 128. https://doi.org/10.1063/1.2820238
[11] IEEE standard construction of composite fiber optic overhead ground wire (OPGW) for use on electric. https://doi.org/10.1109/ieeestd.1994.121449
[12] Sanchez-Iborra, R., Sanchez-Gomez, J., Ballesta-Viñas, J., Maria-Dolores, C., Skarmeta, A. (2018). Performance evaluation of LoRa considering scenario conditions. Sensors, 18(3): 772. https://doi.org/10.3390/s18030772
[13] Zanjireh, M.M., Shahrabi, A., Larijani, H. (2013). ANCH: A new clustering algorithm for wireless sensor networks. 2013 27th International Conference on Advanced Information Networking and Applications Workshops, Barcelona, Spain. https://doi.org/10.1109/waina.2013.242
[14] Jawhar, I., Mohamed, N., Mohamed, M.M., Aziz, J. (2008). A routing protocol and addressing scheme for oil, gas, and water pipeline monitoring using wireless sensor networks. 2008 5th IFIP International Conference on Wireless and Optical Communications Networks (WOCN ’08), Surabaya, Indonesia. https://doi.org/10.1109/wocn.2008.4542530
[15] Sharma, D., Verma, S., Sharma, K. (2013). Network topologies in wireless sensor networks: A review. International Journal of Electronics & Communication Technology, 4(3): 93-97.
[16] Ravi, S., Raghunathan, A., Kocher, P., Hattangady, S. (2004). Security in embedded systems. ACM Transactions on Embedded Computing Systems, 3(3): 461-491. https://doi.org/10.1145/1015047.1015049
[17] Baire, M., Melis, A., Lodi, M.B., Tuveri, P., Dachena, C., Simone, M., Fanti, A., Fumera, G., Pisanu, T., Mazzarella, G. (2019). A wireless sensors network for monitoring the Carasau bread manufacturing process. Electronics, 8(12): 1541. https://doi.org/10.3390/electronics8121541
[18] Liu, Z.G., Saifullah, Y., Greis, M., Sreemanthula, S. (2005). HTTP compression techniques. IEEE Wireless Communications and Networking Conference, New Orleans, LA, USA. https://doi.org/10.1109/wcnc.2005.1424906
[19] Community Home Automation. Arduino Low Power - How to Run ATmega328P for a Year on Coin Cell Battery. http://www.home-automation-community.com/arduino-low-power-how-to-run-atmega328p-for-a-year-on-coin-cell-battery/, accessed on June 7, 2020.
[20] ATMEL 8-bit AVR Microcontroller with 32K Bytes In-System Programmable Flash, ATMEGA328P Datasheet. http://www.atmel.com/avr, accessed on July 18, 2020.
[21] nRF24L01+ Single Chip 2.4GHz Transceiver Preliminary Product Specification v1.0. https://datasheetspdf.com/pdf/906332/Nordic/nRF24L01+/1.