Ivan S. Laktionov* | Oleksandr V. Vovna | Maryna M. Kabanets | Iryna A. Getman | Oksana V. Zolotarova
© 2020 IIETA. This article is published by IIETA and is licensed under the CC BY 4.0 license (http://creativecommons.org/licenses/by/4.0/).
OPEN ACCESS
The purpose of the article is to improve procedures of computerized monitoring and control of technological processes of growing greenhouse crops by substantiating methods of improving the accuracy of computer-integrated devices for measuring irrigation solution acidity. The article solves the topical scientific and applied problem of determining the conversion characteristics of computerized acidity monitoring systems with integral and differential assessment of their metrological parameters. Theoretical and experimental studies were obtained based on structural-algorithmic synthesis methods for information-measuring systems; methods of mathematical planning of experiments; regression analysis of experimental data and the concept of uncertainty. The computerized acidity meter was implemented on the basis of an ion-selective pH electrode, Arduino microprocessor platform, and ThingSpeak cloud computing service. The relative total boundary uncertainty of acidity measurement is not more than ±1.1 %. Methods of compensating of the random component of uncertainty based on the median filtering algorithm and additional uncertainty from the destabilizing effect of temperature were introduced when implementing the measuring device. Promising areas of priority research to improve the efficiency of the developed computerized acidity meter were justified. The developed device can be used in the complex automation of greenhouse cultivation processes. The developed and implemented measuring tool can be used when planning agricultural operations in greenhouse conditions.
meter, uncertainty, Arduino, cloud computing, growing, median filtration
1.1 Rationale
The process of ensuring a sustainable diet of the population provides for the uniform introduction of vegetables into the diet throughout the year [1]. Taking into account climatic characteristics of many countries, the production of vegetables during the off-season is possible only in greenhouses, which are complex engineering constructions with the usage of the latest achievements of science and technology. Functional and economic efficiency of growing greenhouse crops depends on the level of digitalization and automation of the greenhouses. A necessary procedure for computerization and automation of greenhouse cultivation processes is obtaining measurement information on microclimate parameters using modern computer-integrated devices. In turn, acidity is one of the most informative indicators, the measurement information of which is used to adjust plant nutritional conditions. The consumption of nutrients by greenhouse crops is largely determined by soil acidity, which depends on the application of fertilizers through the irrigation solution. Low acidity (pH) blocks the consumption of macronutrients by the root system of plants from the soil, and high acidity prevents the absorption of trace elements.
1.2 Analysis and generalization of known results
Contemporary technologies of growing crops in greenhouse conditions are knowledge-intensive and require continuous improvement of hardware-software tools for computer-integrated monitoring and control of microclimate parameters. This fact is confirmed by relevant scientific publications in the field of digitalization and intellectualization of the modern agricultural sector through the introduction of technologies such as Wireless Sensor Networks and Internet of Things [2-5].
Based on the analysis of scientific articles [6-14], it was established that the acidity measuring channel is an indispensable structural unit of monitoring and control systems for technological processes of growing greenhouse plants. Currently, a wide range of scientific papers is devoted to the research and implementation of high-precision microprocessor-based devices for non-destructive online monitoring of acidity in industrial greenhouse complexes. For example, the article [15] substantiates the need for instrumental measurement control of the acidity of the irrigation solution in the range from 3 to 10 units with a total absolute uncertainty of not more than ±0.1 units. The documents [16, 17] systematized the totality of the main sources of uncertainty in measuring acidity using ion-selective electrodes, namely, the unexcluded residues of systematic uncertainty from the destabilizing effect of temperature and competing ions, as well as the random component of the total uncertainty from non-ideality of constructive and circuit solutions of measuring devices and their interaction with controlled physical environment.
Scientific articles [18-22] present main results of laboratory and field tests of developed microprocessor measuring acidity systems based on low-cost component base and modern application software packages for aggregation and processing of measurement information. As the hardware base of the systems, the authors mainly use Arduino microcontrollers and combined glass pH-electrodes of various manufacturers. LabView, Matlab & Simulink, Thinger.io Platform and ThingSpeak are the most widely used for developing graphical interfaces for processing and visualizing monitoring results.
The articles [23-25] show the main features of methods for determining conversion characteristics of acidity measuring tools based on ion-selective electrodes, as well as recommendations for organizing a measurement calibration procedure of pH sensors for maximum accuracy. The main calibration methods for these sensors are single-, double- and multi-point technologies with recording the average value of the measured value and standard deviation, taking into account temperature dependence of the output signal of the acidity meter. So far, the results of studies evaluating the effect of soil acidity and irrigation solution on crop growth performance on protected grounds have been presented [26-30]. In these articles, the authors established the basic laws of the effect of pH on the quality indicators of cultivating various types of greenhouse plants.
The articles Liu et al. [31] and Vovna et al. [32] substantiate the main scientific and practical approaches to assessing metrological characteristics of non-destructive testing using the concept of uncertainty and the error theory. Laktionov et al. [10, 33] and Dar et al. [34] developed the main provisions for planning experimental tests of computerized means for monitoring the greenhouse microclimate.
Thus, the analysis and logical generalization of the existing research results on the development and implementation of computer-integrated acid monitoring systems in greenhouse conditions, allowed establishing that insufficient attention is paid to solving the problems of statistical analysis of metrological characteristics of online pH irrigation monitoring tools. It was also found that in most articles, the authors emphasize the research intensity and relevance of problems in this scientific and technical field. Thus, the scientific and applied problem of the experimental determination of the conversion characteristics of information-measuring systems for monitoring acidity with an integral and differential assessment of their metrological parameters is an urgent theoretical and practical task. The solution of this problem contributes to the justification of objective agricultural practices to increase yields.
1.3 Purpose, object and subject of research
The main purpose of the article is to improve computerized monitoring and control of technological processes of growing greenhouse crops by substantiating a method for increasing the accuracy of computer-integrated devices for measuring irrigation solution acidity by reducing the random component of uncertainty and compensating of the destabilizing effect of temperature. The subject of the study is assessment of the random and non-excluded systematic components of the uncertainty of computerized meters of irrigation solution acidity. The object of the study is random processes and the destabilizing influence of temperature, which have a negative effect on the total uncertainty of measuring the irrigation solution acidity.
1.4 Article structure
Section 2 describes the used research materials, tools and methods, Section 3 explains all scientific and practical findings, Section 4 explains discussion and suggestions for future investigations and Section 5 explains conclusions from the present work.
1.5 Scientific novelty and practical relevance
The scientific novelty of the obtained research results consists in establishing influence patterns of destabilizing factors on the value of the additional component of the uncertainty in measuring acidity in greenhouse conditions, which made it possible to substantiate the choice of a method for increasing the accuracy of non-destructive computerized monitoring of irrigation solution acidity. The practical relevance of the results lies in the development of engineering design and construction methods for measuring the acidity channel of a solution using available components and hardware-software methods for correcting measurement errors in real time operation.
Theoretical studies and laboratory tests on determining the conversion characteristics and estimating the uncertainty of the developed experimental prototype of a computerized acidity meter were carried out in specialized laboratories “Information Measuring Equipment” and “Metrology” of the SHEI “Donetsk National Technical University” (Pokrovsk, Ukraine) using standardized materials and certified measuring instruments and software. These laboratories are equipped with modern control and measuring, sensory, microprocessor, and power equipment, which has certificates of metrological certification [35].
2.1 Hardware components
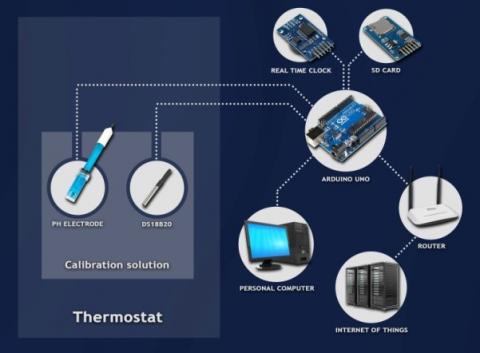
The microprocessor acidity measuring device is based on the Arduino sensor DFRobot V 2.0, with a sensitive element, which is the EC-201 glass combined pH electrode [36]. This model was selected on the basis of satisfactory functional and metrological characteristics in the operating measurement range, as well as hardware and software compatibility with the budget microprocessor platform Arduino Uno. The temperature measuring channel is based on the DS18B20 sensor, which provides the minimum error in the studied temperature range from +5 to +35℃.
The functional unit of aggregation, analog-to-digital conversion, primary digital processing, accumulation and transmission of experimental observations to the cloud server is based on the budget Arduino Uno microprocessor platform with expansion cards for the DS1307 real-time clock module, SD card and Ethernet Shield.
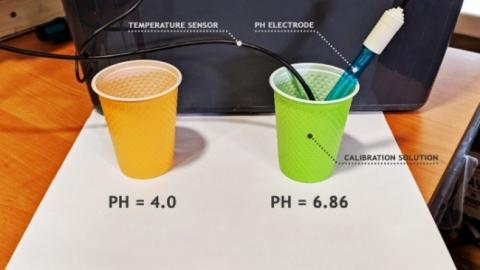
Automatic maintenance of thermostat control points for assessing the sensitivity of the developed acidity meter to the destabilizing temperature factor was carried out using a standardized thermostat with an operating range from 0 to +80℃ with discrete temperature control of 1.0±0.2℃. The developed block diagram of the experimental prototype of a computerized acidity meter is shown in Figure 1, a photo of the implemented laboratory installation is shown in Figure 2.
Figure 1. Block diagram of the meter
Figure 2. Photo of the laboratory installation
Figure 3. Software usage algorithm
2.2 Software
In the process of conducting studies to determine the conversion characteristics and assess the measurement uncertainty of the developed computerized acidity monitoring device, certified software was used, namely: Arduino IDE; MathCAD; MS Excel and ThingSpeak. The sequence of use and functionality of the used application packages is shown in Figure 3.
2.3 Research methodology
Theoretical and experimental studies of the developed computerized acidity meter are obtained based on structural-algorithmic synthesis of information-measuring systems; non-destructive instrumental measuring control methods; methods of mathematical planning of experiments; regression analysis of experimental data and the concept of uncertainty.
Based on the results of preliminary studies of the authors and known a priori information about the object and subject of the study [37], taking into account the condition of minimizing the standard deviation of the observation uncertainty, the need for three series of laboratory tests in the conditions of traceability of measurements was established. As a basic method for assessing the metrological characteristics of the pH measuring device, we used a comparison method with a reference measure (two-point method using calibration solutions with the following values: pHmin(t=25℃)=4.0 units and pHmax(t=25℃)=6.86 units). In the process of laboratory testing and subsequent data processing, the algorithm of compatible measurements with multiple observations of the output voltage of the acidity measuring channel and the output signal temperature channel was used. The time interval for monitoring the output signals of the measuring channels in one group of observations (at constant acidity and temperature) is 6 minutes, the number of points for the specified period is 120. The working range of temperature variation is from +5 to +35℃ at 5.0±0.2℃ intervals.
The theoretical basis for the ion-selective acidity sensor is the Nerst equation:
$E=E_{0}+2.3 \frac{R T}{n F} \lg \left(H^{+}\right)$ (1)
where, E is the measured potential, V; E0 is the standard electrode potential, V; R is the universal gas constant, J/(mol∙K); T is the absolute temperature, K; n is the charge number of the ion; F is the Faraday constant, C/mol.
Based on the analysis of equation (1), it was found that the value of the output voltage of the sensor (Uout) depends on the acidity and temperature of the analyzed medium. Thus, the task of calibrating the implemented microprocessor acidity meter is to determine the particular type of the empirical dependence pH=f(Uout, t) in an analytical form. Detected physical quantities during laboratory testing of the meter are the output voltage of the sensor (Uout) and the temperature of the solution (t).Also during research, there is a need to assess the uncertainty of measuring acidity (pH) from the noise component of fluctuations in the output voltage of the sensor and the destabilizing effect of temperature.
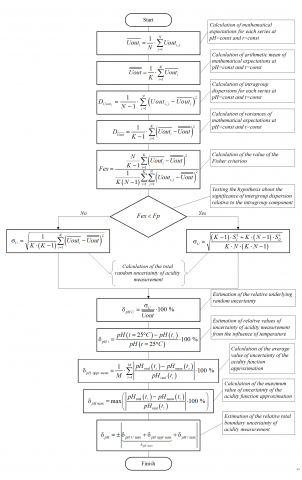
Figure 4. Algorithm for assessing the metrological characteristics of the acidity meter
The adapted method for assessing the quantitative accuracy parameters of the developed measuring system [37-39] is presented in the form of a block diagram of the algorithm in Figure 4, where: Uouti,j– the results of j observations of the sensor output voltages in each of the i series, V; N – the number of observations in each series; $\overline{Uou{{t}_{i}}}$ – expected values of the meter output voltages, V; $\overline{\overline{Uout}}$ – arithmetic mean of the expected output voltages of the meter, V; K – number of groups of observations obtained under the condition of traceability of measurements; ${{D}_{Uou{{t}_{i}}}}$ – intra-group dispersions, V2; ${{D}_{\overline{Uout}}}$ – dispersion of the expected values of the meter output voltage, V2; Fex– the Fisher criterion, dimensionless; Fp– the critical value of the Fisher criterion at confidence coefficient P, dimensionless; σU– the total mean square deviation of the observation results of the meter output voltage, V; SI and SII– independent estimates of the random distribution of observation results, dimensionless; δpHU– the relative basic random uncertainty of measurement of the meter output signal, %; pH(t=25℃)– the value of acidity at the nominal solution temperature (25℃), un.; pH(tz)– the value of acidity within the operating temperature range, un.; δpH t mean– the average value of the relative uncertainty of approximation of the acidity function, %; δpH appr m ax– the critical value of the relative uncertainty of approximation of the acidity function, %; δpH main– the boundary value of the basic uncertainty of acidity measurement, %; pHreal(tz)– the actual value of acidity, un.; pHmeas(tz) – the value of acidity, obtained by measurements with further approximation, un.; tz– the temperature value from the operating range from 5 to 35℃; M – the number of control points from the operating temperature range; δpH U max– the critical value of the main relative uncertainty, %; δpH t max– the critical value of the additional relative uncertainty, %.
The estimation of the components (random and non-excluded systematic residues) of the total uncertainty of the acidity measurement was performed by using the measurement technique with multiple observations. As a result, a sample of experimental data is accumulated, followed by averaging on the basis of the normal law of distribution of random variables [32, 39].
The proposed method allows estimating the average and maximum values of the random and non-excluded systematic components of the uncertainty of the computerized meter of the irrigation solution acidity with the subsequent development of recommendations to improve the accuracy of the implemented measuring device.
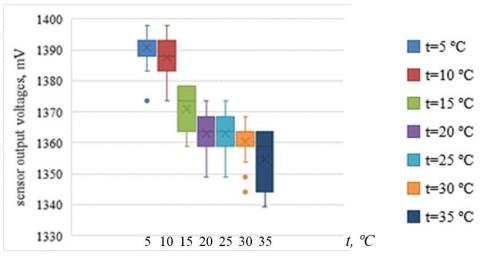
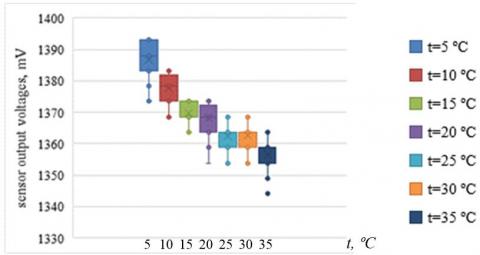
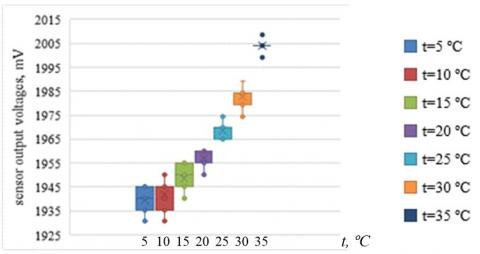
During the laboratory tests of the implemented experimental prototype of the acidity measuring device, three sets of observation results for the nominal acidity values of calibration solutions were obtained, which are presented in Figure 5 – for pHmin(t=25℃)=4.0 units and in Figure 6 – for pHmax(t=25℃)=6.86 units. For graphical interpretation and ergonomic analysis of the test results of the developed tool for measuring acidity, the box plot type of diagram was chosen, which allows depicting a one-dimensional probability distribution. This graph shows the mean, median, probability density, and emission points (statistically insignificant sample values).
a) The first series
b) The second series
c) The third series
Figure 5. Results of the experimental observations of the output voltage of the acidity sensor at pHmin(t=25℃)=4.0 un
a) The first series
b) The second series
c) The third series
Figure 6. Results of the experimental observations of the output voltage of the sensor at pHmax(t=25℃)=6.86 un
The boundary value of the Fisher criterion (FP) is taken to be 3.01 [40] under standard engineering confidence probability P=0.95 under the condition of the number of degrees of freedom of individual values of the intragroup dispersion equal to i·(j–1)=357 and the degrees of freedom of the averaged intragroup dispersion equal to (i–1)=2.
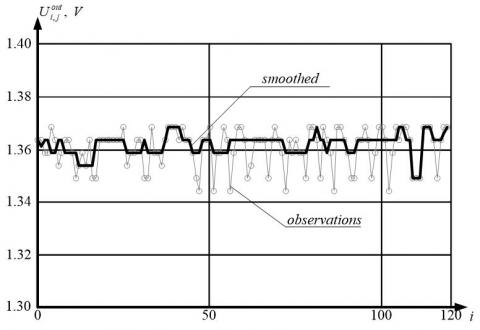
When analyzing the obtained estimates of the metrological characteristics of the random component of the acidity monitoring uncertainty, it was found that its relative value varies in the range from ±0.12 to ±0.28 %. By a qualitative analysis of the obtained results, it was found that this random uncertainty is digital in nature and is due to fluctuations in the reference voltage source of the analog-to-digital converter of the microcontroller unit of the system. In order to reduce it, it is proposed to use the median filtering algorithm [41] with the filter window width (W) equal to 5. This algorithm was selected based on the reliability, simplicity, and automation operational efficiency when using microprocessor-based computing. The parameter (W) was calculated taking into account the criterion of the minimum influence on the speed of the measurement procedure and the shape of the output signal according to the formula [42]:
$W=\frac{q-1}{2}$, (2)
where, W is the window width of the median filter; q is an odd number equal to the maximum number of “outlier” points in experimental observations.
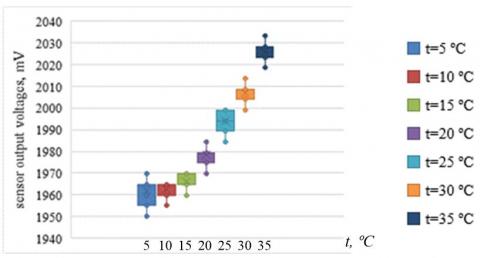
The result of using the median filter to reduce the random component of the uncertainty in measuring acidity is shown in Figure 7 for groups of observations with maximum relative values (δpH U) at pHmin(t=30℃) and pHmax(t=25℃).
Based on quantitative analysis of the results shown in Figure 7, it was found that the use of the median filtering algorithm for the observation results in the software component of the meter allows reducing the random component of the uncertainty in measuring acidity by an average of 2.5 times. Thus, the relative value of the random component of the uncertainty in measuring acidity does not exceed ±0.1%, which satisfies the regulated requirements for these types of measurements. The next research task, according to the proposed algorithm, is estimating the non-excluded residue of systematic uncertainty in measuring acidity (δpHt) from the destabilizing effect of temperature in the operating range from +5 to +35℃. The family of conversion characteristics of the experimental prototype of the acidity meter is shown in Figure 8. By quantitative analysis of the results, which are presented in Figure 8, taking into account the linear dependence of the output voltage of the ion-selective pH sensor on acidity and temperature (1), average sensitivity values were determined.
a) pHmin(t=30℃)
b) pHmax(t=25℃)
Figure 7. Results of median filtering of the observation results
Figure 8. Family of conversion characteristics of the experimental prototype of the acidity meter
The sensitivity of the sensor to an informative acidity parameter was found at a standard temperature of 25℃ according to the formula:
$S_{p H}^{U}=\frac{U_{\max }-U_{\min }}{p H_{\max }-p H_{\min }}=\frac{2002-1362}{6.86-4}=223.8 \mathrm{mV} / \mathrm{un}$., (3)
where, SU pH is the sensitivity of the sensor to changes in acidity, mV/un.; Umax, Umin are the maximum and minimum output voltage values of the sensor in the operating range, mV; pHmax, pHmin are the maximum and minimum acidity values in the operating range, un.
The sensitivity of the sensor to the destabilizing temperature factor was found at the maximum distance from the isopotential point by the formula:
$S_{t}^{U}=\frac{U_{\max }-U_{\min }}{t_{\max }-t_{\min }}=\frac{2019-1959}{35-5}=2 \mathrm{mV} /{ }^{\circ} \mathrm{C}$, (4)
where, $S_{t}^{U}$ is the sensitivity of the sensor to temperature changes, mV/℃; Umax, Umin are the maximum and minimum output voltage values of the sensor in the operating temperature range, mV; tmax, tmin are the maximum and minimum temperature values in the operating range, ℃.
A particular form of the linear calibration equation pH25=f(Uout) was obtained by approximating the graphical dependence of Figure 8 at a standard temperature of 25℃:
$p H_{25}=4.469 \cdot U_{o u t}-2.086$, (5)
where, pH25 is the result of measuring acidity at the nominal temperature, un.; Uout is the output voltage of the acidity meter, V.
To take into account the temperature effect on the result of measuring acidity, it is proposed to use the linear equation pHt=ψ(pH25, t) for reducing acidity to the standard temperature:
$p H_{t}=p H_{25}\left(1+\alpha_{t}(t-25)\right)$, (6)
where, pHt is the result of measuring acidity at temperature t, un.; pH25 is the result of measuring acidity at the nominal temperature, un.; t is the current temperature, ℃; αt is the temperature coefficient of acidity, 1/℃.
The temperature coefficient of acidity (αt) is calculated by the formula:
$\alpha_{t}=\frac{p H_{\max }-p H_{\min }}{p H_{\min }\left(t_{\max }-t_{\min }\right)}=\frac{4.02-4}{4(35-5)}=0.17 \cdot 10^{-3} 1 /{ }^{\circ} \mathrm{C}$, (7)
where, pHmax, pHmin are the maximum and minimum acidity values of the calibration solution, un.; tmax, tmin are the maximum and minimum temperature values in the operating range, ℃.
Thus, based on calculations by formulas (3) – (7), the overall calibration equation pHUout,t=φ(Uout,t) for the implemented microprocessor acidity meter has the following form:
$p H_{U_{\text {out}}, t}=\left(4.469 \cdot U_{\text {out}}-2.086\right)\left(1+0.17 \cdot 10^{-3}(t-25)\right)$. (8)
The Eq. (8) is the mathematical basis of the system software component for calculating the result of measuring acidity (pH) by monitoring the output voltage of the acidity sensor (Uout) and the temperature (t).
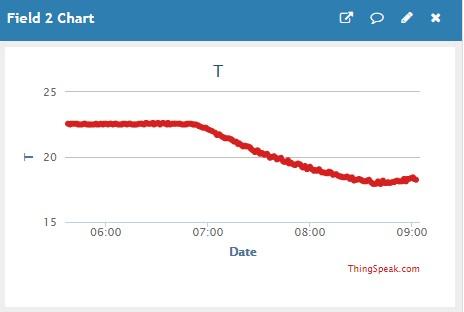
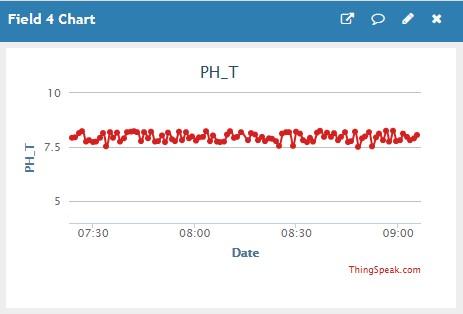
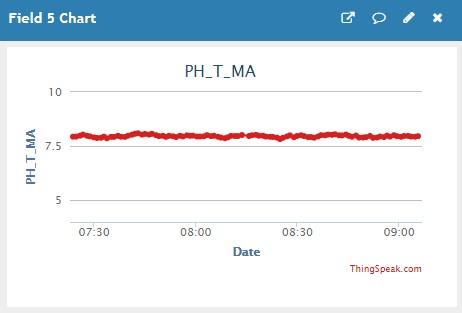
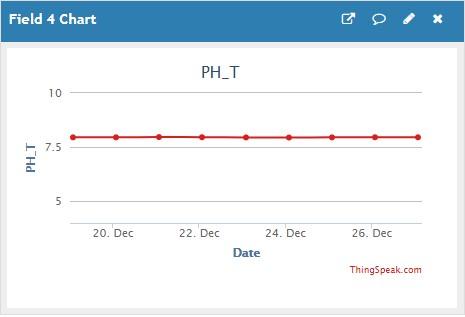
The results of laboratory tests of the implemented experimental prototype of the computerized acidity measuring device using the ThingSpeak IoT service are presented in Figure 9 – a short-term study (the number of points 200 – 3.5 hours) and in Figure 10 – a long-term study (average values over 9 days).
The actual value of the measured value during laboratory testing of the meter is 7.9 pH at the temperature of 25℃.
a) Sensor output voltage
b) Temperature
c) Measured pH value
d) Measured pH after median filtration
Figure 9. Results of the short-term experimental studies of the developed acidity meter
a) Sensor output voltage
b) Temperature
c) Measured pH value
d) Measured pH after median filtration
Figure 10. Results of the long-term experimental studies of the developed acidity meter
Based on statistical analysis of the obtained data (see Figure 9), according to the methodology proposed in Figure 4, the components of the uncertainty of measuring acidity by the implemented computerized device of measurement monitoring were evaluated: the maximum value of the basic uncertainty of the acidity measurement (δpH main), which takes into account simultaneous contribution of the noise (δpH U max) and approximation (δpH appr max) components of the uncertainty (see Figure 9b, d and 10b, d), is ±0.9%; the maximum value of the additional uncertainty of the acidity measurement(δpH t max) from the destabilizing effect of the temperature (see Figures 9c and 10c) is ±0.23%; the total boundary uncertainty of the acidity measurement (δpH) is ±1.1%. The proposed method and means of measuring non-destructive acidity control in greenhouse conditions satisfy the regulated requirements by taking into account and correcting the negative influence of destabilizing factors on the measurement result in real time operation. Also, the development is ergonomic due to the visualization of measurement results on a cloud server, which corresponds to modern international trends in the development of information-measuring equipment.
Thus, the proposed research engineering solution of the computerized device of acidity measurement monitoring has satisfactory metrological characteristics and belongs to an affordable price category (see Table 1).
The results of an a priori analysis of the economic costs of equipment suggest that the developed device is 10-15% cheaper than similar ones, provided that the regulated requirements for metrological and functional characteristics for these types of measurements are met. This result was achieved by using the budget component base with software correction of the results.
Table 1. Pricelist of the components of the developed device (January 2020)
|
Components |
Price, $ |
|
Arduino Uno SMD Rev3 |
29.1 |
|
SD-card shield |
4.2 |
|
Real Time Clock shield |
1.5 |
|
W5100 ethernet shield |
8.1 |
|
pH-meter DFRobot |
44.3 |
|
Sensor DS18B20 |
4.5 |
|
Total |
91.7 |
Based on the conducted research, it is proposed to introduce the developed computer-integrated online acidity monitoring device in greenhouses of various ownership forms.
The scientific novelty of the research results presented in this article is to substantiate the method of non-destructive computer-based online monitoring of acidity under greenhouse conditions with the regulated metrological characteristics. The practical significance of the development lies in the hardware and software implementation of the measuring device for acidity monitoring on the low-cost component basis and modern communication technologies.
Promising areas of research for the developed computerized device for acidity measurement monitoring in greenhouse conditions are adaptation of the hardware-software implementation of the meter to the types and periods of vegetation of crops grown; assessment of the dynamic component of the measurement error of acidity and reliability parameters of the developed meter; forecasting the investment attractiveness of introducing the developed measuring device in the conditions of industrial greenhouse complexes.
The article presents the research results on improving computerized monitoring and control of technological processes of growing greenhouse crops by substantiating the method of improving the accuracy of the computer-integrated device of measuring the irrigation solution acidity. The main results are:
|
E |
measured potential |
|
E0 |
standard electrode potential |
|
R |
universal gas constant |
|
T |
absolute temperature |
|
n |
ion charge |
|
F |
Faraday constant |
|
pH |
acidity |
|
pH25 |
acidity measurement result at a nominal temperature |
|
Uouti,j |
the results of j observations of the sensor output voltages in each of the i series |
|
N |
the number of observations in each series |
|
$\overline{Uou{{t}_{i}}}$ |
expected values of the meter output voltages |
|
$\overline{\overline{Uout}}$ |
arithmetic mean of the expected output voltages of the meter |
|
K |
number of groups of observations obtained under the condition of traceability of measurements |
|
${{D}_{Uou{{t}_{i}}}}$ |
intra-group dispersions |
|
${{D}_{\overline{Uout}}}$ |
dispersion of the expected values of the meter output voltage |
|
Fex |
the Fisher criterion |
|
Fp |
the critical value of the Fisher criterion at confidence coefficient P |
|
SI, SII |
independent estimates of the random distribution of observation results |
|
tz |
the temperature value from the operating range |
|
M |
number of control points from the operating temperature range |
|
$S_{pH}^{U}$ |
sensor sensitivity to acidity changes |
|
$S_{t}^{U}$ |
temperature sensitivity of the sensor |
|
Umax, Umin |
maximum and minimum sensor output voltage in the operating range |
|
Greek symbols |
|
|
${{\sigma }_{U}}$ |
the total mean square deviation of the observation results of the meter output voltage |
|
δpHU |
the relative basic random uncertainty of measurement of the meter output signal |
|
δpH t mean |
the average value of the relative uncertainty of approximation of the acidity function |
|
δpH appr max |
the critical value of the relative uncertainty of approximation of the acidity function |
|
δpH U max |
the critical value of the main relative uncertainty of measurement of acidity |
|
δpH t max |
the critical value of the additional relative uncertainty of measurement of acidity |
|
δpH main |
boundary value of the basic uncertainty of acidity measurement |
|
αt |
temperature coefficient of acidity |
[1] FAO. http://www.fao.org/nutrition/education/food-dietary-guidelines/background/sustainable-dietary-guidelines/en/, accessed on Jan. 21, 2020.
[2] Caicedo-Ortiz, J.G., De-la-Hoz-Franco, E., Ortega, R.M., Pineres-Espitia, G., Combita-Nino, H., Estevez, F., Cama-Pinto, A. (2018). Monitoring system for agronomic variables based in WSN technology on cassava crops. Computers and Electronics in Agriculture, 145: 275-281. https://doi.org/10.1016/j.compag.2018.01.004
[3] Ojha, T., Misra, S., Raghuwanshi, N.S. (2015). Wireless sensor networks for agriculture: The state-of-the-art in practice and future challenges. Computers and Electronics in Agriculture, 118: 66-84. https://doi.org/10.1016/j.compag.2015.08.011
[4] Kochhar, A., Kumar, N. (2019). Wireless sensor networks for greenhouses: An end-to-end review. Computers and Electronics in Agriculture, 163: 104877. https://doi.org/10.1016/j.compag.2019.104877
[5] Dobrescu, R., Merezeanu, D., Mocanu, S. (2019). Context-aware control and monitoring system with IoT and cloud support. Computers and Electronics in Agriculture, 160: 91-99. https://doi.org/10.1016/j.compag.2019.03.005
[6] Saaid, M.F., Sanuddin, A., Ali, M., Yassin, M.S.A.I.M. (2015). Automated pH controller system for hydroponic cultivation. In: 2015 IEEE Symposium on Computer Applications & Industrial Electronics (ISCAIE), Langkawi, Malaysia, pp. 186-190. https://doi.org/10.1109/ISCAIE.2015.7298353
[7] Palate, A., Altamirano, S., Manzano, S., Escobar, A., Pallo, J.P. (2015). Electronic system for the volcanic ashes detection and farming's protection. In: 2015 CHILEAN Conference on Electrical, Electronics Engineering, Information and Communication Technologies (CHILECON), Santiago, Chile, pp. 751-755. https://doi.org/10.1109/Chilecon.2015.7404656
[8] Li, J.J. (2017). Design and realization of greenhouse sensor intelligent management system based on internet of things. International Journal of Online and Biomedical Engineering, 13(5): 80-96. https://doi.org/10.3991/ijoe.v13i05.7051
[9] Laktionov, I., Vovna, O., Zori, A. (2017). Copncept of low cost computerized measuring system for microclimate parameters of greenhouses. Bulg. Journal of Agricultural Science, 23(4): 668-673. https://www.agrojournal.org/23/04-24.html.
[10] Laktionov, I.S., Vovna, O.V., Zori, A.A. (2017). Planning of remote experimental research on effects of greenhouse microclimate parameters on vegetable crop-producing. International Journal on Smart Sensing and Intelligent Systems, 10(4): 845-862. https://doi.org/10.21307/ijssis-2018-021
[11] Laktionov, I.S., Vovna, O.V., Bashkov, Y.O., Zori, A.A., Lebediev, V.A. (2019). Improved computer-oriented method for processing of measurement information on greenhouse microclimate. International Journal Bioautomation, 23(1): 71-86. https://doi.org/10.7546/ijba.2019.23.1.71-86
[12] Laktionov, I.S., Vovna, O.V., Zori, A.A., Lebediev, V.A. (2018). Results of simulation and physical modeling of the computerized monitoring and control system for greenhouse microclimate parameters. International Journal on Smart Sensing and Intelligent Systems, 11(1): 1-15. https://doi.org/10.21307/ijssis-2018-017
[13] Alasco, R., Domdoma, E.A., Doria, K.A., Ricafranca, K.M., Saito, Y.E., Arago, N., Reyes, R., Galido, E. (2018). SoilMATTic: Arduino-based automated soil nutrient and pH level analyzer using digital image processing and artificial neural network. In: 2018 IEEE 10th International Conference on Humanoid, Nanotechnology, Information Technology, Communication and Control, Environment and Management (HNICEM), Baguio, Philippines, pp. 1-15. https://doi.org/10.1109/HNICEM.2018.8666264
[14] Schirrmann, M., Gebbers, R., Kramer, E., Seidel, J. (2011). Soil pH mapping with an on-the-go sensor. Sensors, 11(1): 573-598. https://doi.org/10.3390/s110100573
[15] Both, A.J., Benjamin, L., Franklin, J., Holroyd, G., Incoll, L.D., Lefsrud, M.G., Pitkin, G. (2015). Guidelines for measuring and reporting environmental parameters for experiments in greenhouses. Plant Methods, 11: 1-18. http://doi.org/10.1186/s13007-015-0083-5
[16] Surat, P. Factors Affecting pH Meter Accuracy. https://www.news-medical.net/life-sciences/Factors-Affecting-pH-Meter-Accuracy.aspx, accessed on December 29, 2019.
[17] Tan, C.Y., Ding, K., Yang, W.C., Seyfried, W.E. (2016). Accurate pH measurement and determination in deep-sea environments by an in-situ pH sensor calibration device. In: OCEANS 2016 - Shanghai, China, pp. 1-5. https://doi.org/10.1109/OCEANSAP.2016.7485352
[18] Moparthi, N.R., Mukesh, C., Vidya Sagar, P. (2018). Water quality monitoring system using IOT. In: 2018 Fourth International Conference on Advances in Electrical, Electronics, Information, Communication and Bio-Informatics (AEEICB), Tamilnadu, India, pp. 1-5. https://doi.org/10.1109/AEEICB.2018.8480963
[19] Taru, Y.K., Karwankar, A. (2017). Water monitoring system using arduino with labview. In: 2017 International Conference on Computing Methodologies and Communication (ICCMC), Erode, India, pp. 416-419. http://doi.org/10.1109/ICCMC.2017.8282722
[20] Vajpayee, S., Kumar, B., Thakur, R., Kumar, M. (2017). Design and development of nano pH sensor and interfacing with arduino. International Journal of Electronics, Electrical and Computational System, 6(4): 67-75.
[21] Wiora, A., Wiora, J. (2018). Over one-year long-term laboratory tests of ph electrodes in terms of industrial applications checking stabilities of their parameters and their influence on uncertainties of measurements. Sensors, 18(12): 1-19. https://doi.org/10.3390/s18124102
[22] Lavanaya, M., Parameswari, R. (2018). Soil nutrients monitoring for greenhouse yield enhancement using Ph value with lot and wireless sensor network. In: 2018 Second International Conference on Green Computing and Internet of Things (ICGCIoT), Karnataka, India, pp. 547-552. https://doi.org/10.1109/ICGCIoT.2018.8753083
[23] Naumann, R., Alexander-Weber, Ch., Eberhardt, R., Giera, J., Spitzer, P. (2002). Traceability of pH measurements by glass electrode cells: performance characteristic of pH electrodes by multi-point calibration. Analytical and Bioanalytical Chemistry, 374: 778-786. https://doi.org/10.1007/s00216-002-1506-5
[24] Neto Alberto, F., Lanchote, A., Lavrador, M.A.S. (2009). A simple protocol for the routine calibration of pH meters. Journal of Basic and Applied Pharmaceutical Sciences, 27(1): 63-72.
[25] Cheng, K.L., Da-Ming, Z. (2005). On calibration of pH meters. Sensors, 5(4): 209-219. https://doi.org/10.3390/s5040209
[26] Gentili, R., Ambrosini, R., Montagnani, C., Caronni, S., Citterio, S. (2018). Effect of soil pH on the growth, reproductive investment and pollen allergenicity of ambrosia artemisiifolia L. Frontiers in Plant Science, 9: 1-12. https://doi.org/10.3389/fpls.2018.01335
[27] Roosta, H.R., Rezaei, I. (2014). Effect of nutrient solution PH on the vegetative and reproductive growth and physiological characteristics of rose Cv. ‘Grand Gala’ in hydroponic system. Journal of Plant Nutrition, 37(13): 2179-2194. https://doi.org/10.1080/01904167.2014.920377
[28] Carrasquilla-Batista, A., Chacon-Rodriguez, A., Solorzano-Quintana, M. (2016). Using IoT resources to enhance the accuracy of overdrain measurements in greenhouse horticulture. In: 2016 IEEE 36th Central American and Panama Convention (CONCAPAN XXXVI), San Jose, Costa Rica, pp. 1-5. https://doi.org/10.1109/CONCAPAN.2016.7942345
[29] Kim, H.J., Cho, Y.S., Kwon, O.K., Cho, M.W., Hwang, J.B., Jeon, W.T., Bae, S.D. (2005). Effect of hydroponic solution pH on the growth of greenhouse rose. Asian Journal of Plant Sciences, 4(1): 17-22. https://doi.org/10.3923/ajps.2005.17.22
[30] Tyson, R.V., Simonne, E.H., Treadwell, D.D., Davis, M., White, J.M. (2008). Effect of water pH on yield and nutritional status of greenhouse cucumber grown in recirculating hydroponics. Journal of Plant Nutrition, 31(11): 2018-2030. https://doi.org/10.1080/01904160802405412
[31] Liu, G., Guo, L., Liu, C., Wu, Q. (2018). Uncertainty propagation in the calibration equations for NTC thermistors. Metrologia, 55: 437-445. https://doi.org/10.1088/1681-7575/aaba8e
[32] Vovna, O.V., Laktionov, I.S, Koyfman, O.O., Stashkevych, I.I., Lebediev, V.A. (2020). Study of metrological characteristics of low-cost digital temperature sensors for greenhouse conditions. Serbian Journal of Electrical Engineering, 17(1): 1-20. https://doi.org/10.2298/SJEE2001001V
[33] Laktionov, I.S., Vovna, O.V., Bondarenko, V.I., Zori, A.A., Lebediev, V.A. (2020). Rationale for the structural organization of a computerized monitoring and control system for greenhouse microclimate using the scale transformation method. International Journal BIO Automation, 24(1): 51-64. https://doi.org/10.7546/ijba.2020.24.1.000612
[34] Dar, A.A., Anuradha, N., Afzal, S. (2018). Design of experiment onprobability of default (PD). International Journal of Pure and Applied Mathematics, 118(10): 303-315. https://doi.org/10.12732/ijpam.v118i10.33
[35] DonNTU. https://donntu.edu.ua/kitaer/et#pll_switcher, accessed on Jan. 12, 2020.
[36] DFRobot. https://wiki.dfrobot.com/[online], accessed on Jan. 10, 2020.
[37] Vovna, O.V., Laktionov, I.S., Dobrovolska, L.O., Kabanets, M.M., Lebediev, V.A. (2019). Evaluation of metrological characteristics of a computerized conductivity meter of irrigation solution based on the uncertainty theory. Journal Européen des Systèmes Automatisés, 52(4): 333-340. https://doi.org/10.18280/jesa.520401
[38] Vovna, O, Laktionov, I., Andrieieva, A., Petelin, E., Shtepa, O., Laktionova, H. (2019). Optimized calibration method for analog parametric temperature sensors. Instrumentation Mesure Métrologie, 18(6): 517-526. https://doi.org/10.18280/i2m.180602
[39] Matula, S., Bat’kova, K., Legese, W.L. (2016). Laboratory performance of five selected soil moisture sensors applying factory and own calibration equations for two soil media of different bulk density and salinity levels. Sensors, 16(11): 1-22. https://doi.org/10.3390/s16111912
[40] Analysis of Variance – ANOVA [online]. http://isoconsultantpune.com/analysis-of-variance-anova/, accessed on Jan. 14, 2020.
[41] Egert-McLean, A.M., Sama, M.P., Klotz, J.L., McLeod, K.R., Kristensen, N.B., Harmon, D.L. (2019). Automated system for characterizing short-term feeding behavior and real-time forestomach motility in cattle. Computers and Electronics in Agriculture, 167: 105037. https://doi.org/10.1016/j.compag.2019.105037
[42] Chanu, R., Singh, K.M., (2016). Vector Median Filters: A Survey. International Journal of Computer Science and Network Security, 16(12): 66-82.