Small But Powerful Optically: Glass Microcapillaries for Studying Complex Fluids or Biological Systems with Submicrolitre Samples under Harsh Conditions
Petits Mais Puissants Optiquement: les Microcapillaires de Verre pour l'Etude en Conditions Sévères de Fluides ou Systèmes Biologiques Complexes en Quantités Inférieures au Microlitre

Kedi Zhou | Patrick Bouriat | Nelly Hobeika | Abdelhafid Touil | Anthony Ranchou-Peyruse | Daniel Broseta* | Ross Brown
© 2020 IIETA. This article is published by IIETA and is licensed under the CC BY 4.0 license (http://creativecommons.org/licenses/by/4.0/).
OPEN ACCESS
Glass micro-capillaries are the simplest yet most versatile, robust, practical and cheap microfluidic devices. Their small size and high optical quality favour detailed investigation under the optical microscope. Here we first review some of their applications, such as determining contact angles and the observation of tenuous wetting films under harsh conditions of pressure and temperature. We further explore how an optical cusp formed by reflection off the inner wall of a glass capillary may be used to monitor the refractive index of its fluid content. Finally, we illustrate how the above advantages may be put to use in the study of extremophile microorganisms, for example in recreating under the microscope the conditions prevailing on the ocean floors.
RÉSUMÉ :
Les microcapillaires de verre sont les outils microfluidiques les plus simples, et néanmoins ils sont polyvalents, robustes et bon marché. Leur petite taille et grande qualité optique favorisent leur utilisation sous le microscope optique. Nous passons en revue quelques unes de leurs applications, comme la détermination d'angles de contact et l'observation de films de mouillage en conditions sévères de pression et température. Nous explorons ensuite comment la caustique formée par réflexion sur la paroi interne du capillaire est reliée à l'indice de réfraction du contenu fluide. Finalement, nous illustrons comment ces avantages peuvent servir à l'étude d'organismes extrémophiles, par exemple en recréant sous le microscope les conditions des fonds océaniques.
glass capillary, microfluidics, thin films, contact angle, extremophiles, optical microscopy, high pressure, refractive index
Mots-clés :
capillaire de verre, microfluidique, films minces, angles de contact, extremophiles, microscopie optique, haute pression, indice de réfraction
A constant trend in soft matter physics, geosciences, chemistry and biology is to miniaturize the experimental systems. This trend serves both practical and fundamental purposes, such as the possibility of quickly screening a large number of conditions with a limited amount of material, or the simultaneous visualization of phenomena while measuring some properties of interest.
Some of these miniaturized systems are worth being cited: (i) microfluidic devices, (ii) micromodels and (iii) fluid inclusions in rocks. (i) Microfluidic devices allow the manipulation of very small fluid volumes (below the µl) while observing under the microscope and carrying out other measurements, using, e.g., spectroscopic or micro-analytical techniques. As an example, droplet-based microfluidics, in which a train of many identical drops of one fluid in another, immiscible fluid wetting the capillary walls, has allowed considerable progress in the understanding of crystal formation and growth, starting with nucleation and habit selection [1]. (ii) Micromodels, or 2D realizations of porous media, provide since the early 80’s invaluable insights into two-phase flows in porous media, particularly into the drainage and imbibition processes [2]. (iii) Fluid inclusions in rocks are µm-sized cavities filled with the fluids present when trapping occurred, millions of years ago. The characterization of these fluids by optical microscopy, microthermometry and spectroscopic methods such as Raman spectroscopy, provides such insights into the geo-history of rock-bearing fluids, that it is now routinely employed in oil and gas exploration. Roedder, a pioneer of fluid inclusion studies, recommended the selection (when possible) within the rock sample of tubular inclusions for easier observation and interpretation [3].
One important unit in all the above systems and tools is in fact the (often) cylindrical channel or cavity and its content, typically observed by means of an optical microscope. The observations by optical microscopy of round capillaries and their content have however most often been qualitative because of distortion effects due to the refraction and of more or less brilliant reflections of light rays on the channel or cavity walls. To the best of our knowledge, the only quantitative measurements of fluid properties that have been attempted are those of fluid volume or density under a gas pressure, inferred from the position of the water/gas meniscus at its pole, and those of gas (e.g., CH4, CO2) composition in a fluid (e.g., water) by Raman microspectrometry, as well as the diffusion coefficients of some gases in water and the swelling of oil by gas [4-10]. In this paper, we present some novel uses of cylindrical glass capillaries with an optical microscope to determine other important features of complex fluids or biological systems: the contact angle on glass of two immiscible phases, the presence and creeping of a thin film on the inner wall, the refractive index of the fluid content and the behavior of microorganisms under controlled temperature, pressure or composition of the aqueous phase mimicking in-situ conditions.
In addition to their ease of manipulation (e.g., for loading liquids), low cost and availability in a large range of lengths, internal and external diameters (from the mm to the µm or even less for some biomedical applications), glass (borosilicate or fused silica) capillaries can have their wettability adjusted, e.g., by plasma treatment or silane chemistry. Dedicated heating-cooling microscope and spectrometer stages are becoming commercially available allowing the capillary to slide along its axis and its position adjusted in the perpendicular direction, while pressure is controlled by connecting one end of the capillary to a high-pressure pump loaded with gas, the other side being sealed. The range of accessible temperatures and pressures is astonishing: temperatures up to 300°C, and pressures up to 120 MPa have been reported in the literature [5]. It is worth mentioning here that, because of the very small sample dimensions, thermal equilibrium following a temperature change in a heating-cooling stage is almost instantaneous, and mass transfer processes are much more rapid than in conventional (i.e., large-size) vessels.
We pause here to underline the surprising strength of glass capillaries. A simple order of magnitude estimate of the bursting pressure compares the stress across an axial section of the wall to the forces generated by the pressure in the bore. The theoretical bursting pressure scales as:
$P_{l i m}=\left(\frac{\sigma_{g}}{\alpha}\right)\left(\frac{R_{e}}{R_{i}}-1\right)$ (1)
where, Ri and Re are the internal and external radii of the capillary, $\sigma_{g}$ the tensile strength of glass and $\alpha$ a safety factor, often taken in the range 2-5. The tensile strength of glass depends on not only the composition, but also the size, smaller sizes being stronger; and on the surface condition, such as the presence of scratches, which are detrimental. Values in the literature are in the range 70 MPa for bulk borosilicate glass, and to 200 MPa for fine fibres, yielding theoretical limiting pressures of the order of hundreds of bars. In our experiments, we apply pressure to the capillary by gluing it into a high-pressure steel tubing itself connected to a high-pressure needle valve. It is nearly always the glue which fails before the glass. The small volume of gas involved is an additional advantage for safety, particularly if care is taken to open valves only just as much as necessary, thus choking the gas flow in case of bursting. As with all high-pressure experiments, potential users should nonetheless consult their laboratory safety officers before undertaking experiments.
The outline is as follows. We show in the next section how to handle refraction effects to measure the true contact angle from a micrograph of a meniscus and detect ultra-thin films creeping on the inner wall of the capillary, provided the ratio of the internal to external diameters of the capillary is appropriately chosen. Then, in the following section, we focus on the determination of the fluids’ refractive index. The last section is devoted to the observation of extremophilic microorganisms under high pressure.
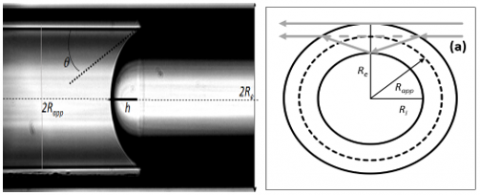
Aligned perpendicular to the optical axis and viewed in collimated transmitted light under the optical microscope, the round capillary features (see Figure 1) an apparent internal diameter (2Rapp) larger than its real diameter ID=2Ri, while the outer diameter of the capillary, OD=2Re, is truly rendered. This is an effect of refraction, which can be accounted for by considering (Figure 1) the light rays reflected on the inner wall on the median section, after and before being refracted on the outer wall at symmetrical positions along the vertical direction (see next section for a discussion on this approximation). A simple calculation [11, 12] shows that Ri can be inferred from the measured values Rapp and Re using the simple formula
$\frac{R_{i}}{R_{e}}=\frac{R_{a p p} / R_{e}}{n_{g} \sqrt{I-\left(R_{a p p} / R_{e}\right)^{2}} \sqrt{I-\left(R_{i} / R_{e}\right)^{2} / n_{g}^{2}}+\left(R_{a p p} / R_{e}\right)^{2}}$ (2)
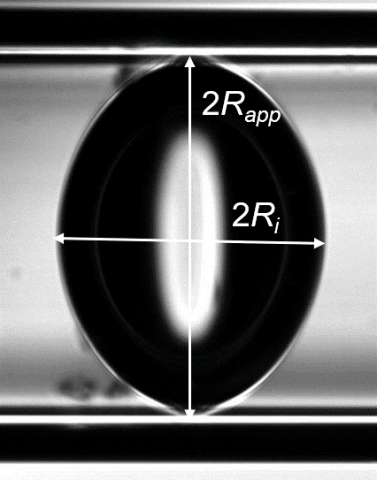
where, ng is the glass refractive index relative to that of the ambient medium (ng =1.46 for fused silica or “quartz” relative to air). A plot of Rapp/Re as a function of Ri/Re thus shows [12] that thin-walled capillaries appear thinner than they are in reality (Rapp/Re closer to 1 than Ri/Re). Because of refraction effects, bubbles or droplets do not look like spheres, as illustrated in Figure 2, where the ratio of the larger to smaller dimensions is nothing but Rapp/Ri. The dimension Ri along the capillary axis is not altered by refraction, unlike Rapp, that in the perpendicular direction (Rapp > Ri).
Another consequence of refraction is that the contact angle of two immiscible fluids on the glass is not obtained by drawing the tangent to the meniscus at the contact line and measuring its angle with the inner wall (see Figure 1), like in conventional contact angle goniometry. This angle can, however, be inferred from the height h of the meniscus, which is measured directly (without distortion) on micrographs of the meniscus, and from the internal radius Ri (itself related to the measured Rapp and Re, see Eq. (2)), as follows:
$\tan (\theta)=\left(R_{i}^{2}-h^{2}\right) / 2 R_{i} h$ (3)
This method has recently been used in our laboratory for evaluating the wettability of bare (water-wet) and silane-treated (CO2-wet) silica in a large range of temperatures (up to 205°C), pressures (up to 60 MPa) and brine salinities representative of CO2 geological storage conditions [12].
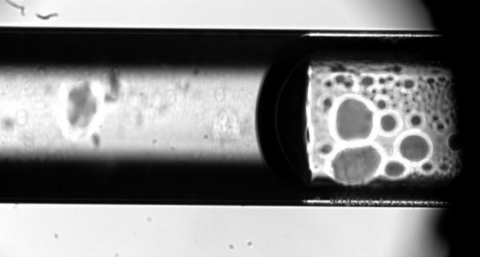
The micrograph in Figure 1 also shows that the refractive index of the fluid in the capillary bore has an effect on the brightness of the inner wall: this interface is not visible when this refractive index, nf , is close to that of glass ng, which is the case of cyclopentane (nf=1.41), and very bright when there is total internal reflection, i.e., for low enough nf, as illustrated with water (nf=1.33). This reflection is referred to here as a cusp, whose brightness thus depends on the refractive index nf: this was the starting point of our attempts to measure nf, which are developed in the next section. The simplest modeling scheme [12] is depicted in Figure 1. The brightness of the inner wall is maximum when the rays labeled (a) in Figure 1 are totally reflected off the inner wall, i.e., their angle to the normal is above the limiting value, or nf is below a limit, nfl, that depends only on ng and the aspect ratio Ri/Re:
$n_{f l}=\sin ^{-1}\left(n_{f} / n_{g}\right)$ (4)
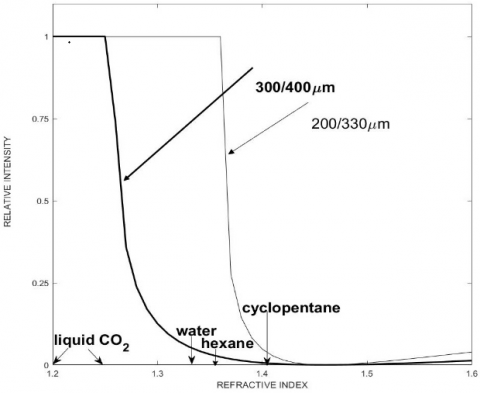
This limit is equal to 1.36 and 1.26 for the fused silica (ng=1.46) capillaries with aspect ratio ID/OD=200µm/330µm (Figures 1, 2, 4 and 8) and 300µm/400µm (Figure 5), respectively. For refractive indices nf above this limit, the Fresnel relations predict a very rapid decrease of the reflected intensity, down to 0 where nf =ng (see Figure 3).
Under conditions of total internal reflection (nf <nfl), light is fully reflected and not transmitted in the fluid, except under the form of an evanescent field, whose intensity decays away from the interface with a characteristic length scale, the penetration depth. This depth is of the order of the wavelength of light l, except when nf approaches nfl: it then increases as lC(nfl-nf)-1/2, where C is a numerical constant in the range of 0.05 [12].
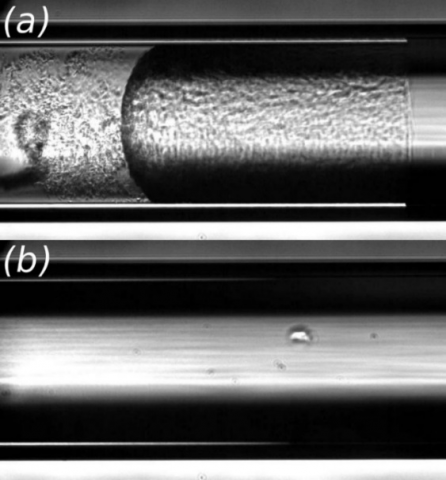
This last feature can be exploited to very sensitively detect thin layers with thicknesses commensurate with l creeping on the inner wall initially facing a liquid with an index close to that of the wall – i.e., the inner wall is initially invisible. An example is that of a few-µm-thick polycrystalline crust of cyclopentane hydrate (with refractive index of about of 1.35) creeping over the glass, where it displaces the cyclopentane initially present [12, 13]. This crust nucleates and grows on the meniscus between water and a guest phase (here, cyclopentane) when the thermodynamic conditions are met (a temperature below 7°C), and then continues its growth beyond the contact line on glass, on the guest side of the meniscus, fed by an equally tenuous water film between the hydrate and the substrate [12, 13]. In the example shown in Figure 4b and 8a, the hydrate crust becomes so thin and smooth after traveling a few hundreds of µm from the meniscus that it is no longer visible in the transmission image, but still apparent from the bright reflection on the inner wall. The dimming of this reflection in the growth direction indicates that the crust thickness tapers and becomes of the order of the penetration length towards the front. Note that an appropriate choice of capillary dimensions is required: it would not have been possible to obtain these results with a glass capillary with dimensions 300µm/400µm (Figure 5). Similar features have recently been observed with CO2 and N2 hydrates [14].
Figure 1. Left: Transmission micrograph of a glass capillary with ID/OD=200µm/330µm filled with water (left) and cyclopentane (right). The apparent ID is 2Rapp~272 µm. Right: cross-section of the capillary, with rays arriving from infinity (a) being reflected off the inner wall on the horizontal median section of the capillary, after and before being refracted on the outer wall
Figure 2. CO2 bubble in pure water spanning the internal diameter of a cylindrical capillary with ID/OD=200µm/330µm
Figure 3. The expected brightness of the inner wall (inner cusp) falls off fast with increasing "refractive index of the fluid content, in a simple calculation tracing only the reflection off the inner wall at the median plane, two different ratios ID/OD are considered
Figure 4. Using the contrast of inner cusp to highlight the growth of thin films: (a) growth of a thin but visible film of cyclopentane hydrate, initiated at the water-cyclopentane meniscus on the left at -4℃; (b) ~100 s later: although the hydrate film is tenuous to the point of invisibility in the transmission image, the inner cusp shows clearly its progression to the right and thinning ([12])
Figure 5. Transmission micrograph of a glass capillary (ID/OD=300µm/400µm) filled with water (left) and CO2 (right) showing the difference of brightness due to reflection off the inner wall. Pressure: 10 MPa
The refractive index in the visible range of the electromagnetic spectrum, dependent on the density and mobility electrons in a medium, is a useful experimental parameter for characterizing gases, liquids and solutions, e.g., electronic absorption is typically in the UV-visible region, leading to wavelength dependence. There are thus many methods of measuring refractive index, using, for example, geometrical optics and Snell's laws or wave optics [15-17].
The observations and calculations of the brightness of the inner wall reported above suggest a novel method for measuring the index of fluids in thin glass capillaries, which combines small volume, high chemical resistance, resistance to pressure and a wide range of temperatures. Here we explore this method, showing under what conditions it may work.
The approach consists in exploiting the brightness of the inner cusp, which depends via the Fresnel equations on the aspect ratio Ri/Re, and on the ratio of the refractive index of the fluid nf to that of glass, ng (Figure 3). The aspect ratio ranges from 0 to 1 for thick- to thin-walled vessels, and determines, with ng, and the index of the surrounding medium, usually air with n=1, the angle of incidence at the inner wall. The only free parameter in the intensity of the reflection is thus the refractive index of the fluid inside the capillary. Figure 5 shows another example of a capillary filled with water and CO2; the inner cusp is much brighter on the CO2 side than on the water side. Note the much darker (almost invisible) cusp on the water side compared to that in Figure 1, in a capillary with a different aspect ratio. These examples show experimentally that the brightness of the inner cusp depends both on the index of fluid nf and the aspect ratio of the capillary, which thus can be chosen to be most sensitive to a range of refractive indices (see Figure 3). The brightness of the inner cusp should be constant and maximum for indices below the critical value nfl, for which total internal reflection prevails, and decay steeply with increasing index above nfl, vanishing when the index of the fluid nf matches that of the glass ng. Thus, this behavior would be favorable to measure refractive index accurately via the brightness of the cusp. The question is whether these indices can be determined quantitatively.
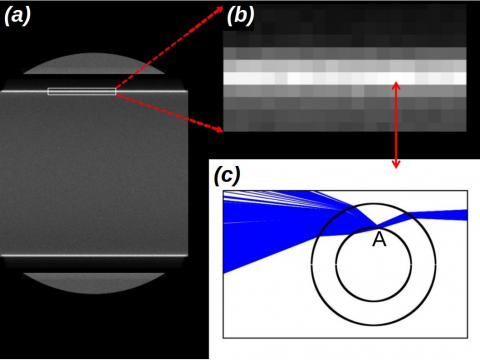
We tested this approach, with disappointing results - chiefly a decay of the intensity with increasing refractive index milder than that calculated in Figure 3. We investigated this failure with a home-made Monte Carlo ray tracing simulation code, that enables us to determine the paths of rays contributing to any pixel in the image. The simulations show that the totally reflected rays are present in the cusp, but in a background of rays either of partial reflection off points close to the median plane, or rays that graze into the bore (Figure 6). On the positive side, the simulations do confirm Hobeika et al.’s [12] assertion that the cusp is formed by rays undergoing minimum or close to minimum deviation.
Figure 6. Why the intensity of the cusp reflected off the inner wall does not determine refractive index: (a) Simulated image of a 200/330µm capillary filled with hexane (nf=1.355), viewed with a x20 objective and a camera with 5.5µm pixels and 4x4 binning; (b) Zoom on the inner cusp; (c) Ray paths contributing to the highlighted line of pixels (b). Partial reflections ahead of or behind the median plane, and rays grazing through the bore, swamp total internal reflection at the median plane, point A
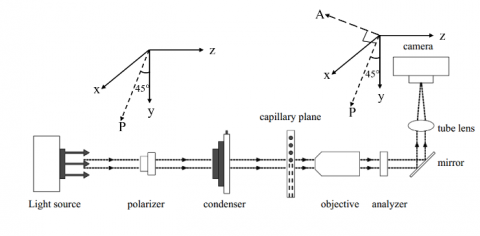
The situation is different when a polarizer is placed between the source and the condenser lens, and a cross-oriented analyzer between the objective and the camera, cf. Figure 7. With the capillary axis making an angle with the polarizer (e.g. 45°), the incident light at the inner bore has both S and P components, perpendicular (S) and parallel (P) to the plane of incidence. Under conditions of total internal reflection, these components undergo different phase lags, jS and jP, resulting in an elliptically polarized reflection with a non-vanishing component on the analyzer direction. Using the Jones matrix formalism, we derive the following expression for the intensity of the total internal reflection:
$I=I_{0} \sin ^{2} \frac{\left(\varphi_{P}-\varphi_{S}\right)}{2}$ (5)
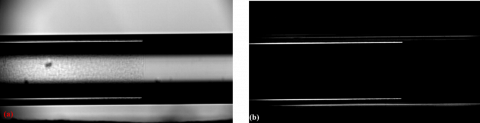
where, jS and jP depend on the refractive index of the fluid in the bore. The background of rays bypassing the capillary is completely extinguished. Other rays undergoing either ordinary reflection or refraction remain linearly polarized, with the plane of polarization slightly rotated. The net result is a strong attenuation of the unwanted components, cf. Figure 8. The resulting images are strongly contrasted, owing to the presence of the crossed polarizer and analyzer, so it is useful to use a camera with a large dynamic range. Even then, some adjustments like exposure times may also be required. Figure 8 shows an example of a cyclopentane hydrate film growing over the inner wall at close to ambient conditions in a fused silica capillary (see previous section), viewed in transmission microscopy (Figure 8a, see also Figure 4a) and with the setup of Figure 7 (Figure 8b). Note in the latter figure the near complete extinction of all features except the inner cusp.
Encouraged by this, we examined CO2 under pressure at a constant temperature of 20°C in a fused silica capillary. The refractive index of CO2 as a function of pressure (density) has been widely tabulated, enabling a plot of brightness vs. index. Figure 9 thus shows the integrated intensity of the inner cusp as a function of the index, compared with the theoretical results. The experimental data show a similar trend to the theoretical prediction, suggesting the use of the method after calibration. We then conducted simulations under similar conditions, which show that the brightest part of the cusp is due almost entirely to the total internal reflection, while lines of pixels in the wings of the cusp are partly due to multiple internal reflections between inner wall and outer wall of the capillary (whispering gallery effect). Using only the peak intensity (brightest line of pixels) and a correction of the small rotation of the plane of polarization on refraction at the outer wall, we consistently obtain good agreement (within ~1%) with data from an Abbe refractometer, but with a configuration amenable to extreme temperatures and pressure. Table 1 shows results for various mixtures of iso-propanol and water. Further details of a method based on polarized light in capillaries of appropriate cross-section will be published shortly.
The rapid and non-destructive measurement of refractive index under harsh conditions like high pressure and low temperature is highly needed. The above method making use of crossed polarizer and analyser is simple to operate and at low cost. It can also be used for measuring the refractive indices of non-transparent fluids. Work is in progress to increase the accuracy as well as board the range of accessible refractive indices.
Figure 7. Schematic diagram of the experimental setup, showing the perpendicular directions of the polarizer (P) and analyser (A), with the capillary set at about 45° to both (and aligned along direction x)
Figure 8. (a) Transmission image of a cyclopentane hydrate halo growing in a capillary; (b) the same view a few seconds later, under crossed polarizer and analyzer, showing the extinction of nearly all features except the inner cusp
Figure 9. Brightness of the inner cusp as a potential yardstick of the refractive index. Preliminary data for CO2 at 20°C and 1 to 6 MPa. Squares: experimental integrated intensity of the inner cusp as a function of index; thin line: equation (5), (single incidence); thick line: same, averaged to allow for variable incidence
Table 1. Refractive indices of mixtures of water and iso-propanol (IP), measured in a glass capillary, compared with the values determined with an Abbe refractometer
|
Sample (wt % IP) |
Experimental results range |
Abbe Refractometer |
|
air |
1.0112~1.0515 |
1.0000 |
|
0 (water) |
1.3354~1.3372 |
1.3330 |
|
0 (water) |
1.3366~1.3377 |
1.3333 |
|
12.8 |
1.3426~1.3446 |
1.3444 |
|
27.7 |
1.3514~1.3565 |
1.3534 |
|
34.3 |
1.3572~1.3674 |
1.3606 |
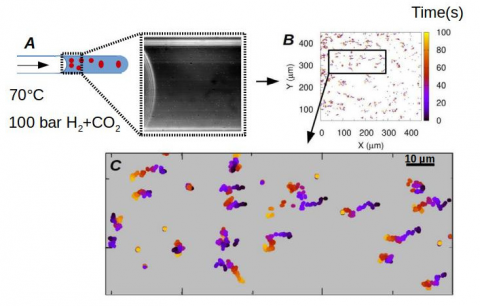
Finally, we illustrate the convenience of glass microcapillaries for simulating under the microscope the extreme conditions of temperature or pressure, that may prevail on the ocean floors, in the vicinity of hydrothermal vents, or in deep continental environments such as deep aquifers. Using glass capillaries, it is possible to monitor the behaviour of the microorganisms, escape or chemotactism, under extreme conditions. As shown in Figure 10, the microbial cells which need to use H2/CO2 for their growth, migrate to the interface with the gas mixture (black to yellow trajectories).
The results presented in this paper illustrate some novel potentialities and perspectives offered by round glass microcapillaries when used as high-pressure and high-temperature optical cells under the microscope. Observation under the optical microscope of glass capillaries having a non-negligible wall thickness is subject to with significant refraction and reflection effects, responsible for image distortion and for the dimming or brightening of the various interfaces, starting with the inner wall of the capillary. We show that these effects cannot only be handled and corrected properly, e.g., to find true dimensions or angles from apparent values, but in some favorable circumstances turned to advantage, e.g., for detecting very thin films on glass not visible by transmission microscopy, to render circumstances favorable, it often suffices to choose the ratio of internal to external diameters of the capillary in an appropriate range. A simple non-destructive method using an optical microscope with crossed polarizer and analyzer has been proposed to measure the refractive index of fluids under harsh temperature and pressure conditions.
Figure 10. Glass microcapillaries may be used to recreate the conditions favored by extremophile microorganisms. (A) Phase contrast image of an archaeal strain, which consumes H2 and CO2 to produce CH4, from a thermal vent on the Atlantic floor, cultivated here under the microscope in a 500 µm capillary; (B) Trajectories of individual archaeal cells extracted from a 100s video recording (using Icy [18]); (C) Zoomed-in view of the tracks showing migration towards the source H2 and CO2
This work is supported by Agence Nationale de la Recherche (Project HYDRE ANR-15-CE06-008), CAPBP (Communauté d’Agglomération Pau Béarn Pyrénées, project “Laboratoire en capillaire”) and by CNRS (Origins, MISMEV project).
[1] Leng, J., Salmon, J.B. (2009). Microfluidic crystallization. Lab on a Chip, 9: 24-34. http://doi.org/10.1039/B807653G
[2] Karadimitriou, N.K., Hassanizadeh, S.M. (2012). A Review of micromodels and their use in two-phase flow studies. Vadose Zone Journal, 11(3). http://doi.org/10.2136/vzj2011.0072
[3] Roedder, E. (1984). Nondestructive methods of determination of inclusion composition. Reviews in Mineralogy 12. Fluid Inclusions. Reston, Virginia, Mineralogical Society of America, 12: 82-93. http://doi.org/10.1515/9781501508271-001
[4] Lu, W., Guo, H., Chou, I.M., Burruss, R.C., Li, L. (2013). Determination of diffusion coefficients of CO2 in water between 268 and 473 K in a high-pressure capillary optical cell with in situ Raman spectroscopic measurements. Geochimica et Cosmochimica Acta, 115: 183-204. https://doi.org/10.1016/j.gca.2013.04.010
[5] Guo, H., Chen, Y., Hu, Q., Lu, W., Ou, W. (2014). Quantitative Raman spectroscopic investigation of geo-fluids high-pressure phase equilibria: Part Ⅰ. Accurate calibration and determination of CO2 solubility in water from 273.15 to 573.15 K and from 10 to 120 MPa. Fluid Phase Equilibria, 382: 70-79. https://doi.org/10.1016/j.fluid.2014.08.032
[6] Chou, I.M., Pan, Z. (2014). Fused silica capillary reactor and its applications. Chapter 6 in Near-critical and Supercritical Water and Their Applications for Biorefineries. Springer (Netherlands). http://doi.org/10.1007/978-94-017-8923-3_6
[7] Belgodere, C., Dubessy, J., Vautrin, D., Caumon, M.C., Sterpenich, J., Pironon, J., Robert, P., Randi, A., Birat, J.P. (2015). Experimental determination of CO2 diffusion coefficient in aqueous soultions under pressure at room temperature via Raman spectroscopy: Impact of salinity (NaCl). Journal of Raman Spectroscopy, 46(10): 1025-1032. https://doi.org/10.1002/jrs.4742
[8] Wang, J., Zhou, S., Bei, K., Zhang, D., Chou, I.M., Chen, Z., Lin, C., Pan, Z. (2017). Using a fused silica capillary cell and in situ Raman spectroscopy to develop a setup for measurement of the voulume expamsion of carbon dioxide + n-hexane. Energy & Fuels, 31(6): 6314-6319. https://doi.org/10.1021/acs.energyfuels.7b00549
[9] Wang, J., Zhou, S., Bei, K., Chou, I.M., Lin, C., Pan, Z. (2017). A new approach for the measurement of the volume expansion of a CO2+n-dodecane mixture in a fused silica capillary cell by Raman spectroscopy. Fuel, 203: 113-119. https://doi.org/10.1016/j.fuel.2017.04.094
[10] Hu, Q., Guo, H., Lu, X., Lu, W., Chen, Y., Zhu, Y., Geng, L. (2016). Determination of P-V-T-x properties of the CO2-H2O system up to 573.15 K and 120 MPa - Experiments and model. Chemical Geology, 424: 60-72. https://doi.org/10.1016/j.chemgeo.2016.01.011
[11] Chen, E.Q., Lam, C.F., Periasamy, A. (1991). Effect of refraction on optical microscopic measurement of internal blood-vessel diameter and its correction. Journal of Microscopy, 164(3): 239-245. https://doi.org/10.1111/j.1365-2818.1991.tb03210.x
[12] Hobeika, N., Bouriat, P., Touil, A., Broseta, D., Brown, R. (2017). Help from a hindrance: Using astigmatism in round capillaries to study contact angles and wetting layers. Langmuir, 33(21): 5179-5187. https://doi.org/10.1021/acs.langmuir.7b01025
[13] Touil, A., Broseta, D., Hobeika, N., Brown, R. (2017). Roles of wettability and supercooling in the spreading of cyclopentane hydrate over a substrate. Langmuir, 33(41): 10965-10977. https://doi.org/10.1021/acs.langmuir.7b02121
[14] Touil, A., Broseta, D., Desmedt, A. (2019). Gas hydrate crystallization in thin glass capillaries: Roles of supercooling and wettability. Langmuir, 35(8): 12569-12581. https://doi.org/10.1021/acs.langmuir.9b01146
[15] Liu, W., Jiang, S., Ma, Z. (2000). Experimental study on Abbe refractometer. Modern Measurement and Test, 6: 45-49. https://doi.org/10.16428/j.cnki.cnll-4827/t.2000.06.012
[16] Zhang, Q., Guo, H., Yang, H., He, J. (2000). Measurement of the refractive index for liquid using CCD. Semiconductor Optoelectronics, 21(3): 229-232. https://doi.org/10.3969/j.issn.1001-5868.2000.03.023
[17] Sun, J., Wang, M. (2005). Measurement the refractive index of liquid by optical fiber Young’s interference experiment. Physical Experiment of College, 18(1): 8-10. https://doi.org/10.3969/j.issn.1007-2934.2005.01.003
[18] De Chaumont, F., Dallongeville, S., Chenouaed, N., Hervé, N., Pop, S., Provoost, T., Meas-Yedid, V., Pankajakshan, P., Lecomte, T., Le Montagner, Y., Lagache, T., Dufour, A., Olivo-Marin, J.C. (2012). Icy: an open bioimage informatics platform for extended reproducible research. Nature Methods, 9: 690-696. https://doi.org/10.1038/nmeth.2075