Nida Nasir | Shaima Raji | Mahmoud F. Al Ahmad*
© 2020 IIETA. This article is published by IIETA and is licensed under the CC BY 4.0 license (http://creativecommons.org/licenses/by/4.0/).
OPEN ACCESS
Urolithiasis is a very usual problem affecting humans and animals both globally. Calcium-oxalate is the main component of the urinary stones, largely because of the excess consumption of oxalate-rich foods. The occurrence of urinary oxalate occurs by endogenous synthesis. In a normal, healthy individual the excretion of oxalate ranges from 10mg to 45mg per day, based on the age and gender, but risk of stone formation starts at 25mg per day reliant on the individual health history. This study determines a sensitive method for sensing the existence of calcium oxalate in urine. This can be done by measuring the variant amounts of calcium oxalate hydrate (CaC2O4.H2O) in urine and analyzing the dielectric properties of each sample. The proposed method can distinguish dynamic changes in the samples’ electrical properties over a time interval. Even for the urine sample containing calcium oxalate hydrate as low as 10μg per ml. This makes the proposed method appropriate for identifying changes that are unrecognized by conventional methods. The potential to detect very small quantity of stone salts makes it a lucrative tool for sensing and quantifying stones in kidney.
calcium oxalate powder, capacitance-voltage method, urinalysis, kidney stones
Nephrolithiasis is a regular malady, with a predictable recurrence rate of half decade in up to 50% instances [1]. Because of the continuous change in the eating tendency and lifestyle, there is a record growth in the occurrence of calculi since last century [2, 3]. The problem factors of urolithiasis are polydipsia, corpulence, hypertension [4-8] and insulin resistance syndrome (IRS) [9] which leads to chronic kidney disease (CKD) [10-13]. Lithiasis occurs when the amount intake of certain minerals surges (tested through concentration of urine), enhancing their crystallization which further grow and stick to the kidneys ducts as stones [14].
Figure 1. A schematic depiction of available laboratory analysis techniques for renal stones
Many published reports manifest that common trace elements of kidney stones are Ca, Mg, Mn, Cu, Fe, etc. [15-17]. Nevertheless, calcium ones are the most prevalent, especially oxalate and phosphate crystals which exist discretely as well as in fusion. Hyperoxaluria sometimes lead to end-stage renal disease (ESRD) due to high excessive excretion of oxalate anions in urine [18]. Calcium oxalate is a salt of a dicarboxylic and oxalic acid which exists as whewellite (monohydrate or COM) and weddellite (dihydrate or COD). Among all stones, COM is the most usual form which occur globally [19].
Precise analysis of renal calculi is the prerequisite for metaphylaxis. Currently, available analysis techniques are shown in Figure 1 which encompasses spectroscopy, TG, polarization microscopy SEM and X-ray diffraction, etc [20, 21]. Furthermore, spectroscopy has various subcategory techniques such as IR, EDX, LIBS, LA-ICP-MS, XAS [22-26] and hence consider as one of the main techniques. Still, no solitary technique provides data about the kidney stones, numerous groupings of these methods are needed for study [27].
Lately, various investigations are done about calculi behavior, their detection and identification along with their quantification. The recognition of these stones usually have been done based on their properties, such as electrical conductivity, dielectric constant, polarization, and capacitance etc. [28, 29]. The pH of the urine affects the progression of the stones; an alkaline pH environment helps to prevail the Ca and P stones, while acidic environment supports uric acid or cystine calculi [30].
Our study deals with the initial stage of the kidney stones formation, simulated by adding insoluble CaC2O4.H2O to the urine of the normal individual. In this study, we have carried out electrical characterization and urinalysis (conventional method) on urine samples containing different concentrations of calcium oxalate hydrate powder, which is one of the main components of kidney stones formation.
Suspensions of calcium oxalate hydrate (composed of ions) when interacted with an applied electric field, experience polarization; therefore, they can be treated as a dielectric material that affects its capacitance which can be measured by a capacitor. The strength of the polarization depends on the composition and its interactions of components within the suspending medium. A noteworthy feature of this method is that there are no major pre-processing steps. Detection of changes in the electrical properties that correlate well with concentration can be of importance since it will enable the extraction of oxalate concentration, a parameter that is of high diagnostic and prognostic value, especially in the case of kidney stones where high sensitivity is required to detect a small amount of oxalate.
Figure 2(a) illustrates how calcium oxalate suspended in urine are randomly distributed inside a capacitor. When it is placed under the effect of an applied electric field, it gets polarized and one type of polarization results from the diffusion of the charged ions, resulting in a big dipole (see Fig. 2(b)). For simplicity and modelling, the calcium oxalate distribution inside a capacitive structure is assumed as two separate zones as a parallel model. The volumes of the calcium oxalate and medium zones are the same as their respective actual volumes in the suspension in both parallel and series representations. We can describe the capacitance of suspensions using the following Eq. (1) which is the corresponding electrical equivalent capacitance model for the Figure 2(b).
$C_{s}=C_{u}+C_{c}$ (1)
where, C is the capacitance and subscripts depict as follows: s: sample; u: urine and c: calcium oxalate, respectively.
Figure 2. Schematic representation of the electrical model used in this study: (a) Illustration of a random distribution of calcium oxalate in fluid medium (urine in this case). (b) An alternative two-zone parallel capacitive model is presented of oxalate distribution inside a capacitive structure. L is Length of the total capacitor; d is diameter of the capacitor; Lu and Lc are lengths of capacitors zones occupied by the medium (urine) and calcium oxalate, respectively
3.1 Sample preparation
Usually individuals are unaware of their upcoming health threats, so they barely contact doctors in regard of any kidney related problem. The main purpose of using artificial samples for the study is the same, as getting urine samples of people who are prone to kidney stones (having high oxalate in urine) are hard to avail. People only reach doctors in regards of kidney problems when they have abdominal pain, vomiting, etc which is obvious symptoms of kidney stones.
To prepare the samples we introduced calcium oxalate hydrate (CaC2O4.H2O) (Sigma-Aldrich, United Kingdom) powder artificially to the fresh urine of the normal individual. A fresh urine sample was collected and centrifuged to prepare suspensions in urine, with 3000 rpm for 5 minutes. The centrifugation process has been done by Clinical Benchtop Centrifuges from Biocompare, USA. The same urine sample has been utilized together for electrical measurements as well as urine strip analysis and used as one of the references for the study. The rest of the urine sample was centrifuged at 3000 rpm for 5min and used as the diluent for suspending the CaC2O4.H2O powder. The quantity of CaC2O4.H2O powder varied from 10 mg, 1 mg, 100 μg and 10 μg per mL of the urine sample.
3.2 Urinalysis
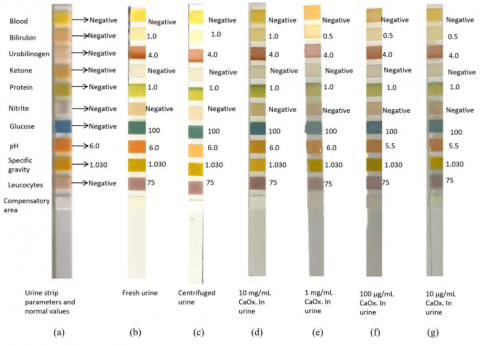
The urinalysis has been done using test strip (SD Uro-Color from Republic of Korea) for the identification of main elements of urine. The strips react with the sample urine and produce a colour change in each reagent pad that determines the level of each chemical factor by comparing with standard colour chart [30]. The test was conducted one by one for each sample. The process has been done at room temperature. Figure 3 shows all urine strips tests for different samples.
Figure 3. Urinalysis test strips for: a) Without Urine (normal values), b) Fresh Urine, c) Centrifuged Urine, d) 10 mg/mL CaC2O4.H2O in urine, e) 1 mg/mL CaC2O4.H2O in urine. f) 100 μg/mL CaC2O4.H2O in urine, and g) 10 μg/mL CaC2O4.H2O in urine
3.3 Electrical characterization
The sample prepared using the centrifuged urine were used for electrical characterization. The electrical characterization was performed by loading the urine samples inside the coaxial cable of the Gamry-Reference 3000 (from USA) instrument and measuring samples’ electrical parameters. The capacitance values of the samples have been measured in the potential range from ±0.4V and at the frequency of 10 Hz which are suitable for polarizing the suspended particles without altering the traits of the components inside the sample. At this frequency signal-to-noise ratio (SNR) is improved and frequency impedance spectra exhibit constant phase angle (CPA) character and amplitude. The GR3000 is a USB Potentiostat with excellent performance that includes 11 variant ranges of current from 300 pA with up to 32 A compliance voltage while frequency range over 10μHz to 1MHz. The GR3000 includes power signals generator which can measure current vs voltage (IV), capacitance vs voltage (CV), polarization along with charging/discharging profiles at diverse frequencies. Each sample has been put in an open-ended coaxial cable (self-resonance above 100MHz) which is connected to GR3000. The experiment has been carried out at room temperature. Experimental setup of the electrical detection of the urine sample, has been depicted in Figure 4.
Capacitance measurements were conducted in a coaxial adaptor connected to coaxial cables. The structure of the coaxial adaptor comprised of inner and outer conductors with dimensions of 2 and 5 mm, respectively, and a length of 7mm. The samples were loaded into the adaptor serving as the dielectric material. The advantage of the coaxial topology is that the radio frequency signal and the electrostatic field propagations are confined and protected from outside interferences and the signals do not escape space between inner and outer conductors [31]. The experimental data has been measured using Gamry software, version 7.8, dedicated especially to the GR3000, from which data has been used for further analysis.
Figure 4. Experimental setup of the electrical detection of the urine sample
4.1 Urinalysis
Urinalysis has been done using the urine strips with the urine samples containing different concentrations of CaC2O4.H2O. Calcium oxalate-hydrate was artificially introduced into centrifuged urine to compose the following range of concentrations i.e. 10 mg/ mL, 1 mg/ mL, 100 μg/mL and 10 μg/mL of urine, while centrifuged urine was used as a reference.
Table 1 depicts the comparison of the control urine strip with those containing different concentrations of CaC2O4.H2O. The pH value of urine is one of the critical measured parameters, a change in which indicates urine pathology [32]. The normal urine pH is approximately 6.0 but can range from 4.5 to 8.0 [33]. Control samples indicated a pH of 5.5. The pH of the CaC2O4.H2O at concentrations of 10 mg/mL and 1 mg/ mL indicated a value of 6. However, the pH of urine at concentrations of 100 μg/mL and 10 μg/mL of calcium oxalate was 5.5, that is very insignificant variation. Usually, a disparity in pH of urine is explained by the presence of stones formed of calcium, oxalate, citrate, proteins and other macromolecules, in this case, it is due to the presence of oxalate powder [34].
A normal, healthy individual voids 1000-2000 mL of urine per day [35]. Normal levels of urine oxalate excretion are less than 45 mg/day (<0.50 mmol/day). Based on an individual’s age and gender along with health history and various other parameters, the risk of calculi formation is higher even at 25mg per day, which is considered a normal value [36]. COM formation is associated with the occurrence of excess oxalate amounts [37]. Conte et al. have shown that there is a link between the type of salt present in the stones and their properties [38]. Based on the above data we have chosen 10 μg of CaC2O4.H2O per mL of urine as the lowest concentration for the current study.
The colour pads on the reagent strips for other parameters did not show a considerable colour change when compared to the reference sample strips. The glucose pad on strip had shown value of 100 due to the trace amounts of glucose normally excreted in urine. The presence of leukocytes is indicated as 75 in the test strip, which is a negligible amount and might not always indicate an infection of the urinary tract. Bilirubin conjugates with glucuronic or sulfuric acid and appears in the sample of urine. The existence of conjugated bilirubin inside urine is commonly associated with liver disorders like hepatitis, cirrhosis, gallbladder disease and various hepatocellular cancers. Urobilinogen is formed by the bacterial action on conjugated bilirubin and its appearance in urine is caused mostly by hemolysis or hepatocellular dysfunction. Protein component indicates a colour range of 1, protein enters the urine either due to altered renal functions like permeability or tubular damage. Adults have a normal specific gravity of 1.005 to 1.030 [39-42].
The use of urine-strip test helped in a clear understanding of the nature of the urine samples used in the current study and the stability of the various parameters. The test results show that the urine sample used is within the normal range and no significant changes were observed upon mixing calcium oxalate, only trivial changes has been observed in the values of pH and bilirubin. Hence a sensitive method is required to detect even minute amounts of the calcium oxalate in urine.
Table 1. Urinalysis of calcium oxalate hydrate powder with centrifuged urine
|
|
Calcium oxalate hydrate powder (CaOx.xH2O) with centrifuged urine |
|||
|
10mg/mL |
1mg/mL |
100mg/mL |
10mg/mL |
|
|
pH |
6.0 |
6.0 |
5.5 |
5.5 |
|
Glucose |
100 |
100 |
100 |
100 |
|
Blood |
Neutral |
Neutral |
Neutral |
Neutral |
|
Bilirubin |
1 |
0.5 |
0.5 |
0.5 |
|
Urobilinogen |
4 |
4 |
4 |
4 |
|
Ketone |
Neutral |
Neutral |
Neutral |
Neutral |
|
Protein |
1 |
1 |
1 |
1 |
|
Nitrite |
Neutral |
Neutral |
Neutral |
Neutral |
|
Specific Gravity |
1.030 |
1.030 |
1.030 |
1.030 |
|
Leucocytes |
75 |
75 |
75 |
75 |
4.2 Electrical characterization
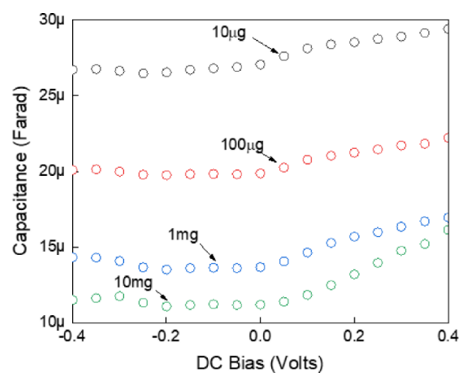
The capacitance-voltage (CV) profiles for suspended CaC2O4.H2O in urine with increasing concentrations from 10μg/mL to 10 mg/mL has been depicted in Figure 5. The capacitance values of the samples have been measured over a voltage potential range from ±0.4V and at the frequency of 10 Hz. The applied voltage range and frequency are suitable for polarizing the suspended particles, however, beyond this range, the traits of the components inside the sample may get altered [43]. Moreover, low frequency of 10 Hz is desirable to improve the signal-to-noise ratio (SNR) as well as at this frequency impedance spectra exhibit constant phase angle (CPA) character and amplitude [44, 45]. The solubility of CaC2O4.H2O in urine varies due to pH and common ion effect, however temperature also plays a vital role [46].
As revealed from Fig. 5, the capacitance for CaC2O4.H2O suspensions were inversely proportional to the concentration of CaC2O4.H2O; i.e. the suspension with the maximum amount of calcium oxalate powder generated the lowest curve while curves were found to shift to higher values with decreasing concentrations of oxalate powder. For the negative dc bias, all curves are almost parallel, however, for positive dc bias curves are showing an increasing trend. This may be due to the change in the physical and dielectric properties of the calcium oxalate when there is a change in the polarity of the applied voltage [47]. The average capacitance over negative applied voltage is 26.72 μF, 18.8 μF, 13.88 μF and 11.40 μF for the samples with oxalate powder concentration of 0.01mg, 0.1mg, 1mg and 10mg per mL of urine, respectively.
It had been expected that the curves of the suspensions would follow the direct relationship between the capacitance and CaC2O4.H2O concentration in samples, i.e. for the higher concentration of calcium oxalate powder the capacitance value must be higher. Nevertheless, a contrasting trend has been observed. It can be surmised that it is due to the dynamic nature of urine, that varies over time. To verify the time dependency of urine, we prepared control-samples from these suspended samples, which will act as references for further measurements. After the measurements, to concoct control samples, the suspended samples were centrifuged, and its supernatants were subjected to the electrical measurements. The corresponding CV measurements of the control samples are depicted in Figure 6. On comparing both the figures, Figures 5 and 6, a homologous pattern of capacitive curves has been observed. This comparison reveals that the control samples have higher values than their corresponding suspended samples.
Figure 5. Capacitance-voltage (CV) measurements of calcium oxalate powder suspensions in urine
Figure 6. CV profiles of control urine after centrifuged suspensions for different masses
The extraction of the supernatant from its corresponding suspended samples excludes the effect of the sediment [48], leading to the aberrations in the capacitive values for controlled samples. Except for 1mg controlled sample, all other samples have an increasing slope for the positive applied voltage, however, for the negative dc bias, all curves are analogous. The average capacitances over negative dc bias are 28.76 μF, 23.2 μF, 15.8 μF, and 11.48 μF for the samples with oxalate powder concentrations of 0.01mg, 0.1mg, 1mg and 10mg per mL of urine, respectively.
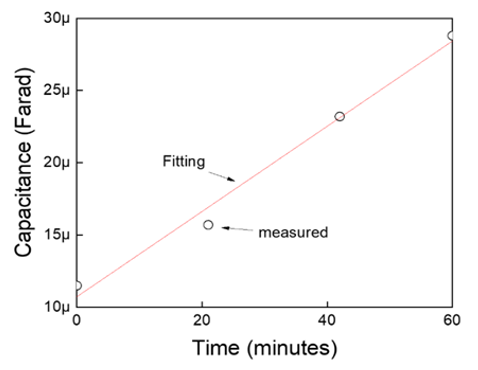
The time-dependent dynamic nature of urine has been manifested in Figure 7. The chronological measurements have been taken with approximately 20 minutes gap up to one hour, to measure the controlled urine capacitance. As the overall urine properties and parameters critically depend on the time window, it is recommended to perform the study within the time period of 90 minutes [49]. This curve shows a linear increase in the capacitance from 11.65 μF to 28.7 μF within an hour. It indicated that the control sample undergoes some dynamic changes over time. The changes are mostly chemical that can distress its electrical parameters leading to a gradual increase in capacitance with time. A fitting curve has been generated using the linear regression model, with the extracted parameters, as depicted in Figure 7. It shows that fitting and measured values exhibit approximately the same trend. The estimation model parameters are showing very fewer deviations from actual empirical values of data. The adjusted R-square value is 0.9812 approaching to one which indicates that the model perfectly predicts the values in the target field. The rate of change of urine over time can be expressed as the slope of the fitted curve which is 0.295 μF/min.
Figure 7. Time-dependent changes in urine samples capacitance, depicting measured and fitting curves. A subset table of its curve fitting parameters is also shown
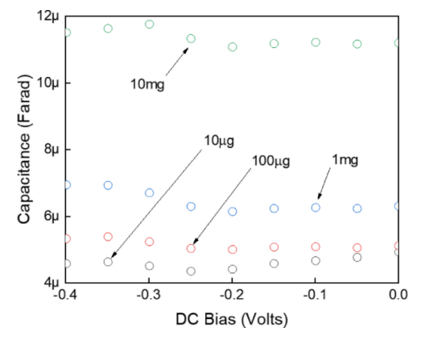
The rate of change of urine has been used to de-embed the dynamic effect of urine from the suspended samples. By performing this step, the capacitance values were corrected for any possible changes occurring over the experiment time window. After excluding the dynamic effect of the urine from the samples suspended with various concentrations of the oxalate powder, Figure 8 manifests the effective capacitance over negative applied voltage. The capacitance values of each supernatant urine samples were deducted from its corresponding urine suspension of CaC2O4.H2O powder. Now, a reverse trend of normalized capacitance values can be observed over negative applied voltage, as compared to Figure 6, i.e. 10μg < 100μg < 1mg < 10 mg within the range of 4-12 μF. Even the average magnitude is reduced to 11.3 μF, 6.415 μF, 5.164 μF and 4.623 μF, for the concentration of CaC2O4.H2O in 10mg, 1mg, 100μg, and 10μg, per mL respectively.
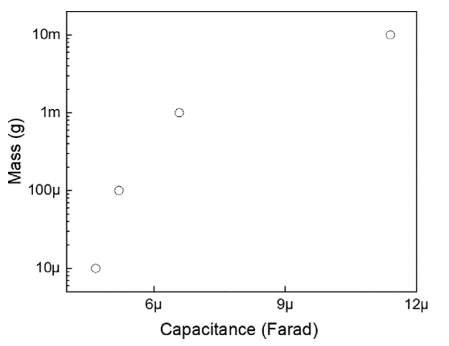
In our study, the growth rate model of mass with respect to capacitance has been established in Figure 9. The curve shows a gradual increase in the mass. Initially, it shows a steep increase in mass and later the mass tends to become steady with the increase in capacitance. Hence higher values of the capacitance indicate higher concentrations of oxalate in the urine. Many studies in the urolithiasis field aim at finding new and more effective treatments to reduce kidney stones formation, which can be done by either controlling the process of crystal formation in urine or by increasing the solubility of existing crystals. Such studies must be conducted on urine samples of known and controlled composition, and thus it is very common to observe the use of synthetic urine or the artificial introduction of crystals to simulate urine samples reflecting a urolithic illness [50-55].
Figure 8. Capacitance-voltage (CV) profile of oxalate powder suspensions after de-embedding the dynamic contributions of the urine for negative applied voltages
Figure 9. Capacitance-Mass (CM) profile with logarithmically increasing concentrations of powder 10 μg, 100 μg, 1 mg and 10 mg over capacitance
Not using a real sample from individuals prone to kidney stone formation should not be a limitation of the study since we do not claim the ability to identify the type of salts forming the crystal, but rather we prove that insoluble calcium oxalate salt can be both detected and quantified. Such ability can be of high value especially when performing experiments that require the use of urine samples with a known composition. For example, quantification of insoluble salts present in the urine of known calcium oxalate concentrations can be used indirectly to assess the level of crystal solubility when testing new medications targeting crystal formation [56]. This can be easily done by comparing the measured capacitance values after de-embedding step to the provided (mass/capacitance) standard curve. Such a method can be favoured on other analytical methods that can be lengthy and laborious.
Expanding this work can be done by testing other kinds of crystal-forming salts so that assessing medications can be done more effectively and can facilitating the discoveries in this field of medicine. This method is much easier, highly sensitive, safe, economical and reliable and precludes the requirement for lengthy sample processing steps.
4.3 Accuracy and reproducibility
The accuracy and reproducibility of the presented method has been checked using repeated electrical measurements against multiple calcium oxalate concentrations prepared at different times; i.e., all within the employed same applied bias voltage. As detailed, the accuracy of these measurements using the outlined methodology is comparable with other conventional techniques.
The work illustrated describes a novel and label-free method for the detection of the presence of calcium oxalate hydrate in urine. Urine samples used in this study were reconstituted by mixing calcium oxalate hydrated powder with fresh urine to simulate urine samples taken from patients at the very initial stage of the kidney crystals formation, resulting in the presence of high concentrations of oxalate. Such abnormality may result from the excess consumption of oxalate enriched foods, which ultimately leads to crystals that develop into kidney stones. The proposed method involves detection and quantification of calcium oxalate in urine based on electrical parameters without the need for any pre-processing steps. Urinalysis using dipsticks has been used to acquire preliminary information on the nature of the urine sample used in preparing the samples and to show that calcium oxalate in urine did not alter other normal parameters even when was present at high concentrations.
The current method was based on the use of electrical parameters (capacitance-voltage measurements) to detect the initial stage of kidney stones formation through urine. Any deviation from the standard urine composition can be detected because of the variations in electrical parameters when exposed to an electric field, even for the urine sample containing calcium oxalate hydrate as low as 10μg per mL. Interestingly, this method could detect time-dependent intrinsic dynamic changes in the electrical properties of urine samples even in the absence of calcium oxalate. Such changes could mask the electrical changes that can be imposed by the abnormal presence of calcium oxalate in urine. In our study, we overcame this issue by including a de-embedding step, where the masking effect was removed, and the electrical changes became more relevant and correlated well with the increasing concentrations of calcium oxalate hydrate. The outlook of the study suggests that it can be used for ionized samples, like, cancer and normal cells, DNA, viruses, etc.
This work was supported by fund 31R085 from UAE University.
|
C |
Capacitance (F) |
|
d |
Diameter |
|
L |
Length |
|
Subscripts |
|
|
u |
Urine |
|
c |
Calcium oxalate |
|
s |
Suspension |
(1) Ethical Approval. This research includes experimentation on human biological samples, which have been approved by United Arab Emirates University Human Ethics Committee with reference number “ERH_2017_5499”. The authors confirmed that all the conducted experiments in this work were conducted according to established ethical guidelines, and informed consent obtained from the participants.
(2) Competing Interests. The authors declare that they have no competing interests.
(3) Author Contributions. MA supervised the project. MA and NN conceived the concept and performed the electrical measurements analyzed the results. NN and SR prepared the urine samples and did Urinalysis. All authors discussed the results and commented on the manuscript.
[1] Fink, H.A., Wilt, T.J., Eidman, K.E., Garimella, P.S., MacDonald, R., Rutks, I.R., Brasure, M., Kane, R.L., Ouellette, J., Monga, M. (2013). Medical management to prevent recurrent nephrolithiasis in adults: A systematic review for an American college of physicians clinical guideline. Annals of Internal Medicine, 158(7): 535-543. https://doi.org/10.7326/0003-4819-158-7-201304020-00005
[2] Obligado, S.H., Goldfarb, D.S. (2008). The association of nephrolithiasis with hypertension and obesity: A review. Am J Hypertens, 21(3): 257-264. https://doi.org/10.1038/ajh.2007.62
[3] Scales, C.D., Smith, A.C., Hanley, J.M., Saigal, C.S. (2012). Prevalence of kidney stones in the United States. European Urology, 62(1): 160–165. https://doi.org/10.1016/j.eururo.2012.03.052
[4] Cappuccio, F.P., Strazzullo, P., Mancini, M. (1990). Kidney stones and hypertension: Population based study of an independent clinical association. British Medical Journal, 300: 1234. https://doi.org/10.1136/bmj.300.6734.1234
[5] Daudon, M., Jungers, P. (2007). Diabetes and nephrolithiasis. Current Diabetes Reports, 7: 443-448.
[6] Lieske, J.C., de la Vega, L.S.P., Gettman, M.T., Slezak, J.M., Bergstralh, E.J., Melton, L.J., Leibson, C.L. (2006). Diabetes mellitus and the risk of urinary tract stones: a population-based case-control study. Am J Kidney Dis Off J Natl Kidney Found, 48(6): 897-904. https://doi.org/10.1053/j.ajkd.2006.09.002
[7] Taylor, E.N., Stampfer, M.J., Curhan, G.C. (2005). Obesity, weight gain, and the risk of kidney stones. JAMA, 293(4): 455-462. https://doi.org/10.1001/jama.293.4.455
[8] Taylor, E.N., Stampfer, M.J., Curhan, G.C. (2005). Diabetes mellitus and the risk of nephrolithiasis. Kidney International Official Journal of the International Society of Nephrology, 68(3): 1230-1235. https://doi.org/10.1111/j.1523-1755.2005.00516.x
[9] Johri, N., Cooper, B., Robertson, W., Choong, S., Rickards, D., Unwin, R. (2010). An update and practical guide to renal stone management. Nephron Clin Pract, 116: c159-171. https://doi.org/10.1159/000317196
[10] El-Zoghby, Z.M., Lieske, J.C., Foley, R.N., Bergstralh, E.J., Li, X., Melton, L.J., et al. (2012). Urolithiasis and the risk of ESRD. Clinical Journal of American Society of Nephrology, 7(9): 1409-1415. https://doi.org/10.2215/CJN.03210312
[11] Keddis, M.T., Rule, A.D. (2013). Nephrolithiasis and loss of kidney function. Current Opinion in Nephrology and Hypertension, 22(4): 390-396. https://doi.org/10.1097/MNH.0b013e32836214b9
[12] Rule, A.D., Krambeck, A.E., Lieske, J.C. (2011). Chronic kidney disease in kidney stone formers. Clin J Am Soc Nephrol, 6: 2069-2075. https://doi.org/10.2215/CJN.10651110
[13] Shoag, J., Halpern, J., Goldfarb, D.S., Eisner, B.H. (2014). Risk of chronic and end stage kidney disease in patients with nephrolithiasis. The Journal of Urology, 192(5): 1440-1445. https://doi.org/10.1016/j.juro.2014.05.117
[14] Finlayson, B. (1978). Physicochemical aspects of urolithiasis. Kidney International, 13: 344-360. https://doi.org/10.1038/ki.1978.53
[15] Atakan, I.H., Kaplan, M., Seren, G., Aktoz, T., Gül, H., Inci, O. (2007). Serum, urinary and stone zinc, iron, magnesium and copper levels in idiopathic calcium oxalate stone patients. International Urology and Nephrology, 39: 351-356. https://doi.org/10.1007/s11255-006-9050-4
[16] Bazin, D., Chevallier, P., Matzen, G., Jungers, P., Daudon, M. (2007). Heavy elements in urinary stones. Urological Research, 35: 179-184. https://doi.org/10.1007/s00240-007-0099-z
[17] Singh, V.K., Rai, P.K. (2014). Kidney stone analysis techniques and the role of major and trace elements on their pathogenesis: A review. Biophysical Reviews, 6: 291-310. https://doi.org/10.1007/s12551-014-0144-4
[18] Bazin, D., Letavernier, E., Haymann, J.P., Tielens, F., Kellum, A., Daudon, M. (2016). Shedding light on the morphology of calcium oxalate monohydrate crystallites present in kidney biopsies in the case of hyperoxaluria. Comptes Rendus Chimie, 19(11-12): 1548-1557. https://doi.org/10.1016/j.crci.2016.02.004
[19] Daudon, M., Doré, J.C., Jungers, P., Lacour, B. (2004). Changes in stone composition according to age and gender of patients: A multivariate epidemiological approach. Urological Research, 32: 241-247. https://doi.org/10.1007/s00240-004-0421-y
[20] Kasidas, G.P., Samuell, C.T., Weir, T.B. (2004). Renal stone analysis: Why and how? Annals of Clinical Biochemistry: International Journal of Laboratory Medicine, 41(2): 91-97. https://doi.org/10.1258/000456304322879962
[21] Schubert, G. (2006). Stone analysis. Urological Research, 34: 146-150. https://doi.org/10.1007/s00240-005-0028-y
[22] Bazin, D., Daudon, M., Combes, C., Rey, C. (2012). Characterization and some physicochemical aspects of pathological microcalcifications. Chemical Reviews, 112(10): 5092-5120. https://doi.org/10.1021/cr200068d
[23] Daudon, M., Bazin, D. (2013). When the Synchrotron radiations highlight the Randall’s plaques and kidney concretions. Journal of Physics: Conference Series, 425: 022006. https://doi.org/10.1088/1742-6596/425/2/022006
[24] Fazil Marickar, Y.M., Lekshmi, P.R., Varma, L., Koshy, P. (2009). Elemental distribution analysis of urinary crystals. Urological Research, 37: 277-282. https://doi.org/10.1007/s00240-009-0203-7
[25] Moreno-Gordaliza, E., Giesen, C., Lázaro, A., Esteban-Fernández, D., Humanes, B., Cañas, B., Panne, U., Tejedor, A., Jakubowski, N., Milagros Gómez-Gómez, M. (2011). Elemental bioimaging in kidney by LA-ICP-MS as a tool to study nephrotoxicity and renal protective strategies in cisplatin therapies. Analytical Chemistry, 83(20): 7933-7940. https://doi.org/10.1021/ac201933x
[26] Singh, V.K., Rai, A.K. (2011). Prospects for laser-induced breakdown spectroscopy for biomedical applications: a review. Lasers in Medical Science, 26: 673-687. https://doi.org/10.1007/s10103-011-0921-2
[27] Basiri, A., Taheri, M., Taheri, F. (2012). What is the state of the stone analysis techniques in urolithiasis? Urol J, 9(2): 445-554.
[28] Sinha, D., Anwar, K., Kumari, K., Jaishwal, S., Madeshwaran, S., Keshari, S., et al. (2012). Studies on the dielectric properties of natural urinary stones. Advanced Materials Research, 584: 484-488. https://doi.org/10.4028/www.scientific.net/AMR.584.484.
[29] Yagyik, Y., Lal, N., Talwar, I.M., Jethi, R.K. (1989). Electrical conductivity of kidney stones. Biomaterials, 10(4): 281-285.
[30] Wagner, C.A., Mohebbi, N. (2010). Urinary pH and stone formation. J Nephrol, 23(Suppl 16): S165-169.
[31] Pozar, D.M. (2002). Microwave Engineering (4ed). John Wiley & Sons, New York.
[32] Bihl, G., Meyers, A. (2001). Recurrent renal stone disease-advances in pathogenesis and clinical management. Lancet Lond Engl, 358(9282): 651-656. https://doi.org/10.1016/S0140-6736(01)05782-8
[33] Bono, M.J., Reygaert, W.C. (2019). Urinary Tract Infection. StatPearls Publishin. https://www.ncbi.nlm.nih.gov/books/NBK470195/
[34] Ratkalkar, V.N., Kleinman, J.G. (2011). Mechanisms of stone formation. Clinical Reviews in Bone and Mineral Metabolism, 9: 187-197. https://doi.org/10.1007/s12018-011-9104-8
[35] Rainsbury, P.G., Fabricius, M., McLarty, E. (2011). Management of urinary incontinence in primary care. InnovAiT, 4(1): 23-30. https://doi.org/10.1093/innovait/inq041
[36] Oxalate (Urine) — Health Encyclopedia — University of Rochester Medical Center n.d. https://www.urmc.rochester.edu/encyclopedia/content.aspx?contenttypeid=167&contentid=oxalate_urine, accessed on Jul. 25, 2018.
[37] Daudon, M., Letavernier, E., Frochot, V., Haymann, J.P., Bazin, D., Jungers, P. (2016). Respective influence of calcium and oxalate urine concentration on the formation of calcium oxalate monohydrate or dihydrate crystals. Comptes Rendus Chimie, 19(11-12): 1504-1513. https://doi.org/10.1016/j.crci.2016.08.009
[38] Conte, A., Genestar, C., Grases, F. (1990). Relation between calcium oxalate hydrate form found in renal calculi and some urinary parameters. Urol Int, 45: 25-27. https://doi.org/10.1159/000281653
[39] Barniville, H.T.F., Misk, R. (1959). Urinary glucuronic acid excretion in liver disease and the effect of a salicylamide load. Br Med J, 1: 337-340. https://doi.org/10.1136/bmj.1.5118.337
[40] Roxe, D.M. (1990). Urinalysis. In: Walker HK, Hall WD, Hurst JW, editors. Clin. Methods Hist. Phys. Lab. Exam. 3rd ed., Boston: Butterworths.
[41] Williamson, M.A., Snyder, L.M. (Eds.). (2011). Wallach's interpretation of diagnostic tests (9th ed.). Philadelphia, PA: Lippincott Williams & Wilkins. Wilson, W.
[42] Williams, J.D., Coles, G.A. (1994). Proteinuria—a direct cause of renal morbidity? Kidney Int, 45: 443-450.
[43] Golowasch, J., Thomas, G., Taylor, A.L., Patel, A., Pineda, A., Khalil, C., Nadim, F. (2009). Membrane capacitance measurements revisited: dependence of capacitance value on measurement method in nonisopotential neurons. J Neurophysiol, 102(4): 2161-2175. https://doi.org/10.1152/jn.00160.2009
[44] Bao, J.Z., Davis, C.C., Schmukler, R.E. (1992). Frequency domain impedance measurements of erythrocytes. Constant phase angle impedance characteristics and a phase transition. Biophys J, 61: 1427-1434. https://doi.org/10.1016/S0006-3495(92)81948-3
[45] Medeiros, M.C.R., Mestre, A., Inácio, P., Asgarif, S., Araújo, I.M., Hubbard, P.C., Velez, Z., Leonor Cancela, M., Rocha, P.R.F., de Leeuw, D.M., Biscarini, F., Gomes, H.L. (2016). An electrical method to measure low-frequency collective and synchronized cell activity using extracellular electrodes. Sens Bio-Sens Res, 10: 1-8. https://doi.org/10.1016/j.sbsr.2016.06.002
[46] Streit, J., Tran-Ho, L.C., Königsberger, E. (1998). Solubility of the three calcium oxalate hydrates in sodium chloride solutions and urine-like liquors. Monatshefte für Chemie / Chemical Monthly, 129: 1225-1236. https://doi.org/10.1007/PL00010134
[47] Habeger, C.F., Condon, C.E., Khan, S.R., Adair, J.H. (1997). Evaluation of the calcium oxalate monohydrate Hamaker constant based on static dielectric constant determination and electronic polarization. Colloids and Surfaces B: Biointerfaces, 10(1): 13-21. https://doi.org/10.1016/S0927-7765(97)00044-1
[48] Szarvas, T., Kovalszky, I., Bedi, K., Szendroi, A., Majoros, A., Riesz, P., Füle, T., László, V., Kiss, A., Romics, I. (2007). Deletion analysis of tumor and urinary DNA to detect bladder cancer: urine supernatant versus urine sediment. Oncol Rep, 18(2): 405-409.
[49] Dolscheid-Pommerich, R.C., Klarmann-Schulz, U., Conrad, R., Stoffel-Wagner, B., Zur, B. (2016). Evaluation of the appropriate time period between sampling and analyzing for automated urinalysis. Biochemia Medica, 26(1): 82-89. https://doi.org/10.11613/BM.2016.008
[50] Brooks, T., Keevil, C.W. (1997). A simple artificial urine for the growth of urinary pathogens. Letters Applied Microbiology, 24(3): 203-206. https://doi.org/10.1046/j.1472-765X.1997.00378.x
[51] Durcik, Z., Paralic, J., Kusnir, J., Dubayova, K. (2008). Decomposition of spectral data from analysis of biological materials. 2008 6th Int. Symp. Appl. Mach. Intell. Inform., Herlany, Slovakia, pp. 285-289. https://doi.org/10.1109/SAMI.2008.4469184
[52] Kumar, V., Peña de la Vega, L., Farell, G., Lieske, J.C. (2005). Urinary macromolecular inhibition of crystal adhesion to renal epithelial cells is impaired in male stone formers. Kidney International, 68(4): 1784-1792. https://doi.org/10.1111/j.1523-1755.2005.00595.x
[53] Manissorn, J., Fong-ngern, K., Peerapen, P., Thongboonkerd, V. (2017). Systematic evaluation for effects of urine pH on calcium oxalate crystallization, crystal-cell adhesion and internalization into renal tubular cells. Scientific Reports, 7. https://doi.org/10.1038/s41598-017-01953-4
[54] Mills, M.R., Arias-Salazar, K., Baynes, A., Shen, L.Q., Churchley, J., Beresford, N., et al. (2015). Removal of ecotoxicity of 17α-ethinylestradiol using TAML/peroxide water treatment. Scientific Reports, 5: 10511. https://doi.org/10.1038/srep10511
[55] Ricken, B., Kolvenbach, B.A., Bergesch, C., Benndorf, D., Kroll, K., Strnad, H., Vlček, Č., Adaixo, R., Hammes, F., Shahgaldian, P., Schäffer, A., Kohler, H.P.E., Corvini, P.F.X. (2017). FMNH 2 -dependent monooxygenases initiate catabolism of sulfonamides in Microbacterium sp. Strain BR1 subsisting on sulfonamide antibiotics. Scientific Reports, 7: 15783. https://doi.org/10.1038/s41598-017-16132-8
[56] Miller, G.H., Vermeulen, C.W., Moore, J.D. (1985). Calcium Oxalate Solubility in Urine: Experimental Urolithiasis XIV. Journal of Urology, 79(3): 607-612. https://doi.org/10.1016/S0022-5347(17)66314-6