Khelfaoui Abderrahmane* | Tamali Mohammed | Adjlout Houari | Dahbi Abdeldjalil
OPEN ACCESS
This paper presents a solar air collector heater, which is a backup solution to reduce the energy costs caused with any other heating mode. The idea is to use solar energy for heating air and send it into the house. Solar air heating power technologies is entirely free, renewable and clean energy source, which limits the conventional energy costs increasing. These systems absorb direct sunlight to produce heat energy, and then it heats air which circulates throughout the building. In the autumn and winter, ventilation and heating requirements play an important role in the household budget. Solar air collectors are used to drive out moisture, improve air quality and provide free heating. This device can easily be integrated on roofs of a new building or added to an existing building where it reduces the amount of energy expended to heat the premises as a backup solution; thus, it can be put for drying of the agro-food products.
drying of agro-food products, solar air collector, solar air heating, renewable energy in buildings, PV, thermal
In this paper, an active air heating system is realized by glass panel called "solar air heater" using solar energy [1]. In this system the fresh air is pulsed using a fan supplied by a photovoltaic cell, this air is sucked into aluminum tubes where it is heated and sent directly into the interior space.
The idea is to use solar energy to heat air and send it into a living room in order to drive out the moisture [2-4], used for drying of food products [5] or use it as auxiliary heating.
This solar collector is oriented towards the south, the air taken from the lower part of the sensor under the absorber is then heated up; this latter flows to upper side.
Several studies have been carried out to improve the thermal performances of air-blast sensors; Rommel and Moock [6] theoretically studied the height effect of the rectangular channel on the efficiency factor of the absorber. Njomo et al. [7] carried out a very extensive study on an air solar plane sensor with combined plastic-glass cover. Also, an analysis of the influence of various parameters, as the fluid inlet temperature, the mass flow rate of this fluid, the distance between the absorber and the combined system of covers on the thermal behavior of the sensor were done. Ferahat et al. [8] made a numerical study of natural convection at the level of the immobile air space (between the absorber and the glass) of the solar collector and they determined the influence of the variation of the glass distance - absorber on the absorber temperature and the flow of loss.
In this work, we study the behavior of the sensor under the addition of an active convection using a fan supplied by a photovoltaic cell to pulse the air in the collector. The inclination of the support being fixed at the optimal Adrar latitude (28°), Algeria [9]. In addition, the realized solar collector is equipped by the inclination setting angle adjustment from 27° to 40°, this advantage allows to install it in different places and latitudes (such as Ghardaia, El-Bayadh and localities…).
The remainder of this paper is organized as follows: section 2 introduces a description and composition of the solar air collector and the principle of operation, section 3 describes the design and realization of an air solar heater in which we present: Characteristics of the solar air heater, Different phases of realization, Operating procedure and Calculation of the mass air flow. The section 4 introduces the results and measures in which we present a Theoretical approach and a visualization of the curves obtained. The section 5 describes the results and discussion followed by a calculation of factors removal factor efficiency (FR), overall heat loss coefficient (UL) and Comparison with the results found in the literature. We end with a conclusion.
2.1 Description and composition of the solar air collector
Many kinds of solar heater are used, in our study; the solar air used is a glassed collector composed of the same elements as a water sensor (for solar water heaters):
• The glazing: has a good light transmission which is absorbed by the sensor.
• The absorber: this is the part that absorbs the heat, the air passes through this part becomes warm (in our case: aluminum channels in the form of parallelipedic tubes of 5 cm side are painted in mat black). As the used material is darker, as the heat absorption coefficient is higher.
• Insulation: was made by isolator (glass wool), its purpose is to limit the conduction heat losses.
• The box: ensures the structural solidity of the assembly, in addition, it is insulated from all other parts for limiting the thermal losses.
2.2 Principle of operation
Since the glass has the property of allowing almost all the solar radiation to pass, it absorbs the infrared rays which are the origin of the heat, but it does not let them go out. This effect of heat accumulation behind a transparent wall is known as the greenhouse effect.
The air is admitted from the bottom of the sensor and flows in sealed aluminum tubes by using a 6 watt fan supplied by a 10 watt photovoltaic cell. Then the air becomes hot under the glazing exposed to the sun.
It is found that the temperature of the air collected from the top of the sensor is raised to (more than 40°C).
3.1 Characteristics of the solar air heater
We give below the design parameters of the air collector (as shown in Table 1).
Table 1. Design parameters of collector
|
Parameters |
Symbol |
values |
|
Surface of the absorber |
Aabs |
0.5 m2 |
|
Total surface of the collector |
Ac |
0.73 m2 |
|
Surface of the PV cell |
$\mathrm{A}_{\mathrm{pv}}$ |
0.067 m2 |
|
PV cell Power |
PPV |
10 watt |
|
Fan power |
PF |
6 watt |
|
Transmissivity of glass |
$\tau$ |
0.95 |
|
Absorptivity of Absorber |
$\alpha$ |
0.8 |
|
Product $\alpha \tau$ |
$\alpha \tau$ |
0.76 |
|
Air inlet diameter |
Dic |
0.081 m |
|
Air outlet diameter |
DoF |
0.0717 m |
|
Fan diameter |
DF |
0.1192 m |
|
Air specific heat |
Cp |
1004 J/kg.K |
|
Density of air |
$\rho$ |
1.225 kg/m3 |
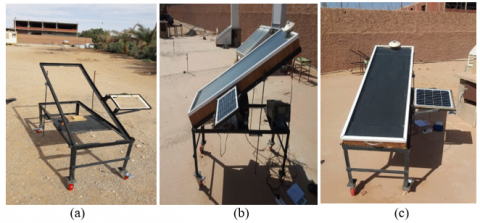
- Construction of the wooden box (dimensions: 146x50 cm2)
- Insulation with glass wool with a thickness of 3cm on the side and 5 cm on the bottom
- Laying aluminum tubes of 5 cm side used as absorber.
- Realization of the entrance and exit chambers.
- Painting of aluminum tubes with a mat black paint.
- Installation of 4 mm glazing thickness and waterproofing.
- Making a metal support with adjustable inclination between 27° and 40°.
Figure 1. Phases of realization
3.3 Operating procedure
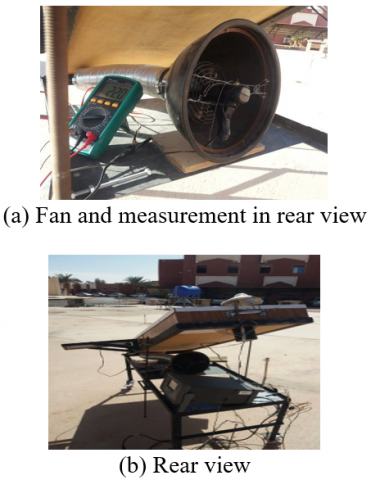
The used material for data collection is as follows:
The measurement of diameters and the fan speed were carried out by means of a numerical optical Tachometer and a vernier caliper (The measuring devices are as shown in Figure 2).
Figure 2. Pictures taken with mounting of measuring devices
The configuration of the data acquisition channels has been done in accordance with Table 2:
Table 2. Thermocouples and pyranometer legend
|
Channel |
Designation |
Code |
Color |
Type |
|
3 |
Inlet air temperature (°C) |
$\mathrm{T}_{\mathrm{i}}$ |
yellow |
K |
|
4 |
Outlet air temperature (°C) |
$\mathrm{T}_{\mathrm{o}}$ |
yellow |
K |
|
5 |
Middle Air temperature (°C) |
$\mathrm{T}_{\mathrm{air}}$ |
black |
J |
|
6 |
Ambient temperature (°C) |
$\mathrm{T}_{\mathrm{amb}}$ |
black |
J |
|
7 |
Middle Absorber temperature (°C) |
$\mathrm{T}_{\mathrm{abs}}$ |
Blue / Brown |
K |
|
1 |
Pyranometer (w/m2) |
G |
|
KIPP & ZONEN |
In our experiment, the sensor orientation was kept fixed exactly toward south and the inclination of the sensor was set at 28° corresponding to the latitude of Adrar city, southern Algeria.
Simplifying hypotheses.
In order to simplify the analyst, we assume that:
The air density remains independent of the temperature throughout the experiment and equal to 1.225 kg/m3.
The air is dry; we neglect the effect of moisture.
The air mass flow rate is constant during the experiment.
The air specific heat capacity in the temperature range (0-100°C) is constant and equals to 1004 J / kg.K
3.4 Calculation of quantities VF, qv, qm
$\mathrm{D}_{\mathrm{F}}, \mathrm{D}_{\mathrm{oF}}, \mathrm{D}_{\mathrm{ic}}$ denote the diameters of the fan, the outlet duct of the latter and the diameter of the input of the sensor, respectively. With $\mathrm{D}_{\mathrm{F}}=11.92 \mathrm{cm}, \mathrm{D}_{\mathrm{oF}}=7.17 \mathrm{cm}$ and $\mathrm{D}_{\mathrm{ic}}=8.1 \mathrm{cm}$ (as shown in Table 1).
We obtained the following speeds: $V_{i}=V_{F}\left(D_{o F} / D_{i c}\right) 2=$ $0.783 . \mathrm{V}_{\mathrm{F}}, \mathrm{V}_{\mathrm{F}}=\pi \mathrm{D}_{\mathrm{F}} \Omega / 60 ;$ then: $\mathrm{V}_{\mathrm{i}}=4.88610^{-3} . \Omega$ and $\mathrm{q}_{\mathrm{V}}=\mathrm{V}_{\mathrm{i}} \mathrm{S}_{\mathrm{i}}=\mathrm{V}_{\mathrm{i}} \cdot \pi \cdot \mathrm{D}_{\mathrm{ic}}^{2} / 4=2.517 \mathrm{x} 10^{-5} \cdot \Omega ; \mathrm{qm}=\rho \mathrm{q}_{\mathrm{V}}$
We present below the sensor results of both days 03/10/2019 and 06/10/2016, where the wind speeds were respectively 8m/s and 6m/s. We continued the experience in 24th October. The hourly average values of the irradiation and temperature values were calculated using Microsoft Excel software (as shown in Table 3~5).
It is observed that the outlet temperature is always higher than the inlet temperature whatever the day and the weather conditions, which means that the solar collector is efficient.
Table 3. Hourly average values of quantities irradiation and temperatures in 03/10/2019
|
G (w/m2) |
Ti (°C) |
To (°C) |
Tair (°C) |
Tamb (°C) |
Tabs °C) |
DT=To-Ti |
|
|
9h |
761.70 |
33.25 |
66.29 |
69.34 |
32.35 |
70.47 |
33.04 |
|
10h |
929.41 |
37.90 |
75.78 |
80.99 |
37.14 |
82.15 |
37.88 |
|
11h |
1052.98 |
39.37 |
89.28 |
92.05 |
40.26 |
92.88 |
49.91 |
|
12h |
1096.15 |
39.01 |
98.98 |
97.41 |
42.02 |
99.35 |
59.97 |
|
13h |
1040.69 |
39.23 |
99.77 |
95.63 |
43.71 |
98.57 |
60.54 |
|
14h |
911.06 |
39.97 |
96.78 |
92.92 |
46.81 |
95.23 |
56.82 |
|
15h |
701.54 |
40.68 |
88.17 |
86.04 |
48.77 |
87.35 |
47.49 |
|
16h |
481.29 |
39.56 |
82.25 |
79.64 |
49.97 |
81.13 |
42.69 |
|
G (w/m2) |
Ti (°C) |
To (°C) |
Tair (°C) |
Tamb (°C) |
Tabs (°C) |
DT=To-Ti |
|
|
9h |
707.95 |
31.43 |
56.43 |
58.87 |
31.14 |
60.11 |
25.00 |
|
10h |
935.88 |
35.63 |
84.00 |
84.79 |
38.24 |
85.28 |
48.37 |
|
11h |
1075.07 |
39.06 |
100.01 |
99.12 |
41.55 |
99.39 |
60.95 |
|
12h |
1133.22 |
39.45 |
106.82 |
102. |
45.46 |
104.72 |
67.37 |
|
13h |
897.20 |
40.33 |
100.61 |
96.54 |
48.80 |
98.17 |
60.28 |
|
14h |
966.39 |
41.09 |
99.07 |
94.99 |
51.68 |
97.28 |
57.98 |
|
15h |
632.80 |
41.37 |
87.95 |
85.09 |
54.71 |
85.90 |
46.58 |
|
16h |
663.96 |
40.09 |
83.32 |
79.44 |
55.70 |
81.49 |
43.22 |
|
G (w/m2) |
Ti (°C) |
To (°C) |
Tair (°C) |
Tamb (°C) |
Tabs (°C) |
DT=To-Ti |
|
|
10h |
843.74 |
24.46 |
66.90 |
66.25 |
22.42 |
67.66 |
42.44 |
|
11h |
989.71 |
27.35 |
80.41 |
77.92 |
25.14 |
79.47 |
53.05 |
|
12h |
1081.27 |
29.27 |
89.04 |
85.03 |
27.05 |
87.44 |
59.77 |
|
13h |
1079.72 |
30.60 |
93.27 |
88.52 |
28.23 |
91.33 |
62.67 |
|
14h |
1022.59 |
32.00 |
93.78 |
89.12 |
29.17 |
91.41 |
61.78 |
|
15h |
833.10 |
32.76 |
88.96 |
84.46 |
29.77 |
86.17 |
56.20 |
|
16h |
599.87 |
33.03 |
77.19 |
73.62 |
29.83 |
73.92 |
44.16 |
|
16h4’ |
434.58 |
32.83 |
68.49 |
65.23 |
29.79 |
64.44 |
35.66 |
|
16h8’ |
293.77 |
32.02 |
66.67 |
63.54 |
29.58 |
62.83 |
34.65 |
The amount of solar radiation received by the collector is given by [10]:
Q=G.A (1)
With: G [w/m2] the intensity of solar radiation, A (m2) collector surface area.
Then incident power Qi that reaches the absorber is the product of the rate of transmission of the cover glass and the absorber rate:
$Q i=G . A . \tau \alpha$ (2)
The rate of heat losses Q0 depends on the overall collector heat transfer coefficient $\mathrm{U}_{\mathrm{L}}$ and the collector temperature:
$Q 0=U_{L} \cdot A \cdot\left(T_{c}-T_{a m b}\right)$ (3)
Thus, the rate of useful energy extracted by the collector $Q_{u}$ can be expressed as following:
$Q_{u}=Q i-Q 0$
$Q_{u}=A .\left[G . \tau \alpha-U_{L} \cdot\left(T_{c}-T_{a m b}\right)\right]$ (4)
It is also known that the rate of heat extraction from the collector may be measured by means of the amount of heat carried away in the fluid passed through it, as given:
$Q_{u}=q \cdot C_{p}\left(T_{o}-T_{i}\right)$ (5)
If $\mathrm{T}_{\mathrm{c}}=\mathrm{T}_{\mathrm{i}}$ in Eq. (4), (the whole collector surface temperature becomes equal to inlet fluid temperature).
We can define a quantity which is known as the collector heat removal factor $F_{R}$, it is expressed as:
$F_{R}=q \cdot C_{p}\left(T_{o}-T_{i}\right) / A\left[G . \tau \alpha-U_{L} \cdot\left(T_{i}-T_{a m b}\right)\right]$ (6)
The actual useful energy gain $\mathrm{Q}_{\mathrm{u}}$ is found by:
$Q_{u}=F_{R} \cdot A \cdot\left[G \cdot \tau \alpha-U_{L} \cdot\left(T_{i}-T_{a m b}\right)\right.$ (7)
Eq. (7) is used for measuring collector energy gain, it is generally known by “Hottel -willier- Bliss equation” [11].
The instantaneous thermal efficiency of the collector is:
$\eta t h=\frac{Q_{u}}{A . G}=F_{R} A\left[G \tau \alpha-U_{L}\left(T_{i}-T_{a m b}\right) / A . G=-F_{R} U_{L}\left(T_{i}-\right.\right.\left.T_{a m b}\right) / G+F_{R} \tau \alpha$ (8)
If it is assumed that $\mathrm{F}_{\mathrm{R}}, \tau, \alpha, \mathrm{U}_{\mathrm{L}}$ are constants in a given collector and flow rate, then the efficiency becomes a linear function of the three parameters defining the operating conditions: solar irradiation (G), fluid inlet temperature ($\mathrm{T}_{\mathrm{i}}$) and ambient air temperature $\left(\mathrm{T}_{\mathrm{amb}}\right)$.
Table 6. Measurement report (24/10/2019)
|
10h |
11h |
12h |
13h |
14h |
15h |
16h |
16h4’ |
16h8’ |
|
|
$\mathrm{G}\left(\mathrm{w} / \mathrm{m}^{2}\right)$ |
843.7 |
989.7 |
1081.2 |
1079.7 |
1022.5 |
833.1 |
599.8 |
434.5 |
293.7 |
|
To $\left(^{\circ} \mathrm{C}\right)$ |
66.9 |
80.4 |
89.1 |
93.2 |
93.7 |
88.9 |
77.29 |
68.4 |
66.6 |
|
Tair (°C) |
64.2 |
77.9 |
85.0 |
88.5 |
89.1 |
84.4 |
73.62 |
65.2 |
63.5 |
|
Tabs (°C) |
67.6 |
79.4 |
87.4 |
91.3 |
91.4 |
86.1 |
73.92 |
64.4 |
62.8 |
|
Tamb (°C) |
22.4 |
25.1 |
27 |
28.2 |
29.1 |
29.7 |
29.83 |
29.7 |
29.5 |
|
Ti (°C) |
24.4 |
27.3 |
29.2 |
30.6 |
32 |
32.7 |
33.03 |
32.8 |
32 |
|
Tmf (°C) |
45,6 |
53,8 |
59,1 |
61,9 |
62,8 |
60,8 |
55,11 |
50,6 |
49,3 |
|
U(volt) |
4.5 |
5.7 |
6.1 |
6.7 |
5.6 |
4.5 |
3.1 |
2.3 |
1.6 |
|
I (A) |
0.53 |
0.64 |
0.68 |
0.67 |
0.62 |
0.49 |
0.36 |
0.29 |
0.18 |
|
$\mathrm{qm}=\rho \cdot \mathrm{qv}(\mathrm{kg} / \mathrm{s})$ |
12x 10-4 |
15x 10-4 |
79x 10-4 |
41x 10-4 |
38x 10-4 |
32x 10-4 |
17x 10-4 |
7x 10⁻⁴ |
0 |
|
$\mathrm{qv}\left(\frac{\mathrm{m} 3}{\mathrm{s}}\right)=2.517 \mathrm{x} 10^{-5} \Omega$ |
10x 10-4 |
13x 10-4 |
64x 10-4 |
33x 10-4 |
31x 10-4 |
26x 10-4 |
14x 10-4 |
6x 10⁻⁴ |
0
|
|
$\mathrm{Vi}(\mathrm{m} / \mathrm{s})=4.886 \mathrm{x} 10^{-3} \Omega$ |
1.89 |
2.44 |
12.52 |
6.47 |
5.96 |
5.03 |
2.62 |
1.15 |
0 |
|
$\Omega(\operatorname{tr} / \mathrm{mn})$ |
386.5 |
499.8 |
2562 |
1324 |
1220 |
1029 |
536.8 |
235 |
0 |
|
Time/Parameters |
10h |
11h |
12h |
13h |
14h |
15h |
16h |
16h4’ |
16h8’ |
|
$\mathrm{Q}_{\mathrm{u}}=\mathrm{q}_{\mathrm{m}} \mathrm{x} \mathrm{C}_{\mathrm{p}}\left(\mathrm{T}_{\mathrm{o}}-\mathrm{T}_{\mathrm{i}}\right)$ |
76.1 |
123.1 |
711 |
385.3 |
349.9 |
268.5 |
110 |
38.9 |
0 |
|
Thermal Efficiency $\eta_{\mathrm{th}}=\mathrm{Q}_{\mathrm{u}} / \mathrm{Aabs.G}$ |
0.120 |
0.165 |
0.876 |
0.475 |
0.456 |
0.429 |
0.244 |
0.119 |
0 |
|
$\left(\mathrm{T}_{\mathrm{i}}-\mathrm{T}_{\mathrm{amb}}\right) / \mathrm{GX} 10^{-4}$ |
24 |
22 |
21 |
22 |
28 |
36 |
53 |
70 |
83 |
$\eta t h=Q_{u} / A . G=q m \cdot C_{p}\left(T_{o}-T_{i}\right) / A . G$ (9)
During tests, the electrical outputs (current Im, and voltage Vm) of PV module connected to the fan were measured. The electrical efficiency $\eta el$ for the aperture area $\mathrm{A}_{\mathrm{pv}}$ is calculated using relation below [13]:
Im. V $m / A_{p v} . G$ (10)
Tables 6 and 7 represents the measurement report of (24/10/2019).
We present below the different curves generated by the measurements made in 03-06 and 24th October 2019 for analysis.
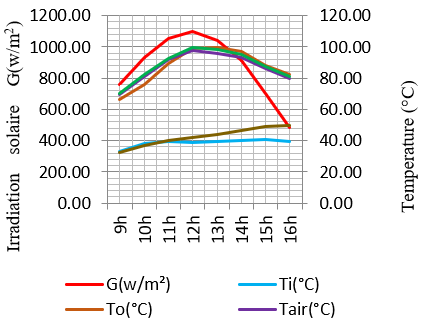
Figure 3. Temperature evolution as a function of solar irradiation (03/10/2019)
Figure 4. Temperature evolution as a function of solar irradiation (06/10/2019)
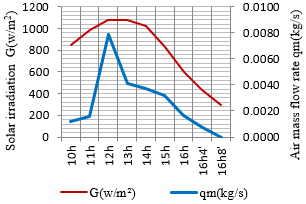
Figure 5. Air mass flow rate as a function of solar irradiation (24/10/2019)
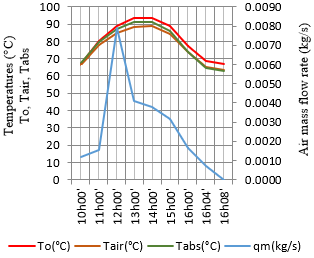
Figure 6. Effect of air mass flow rate (qm) on Temperatures (To, Tair, Tabs)
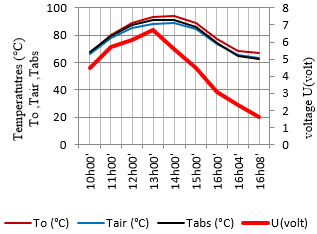
Figure 7. Effect of voltage U on temperatures (To, Tair, Tabs)
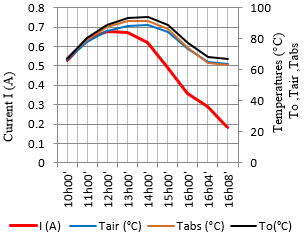
Figure 8. Effect of current I, on (To, Tair, Tabs)
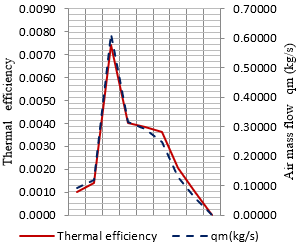
Figure 9. Effect of air mass flow on thermal efficiency
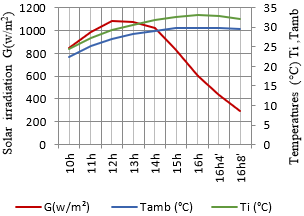
Figure 10. Temperature evolution (Ti,Tamb) as a function of solar irradiation G
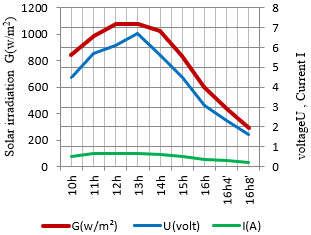
Figure 11. Effect of solar irradiation G on voltage and current
Figure 12. Thermal efficiency as a function of reduced temperature (Ti -Tamb)/G
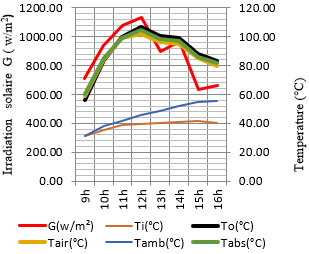
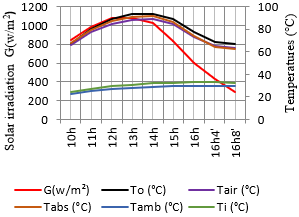
Figure 13. Temperature evolution as a function of solar irradiation (Day of 24/10/2019)
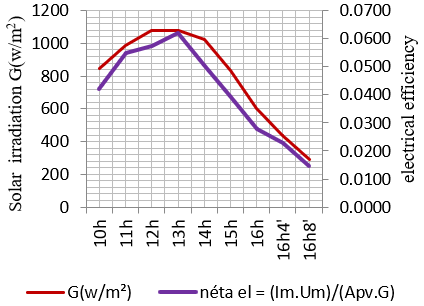
Figure 14. Effect of solar irradiance G on electrical efficiency
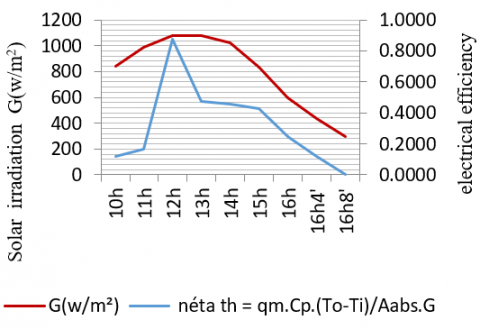
Figure 15. Effect of solar irradiance G on thermal efficiency
Absorber temperatures, air temperatures in the middle of the channel, and collector output are directly proportional with the solar irradiation (as shown in Figures 3, 4 and 13).
The air mass flow rate is also proportional with the solar irradiation; it is maximum around 12h (as shown in Figures 5 and 6).
The electric photovoltaic power (the current and voltage) supplying the fan is proportional with the solar irradiation, as a result the air mass flow increases (as shown in Figures 7, 8 and 11).
The results show the solar irradiation is proportional with the thermal efficiency and electrical PV power, as a result, when this letter increases, the mass flow rate increases thanks to the improvement of the heat transfer (as shown in Figure 9). However, the solar irradiation does not have a big influence on the air inlet temperature $\left(T_{i}\right)$ and the ambient temperature $\left(\mathrm{T}_{\mathrm{amb}}\right)$ due to its inertia (as shown in Figure 10 ).
The linear trend curve of the thermal efficiency as a function of the reduced temperature is a line of equation y=-0.0322x+0.4819 (as shown in Figure 12).
The glazed sensor greatly improves the performance of the air solar heater. It typically reaches a difference in temperature DT of 50 °C in good sunlight, but drops rapidly when the solar irradiations drop. We note that this difference varies between 34°C and 62°C in 24/10/2019 and remains above 40°C even after 16h00mn (as shown in Table 5).
It is found that for a solar irradiation equals to 294 w /m2 the fan stops. This is due to the minimum corresponding power equal to 0.288 watt.
5.1 Calculation of factors $\mathbf{F}_{\mathbf{R}}$ and $\mathbf{U}_{\mathbf{L}}$
The collector efficiency $\eta t h$ is plotted against the reduced temperature (Ti- Tamb)/G, by combining the two Eqns. (8) and ( 9) from the measured quantities $(\mathrm{q}, \mathrm{Cp}, \mathrm{To}, \mathrm{Ti}, \mathrm{A}, \mathrm{G}),[5]$. The slope of this line $\left(-\mathrm{F}_{\mathrm{R}} \mathrm{U}_{\mathrm{L}}\right)$ represents the rate of heat loss from the collector Eq. ( 8 ).
The linear trend curve of the yield has the form:
$y=-0.0322 x+0.4819$
Therefore: $\mathrm{F}_{\mathrm{R}} .(\tau \alpha)=0.4819$ and $\mathrm{F}_{\mathrm{R}} \mathrm{U}_{\mathrm{L}}=0.0322 .$ With $\tau \alpha=0.76 ; \mathrm{F}_{\mathrm{B}}=0.63, \mathrm{U}_{\mathrm{k}}=0.05\left(\mathrm{w} / \mathrm{m}^{2} . \mathrm{K}\right)$.
The intercept $\left(\mathrm{F}_{\mathrm{R}} \tau \alpha\right)$ and slope $\left(\mathrm{F}_{\mathrm{R}} \mathrm{U}_{\mathrm{L}}\right)$ represent the thermal efficiency of the collector at zero reduced temperature and energy losses of collector, respectively. Where $U_{L }$ is the overall collector heat losses, $\mathrm{F}_{\mathrm{R}}$ is the heat removal efficiency factor.
Thus, the performance of a flate-plate collector can be approximated by measuring these three parameters in experiments $\left(\mathrm{T}_{\mathrm{i}}, \mathrm{T}_{\mathrm{amb}}, \mathrm{G}\right)$ the result is a single line $(\Delta \mathrm{T} / \mathrm{G}-curve) shown in Figure 12 .$
As it is found according to the heat removal efficiency factor and he overall collector heat, the realized solar air heater was well built.
5.2 Comparison with the results found in the literature
In the literature, we find an approximate formula of thermal efficiency [14-16].
$\eta=\eta_{0}-\left(U_{1}\left(T_{m f}-T_{a m b}\right) / G\right)-U_{2}\left(\left(T_{m f}-T_{a m b}\right)^{2} / G\right)$ (11)
where,
$\mathrm{T}_{\mathrm{mf}}:$ The average temperature between the heat transfer fluid inlet temperature and its outlet temperature (at about 60°C)
$\mathrm{T}_{\mathrm{amb}}:$ Ambient temperature
$\mathrm{U}_{1}, \mathrm{U}_{2}:$ Heat losses coefficients by conduction and convection in (W / (m2.K))
G: Solar irradiation in w/m2
The typical 2011-2012 values for glazed and tube collectors (from the Swiss SPF (Solartechnik Prüfung Forshung) test results are as follows (for absorber surfaces):
$\eta_{0}$ worth around 0.8
$\mathrm{U}_{1}$ worth around 1.5 for tubes, 4 for plans
$\mathrm{U}_{2}$ varies widely from 0.001 to 0.15 and above, for both tubes and planes.
The differences in performance and the progress made are mainly on the reduction of convective (insulation) and radiation losses (optimization of absorbent bodies and glasses).
In our case, it is found that the mean temperature Tmf is about 60°C (Table 6). Thus the Eq. (11) can be applied. We can consider two possible cases:
First case: $\mathrm{T}_{\mathrm{mf}}=59.16 \quad\left(^{\circ} \mathrm{C}\right), \quad \mathrm{T}_{\mathrm{amb}}=27.05 \quad\left(^{\circ} \mathrm{C}\right)$ and $\mathrm{G}=1081.27\left(\mathrm{w} / \mathrm{m}^{2}\right)$
Second case: $\mathrm{T}_{\mathrm{mf}}=61.94\left(^{\circ} \mathrm{C}\right), \mathrm{T}_{\mathrm{amb}}=28.23\left(^{\circ} \mathrm{C}\right)$ and $\mathrm{G}=1079.22\left(\mathrm{w} / \mathrm{m}^{2}\right)$
The calculation of the thermal efficiency $\eta$ is given by Table 8
Table 8. Values of the thermal efficiencies of the studied cases
|
|
First case |
Second case |
|
|
G=1081.27 (w/m2) Tmf =59.16 (°C) Tamb=27.05 (°C) |
G=1079.22 (w/m2) $\mathrm{T}_{\mathrm{mf}}$=61.94 (°C) $\mathrm{T}_{\mathrm{amb}}$=28.23 (°C) |
|
$\mathrm{U}_{1}$ =4; $\mathrm{U}_{2}$ =0.001 |
$\eta$=68 % |
$\eta$=67.4 % |
|
$\mathrm{U}_{1}$=4; $\mathrm{U}_{2}$=0.15 |
$\eta$=54 % |
$\eta$=51.7 % |
Based on the present studies, the analysis of the output temperature values obtained by the realized solar air collector is significantly higher than 60°C between 10h and 16h; this allows us to conclude that the device is able to capture the solar energy in order to:
Warm and sanitize the ambient air of a room in the house: The device, located should be outside the house.
Drying of food products: In warmer countries, solar air heating can be used for more demanding operations such as drying crops.
To ensure a backup solution: An aerosol sensor alone cannot be a heating solution for a home, solar heat input being irregular depending on the season, in winter, it is better to preheat air for barns and other buildings. On the other hand, it allows limiting the energy expenditure caused by older heating mode.
Eliminate moisture: This device avoids the accumulation of moisture and it maintains a correct temperature without energy costs.
Excluding initial costs, the produced energy is free. Solar air heating is an environment friendly device; it requires only a regular maintenance.
We suggest in the future to optimize the performance of the solar air heater by using double glazing and a material from recovery, which will thus minimize the weight of the collector.
This work was carried out in the thermal and thermodynamic conversion division, "solar heating" section of the research unit in renewable energies in the Saharan environment Adrar, Algeria attached to the CDER renewable energy development center.
|
A |
Area, m2 |
|
G |
solar irradiation, w/m2 |
|
q |
Mass flow rate, kg/s |
|
Ti |
inlet temperature of the air, °C |
|
To |
outlet temperature of the air, °C |
|
Tair |
Air temperature in the middle of the collector, °C |
|
Tabs |
absorber temperature in the middle of the collector, °C |
|
Tamb |
ambient temperature, °C |
|
UL |
overall heat loss coefficient, w/m2.K |
|
FR |
Removal factor efficiency, / |
|
PPV |
Power of the PV cell, Watt |
|
PF |
Fan power, Watt |
|
VF |
Fan speed, m/h |
|
Ω |
fan rotation speed, Rpm |
|
Cp |
Air specific heat, J/kg.K |
|
qv |
volume flow rate, m3/h |
|
qm |
mass flow, kg/h |
|
Im |
Current measured, A |
|
Um |
Voltage measured, volt |
|
Q |
Thermal power, watt |
|
Greek symbols |
|
|
α |
Absorptivity of Absorber |
|
τ |
Transmissivity of glass |
|
$\eta e l$ |
electrical efficiency, % |
|
$\eta$ th |
thermal efficiency, % |
|
Subscripts |
|
|
i |
incident |
|
u |
useful |
|
o |
lost |
|
a |
absorbed |
|
t |
inertia |
[1] Bergene, T., Løvvik, O.M. (1995). Model calculations on a flat-plate solar heat collector with integrated solar cells. Solar Energy, 55(6): 453-462. http://doi.org/10.1016/0038-092x(95)00072-y
[2] Mediani, A., Moungar, H., Larbi, A.A., Loumani, A., Chaouch, W.B., Djaber, A., Tigani, C., Benatiallah, A. (2019). The isothermal sorption measurement and the isosteric heats determinations for the South Algerian date varieties. Instrumentation Mesure Métrologie, 18(4): 389-396. https://doi.org/10.18280/i2m.180408
[3] Larbi, A.A., Loumani, A., Mediani, A., Bennaceur, S., Tigani, C. (2019). Experimental measurement of moisture sorption isotherms and isosteric heat of palm hearts (Jomare) harvested in the Algerian Sahara. Instrumentation Mesure Métrologie, 18(3): 297-304. https://doi.org/10.18280/i2m.180310
[4] El-Sebaii, A.A., Shalaby, S.M. (2012). Solar drying of agricultural products: A review. Renewable and Sustainable Energy Reviews, 16(1): 37-43. https://doi.org/10.1016/j.rser.2011.07.134
[5] Kherrour, S., Bouhdjar, A., Hanini, S., Boualit, A., Lalmi, D. (2019). Numerical study of a longitudinal solar dryer in semi-arid area; case study. Instrumentation Mesure Métrologie, 18(2): 95-103. https://doi.org/10.18280/i2m.180201
[6] Rommel, M., Moock, W. (1997). Collector efficiency factor F’ for absorbers with rectangular fluid ducts contacting the entire surface. Solar Energy, 60(3-4): 199-207. https://doi.org/10.1016/s0038-092x(97)00006-6
[7] Njomo, D. (1998). Thermal behaviour of a combined plastic-glass flat plate solar air collector. Revue Générale de Thermique, 37(11): 973-980. https://doi.org/10.1016/s0035-3159(98)80022-6
[8] Ferahta, F.Z., Bougoul, S., Ababsa, D., Abid, C. (2011). Numerical study of the convection in the air gap of a solar collector. Energy Procedia, 6: 176-184. https://doi.org/10.1016/j.egypro.2011.05.021
[9] Moungar, H., Ahmed, A., Youcef, S., Aabdelkrim, H. (2017). Immersed fins influence on the double slope solar still production in south Algeria climatic condition. International Journal of Heat and Technology, 35(4): 1065-1071. https://doi.org/10.18280/ijht.350444
[10] Struckmann, F. (2008). Analysis of a flat-plate solar collector. 2008 MVK160 Heat and Mass Transport, Lund, Sweden.
[11] Florschuetz, L.W. (1979). Extension of the Hottel-Whillier model to the analysis of combined photovoltaic/thermal flat plate collectors. Solar Energy, 22(4): 361-366. https://doi.org/10.1016/0038-092X(79)90190-7
[12] Othman, M.Y., Hamid, S.A., Tabook, M.A.S., Sopian, K., Roslan, M.H., Ibarahim, Z. (2016). Performance analysis of PV/T Combi with water and air heating system: An experimental study. Renewable Energy, 86: 716-722. https://doi.org/10.1016/j.renene.2015.08.061
[13] Zondag, H.A., de Vries, D.W., van Helden, W.G.J., van Zolingen, R.J.C., van Steenhoven, A.A. (2003). The yield of different combined PV-thermal collector designs. Solar Energy, 74(3): 253-269. https://doi.org/10.1016/s0038-092x(03)00121-x
[14] Rockenbaugh, C., Dean,table J., Lovullo, D., Lisell, L., Barker, G., Hanckock, E., Norton, P. (2016). High Performance Flat Plate Solar Thermal Collector Evaluation Technical. Prepared for the General Services Administration by the National Renewable Energy Laboratory.
[15] Tchinda, R. (2008). Thermal behaviour of solar air heater with compound parabolic concentrator. Energy Conversion and Management, 49(4): 529-540. https://doi.org/10.1016/j.enconman.2007.08.004
[16] Charalambous, P.G., Maidment, G.G., Kalogirou, S.A., Yiakoumetti, K. (2007). Photovoltaic thermal (PV/T) collectors: A review. Applied Thermal Engineering, 27(2-3): 275-286. https://doi.org/10.1016/j.applthermaleng.2006.06.007