Pandu Ranga Reddy Gongati* | Ramasekhara Reddy Marala | Vijaya Kumar Malupu
© 2020 IIETA. This article is published by IIETA and is licensed under the CC BY 4.0 license (http://creativecommons.org/licenses/by/4.0/).
OPEN ACCESS
Due to limited conventional energy sources and to meet the increase of load demand there is a need for utilization of renewable energy sources. Among the all renewable energy sources wind energy is widely used and is highly sustainable as compared to other sources of energy. Many wind energy conversion devices working with doubly fed induction generators and synchronous generators and it is integrated to the grid produces the power quality issues like as voltage sags, swells, harmonics, voltage imbalance and short interruptions etc. Many power electronic based Flexible AC Transmission Systems (FACTS) are designed to solve above problems and facilitate to meet the required power demand. In this paper, UPQC (Unified Power Quality Conditioner) and IUPQC (Improved Unified Power Quality Conditioner) models are designed to mitigate the above power quality issues. In this paper, mainly voltage sags, voltage swells and harmonics are considered as a power quality issues to analyze the UPQC and IUPQC devices. The conventional PID controller is employed in control circuit of both the devices. It also discusses the comparative analysis between UPQC and IUPQC devices. The MATLAB/SIMULINK Software is used for above analysis.
improved unified power quality conditioner, power quality, wind energy conversion system, voltage sag, voltage swell
To meet the required load demand and decrease of fossil fuels, the conventional energy sources such as wind energy, solar energy, nuclear energy, fuel cell etc. are used for generation of electrical energy at generating stations. Among the all renewable energy sources the wind energy is one of the fastest development energy sources in worldwide. At present the wind energy is one of the major power suppliers to the distribution stations [1]. The total installed capacity of the wind power in India up to March 31st, 2019 was 36.625 GW. India is the fourth largest wind power capacity in the world. It expands across all the regions in India [2, 3]. Many issues are arises when the wind form is integrated to the power grid due to increase of nonlinear loads [4].
These issues are Capabilities of reactive power, Requirement of Power factor, Frequency and voltage ride-through capabilities, Impacts on base system conditions, Short circuit and stability effects, Voltage instability and Harmonics and flicker effects [5]. Hence, it is very important to mitigate the above issues. There are many power electronic based devices are introduced to reduce the power quality issues. Active Power Filters, Flexible AC Transmission Systems (FACTS) devices and Shunt capacitors etc., are comes under this category [6].
The authors of the paper [7] published the different power quality issues occurred in the distribution system and there corresponding mitigating techniques. In paper [8], the authors explained designing a fuzzy logic control based SSSC device that improves the stability of the system. The mitigation of power quality issues using Static Synchronous Compensator (STATCOM) is discussed in papers [9, 10]. Jadhao et al. [11] and Pei and Chen [12] explained the enhancement of power quality using UPQC device.
In this paper at first, UPQC model is developed for mitigating the different power quality issues. Later, improved version of UPQC known as IUPQC model is developed for mitigating the above power quality issues. Conventional PID controller is used for designing the control circuit for both the devices. MATLAB/SIMULINK Software is used for designing the models and to analyze the performance of devices.
In this paper, the concept of WECS and the proposed test system are discussed in section II, UPQC and IUPQC models and concept of conventional PID (Proportional Integral Derivative) controller are explained in section III, simulation results of with and without FACTS devices are discussed in section IV and finally in section V the conclusions of this paper is described.
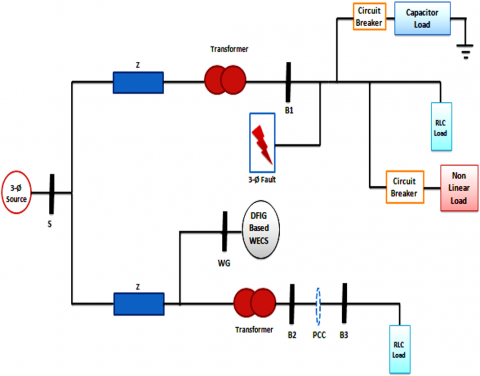
The proposed test system is shown in Figure 1. It consists of two parallel transmission lines and they are connected to the grid. For analyzing the system first, voltage sag, voltage swell and nonlinear disturbances are created in the first transmission line by including the capacitor load, creation of three phase fault and non linear load at different time instants with help of circuit breakers [13]. This results the second transmission line also experiences the sag, swell and nonlinear disturbances at different instants, because both transmission lines are connected in parallel. The second line also contain the DFIG based WECS and acted as generating source to the system. To overcome the above problems different Facts are connected to a power system at PCC. In this paper UPQC and IUPQC devices are connected at PCC (point of common coupling) point. The WECS mainly consists of wind turbine, wind generator and converter station. In this paper horizontal axis wind turbine, DFIG generating machines are modeled because of their advantages and the back to back voltage source converter called (AC-DC-AC converter) is used.
Figure 1. Single line diagram of proposed power system
2.1 Wind turbine modelling equations
The wind power developed by the turbine is given by the Eq. (1):
${{P}_{m}}=\frac{1}{2}\rho {{C}_{p}}(\lambda ,\beta ){{A}_{r}}V_{w}^{3}$ (1)
where,
ρ indicates the air density (Kgm3)
Vw is the wind speed (m/s)
Cp indicates the power coefficient
λ indicates Tip – Speed Ratio
β indicates the rotor blade pitch angle
Ar is the wind turbine rotor swept area (m2).
The power coefficient Cp can be calculated by using the following equation.
${{C}_{p}}(\lambda ,\beta )=0.73\left( \frac{151}{{{\lambda }_{i}}}-0.58\beta -0.002{{\beta }^{2.14}}-13.2 \right){{e}^{\frac{18.4}{{{\lambda }_{i}}}}}$ (2)
where,
${{\lambda }_{i}}=\frac{1}{\frac{1}{\lambda -0.02\beta }-\frac{0.003}{{{\beta }^{3}}+1}}$ (3)
and
$TSR(\lambda )=\frac{{{\omega }_{r}}{{R}_{r}}}{{{V}_{w}}}$ (4)
2.2 Wind generator modelling equations
There are many generators are available in wind energy applications. Among the all Double Feb Induction Generator (DFIG) is chosen because of its advantages. Some of advantages of DFIG machine are controlling the active and reactive powers independently; PF (Power factor) can be controlled by varying rotor voltages, getting maximum energy etc., The equivalent circuit of DFIG machine as shown in Figure 2.
Figure 2. Equivalent circuit of DFIG
Following are the design equations of DFIG machine obtained from equivalent circuit as shown in Figure 2.
${{V}_{ds}}={{R}_{s}}{{i}_{ds}}+\frac{d{{\psi }_{ds}}}{dt}-{{\omega }_{s}}{{\psi }_{qs}}$ (5)
${{V}_{qs}}={{R}_{s}}{{i}_{qs}}+\frac{d{{\psi }_{qs}}}{dt}+{{\omega }_{s}}{{\psi }_{ds}}$ (6)
${{V}_{dr}}={{R}_{s}}{{i}_{dr}}+\frac{d{{\psi }_{dr}}}{dt}-({{\omega }_{s}}-{{\omega }_{r}}){{\psi }_{qr}}$ (7)
${{V}_{qr}}={{R}_{s}}{{i}_{qr}}+\frac{d{{\psi }_{qr}}}{dt}+({{\omega }_{s}}-{{\omega }_{r}}){{\psi }_{dr}}$ (8)
The ψ stands for flux linkage and express as:
${{\psi }_{ds}}={{L}_{ss}}{{i}_{ds}}+{{L}_{m}}{{i}_{dr}}$ (9)
${{\psi }_{qs}}={{L}_{ss}}{{i}_{qs}}+{{L}_{m}}{{i}_{qr}}$ (10)
${{\psi }_{dr}}={{L}_{rr}}{{i}_{dr}}+{{L}_{m}}{{i}_{ds}}$ (11)
${{\psi }_{qr}}={{L}_{rr}}{{i}_{qr}}+{{L}_{m}}{{i}_{qs}}$ (12)
and also
${{L}_{ss}}={{L}_{s}}+{{L}_{m}}$ (13)
${{L}_{rr}}={{L}_{r}}+{{L}_{m}}$ (14)
3.1 Unified power quality conditioner (UPQC)
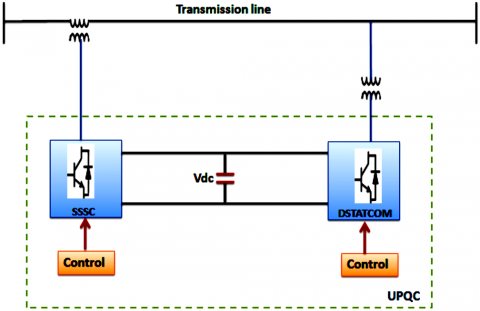
The basic circuit diagram of UPQC as shown in Figure 3. Unified Power Quality Conditioner (UPQC) is a combination of series and shunt compensation devices connected through a DC link capacitor. Voltage sags/swells, voltage unbalances, flickers and voltage harmonics are reduced using series compensation device [14, 15]. Current harmonics are reduced by using shunt compensation device. The intermediate DC link can be designed either with help of capacitor or inductor. The DC link capacitor interconnects the both shunt and series converters and maintains the constant DC bus voltage across it. The main principle of UPQC is to generate 3-phase voltages with the help of series and shunt converters. These converters are designed either voltage source type (VSI – Voltage Source Inverter) or current source type (CSI – Current Source Inverter).
Figure 3. Block diagram of unified power quality conditioner
The controlling of DC link voltage is the main role in order to achieve the desired UPQC performance. At the time of sudden load change conditions the feedback controller in the DC link can react as fast as possible to return the DC-link voltage at set reference value, with minimum delay as well as lower overshoot. The authors in papers [16, 17] developed the proportional–integral (PI)-regulator-based DC-link voltage controller in the UPQC to achieve desired response. To reduce response time of PI-controller-based approach in this paper PID controller is used in place of PI controller.
3.2 Improved Unified Power Quality Conditioner (IUPQC)
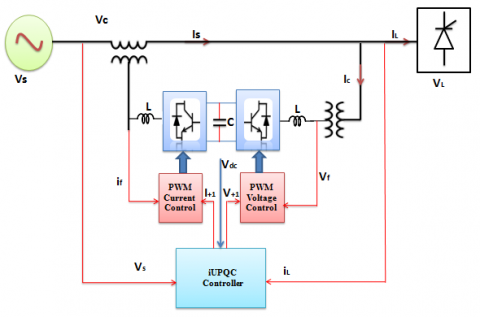
The drawbacks of UPQC can be overcome by using IUPQC. The IUPQC is similar to UPQC and contain the shunt and series converters [18]. The main difference between UPQC and IUPQC is in case of UPQC, the series power converter is controlled by non-sinusoidal voltage source and shunt converter is controlled by non-sinusoidal current source but in the case of IUPQC Shunt power converter carried out by sinusoidal voltage source and series power converter carried out by sinusoidal current source [19]. The schematic diagram of IUPQC device as shown in Figure 4. The internal control circuit of IUPQC device as shown in Figure 5.
The novel IUPQC device can perform [20]
(i) As a smart circuit breaker between grid and micro grid
(ii) Provide power flow between grid and micro grid
(iii) Boost up the Reactive power at series converter station
(iv) Compensating the voltage/frequency at shunt converter station
(v) Harmonic voltage and current isolation between series and shunt converter stations.
(vi) It is compensating the voltage and current Imbalance.
Figure 4. Schematic diagram of IUPQC device
Figure 5. Control circuit for IUPQC device
3.3 Conventional PID controller
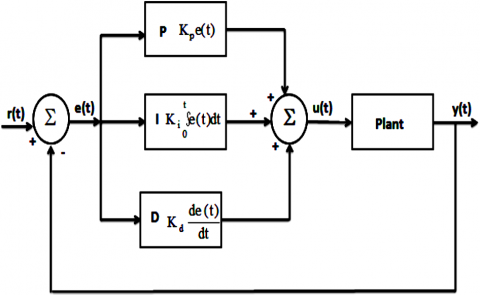
Many control structures and procedures are available for selecting a suitable controller for industrial application. In this paper conventional PID controller is used to control the UPQC and IUPQC devices [21]. This controller computes the error value which is the difference between a measured value and desired value and it minimizes the error by adjusting the process control inputs [22]. The schematic diagram of conventional PID controller as shown in Figure 6. In this, the proportional controller determines the reaction to the present error, the integral value determines the reaction based on the sum of recent errors, and the derivative value determines the reaction based on the rate at which the error has been changing.
The mathematical form of PID controller has
$u(t)={{K}_{p}}e(t)+{{K}_{I}}e(t)+{{K}_{D}}\frac{de(t)}{dt}$ (15)
The desired closed loop response can be obtained by tuning three constant parameters KP, KD, and KI values. Many methods are available for tuning the PID controller parameters. In this paper with help of Ziegler – Nichols method the PID controller parameters are tuned. By using this method the desired tuning parameters obtained for this system are
KP=2.19277, KI=3.07272 and KD=0.172.
Figure 6. Schematic diagram of conventional PID controller
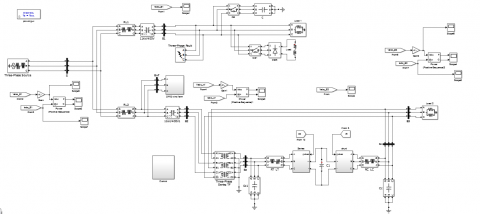
In this paper the performance of UPQC and IUPQC devices are discussed. These models are developed by using MATLAB/SIMULINK software. The conventional PID controller is used for determining the performance of these devices. At first, simulation results of UPQC with conventional PID controller is discussed, later simulation results of IUPQC device with conventional PID controlled is discussed. The MATLAB/SIMULINK model of test system as shown in Figure 7.
In this system at B3 point considered as a Point of Common Coupling (PCC) point. At that point UPQC and IUPQC devices are connected in order to reduce the different power quality issues occur at B3 point.
4.1 Simulation results of UPQC with conventional PID controller
The Simulink model of UPQC device operating with conventional PID controller is connected at PCC point in the second transmission line as shown in Figure 8.
Figure 7. MATLAB/SIMULINK model of test system
Figure 8. MATLAB/SIMULINK model for UPQC device connected at PCC
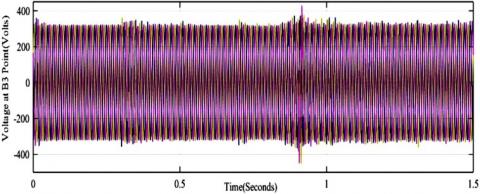
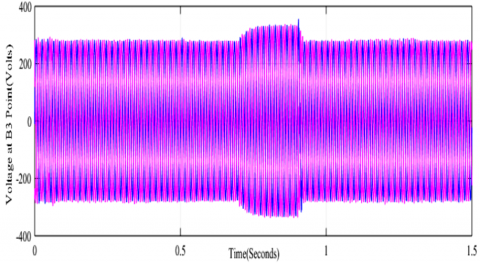
Figure 9. Voltage waveform measured at point B3
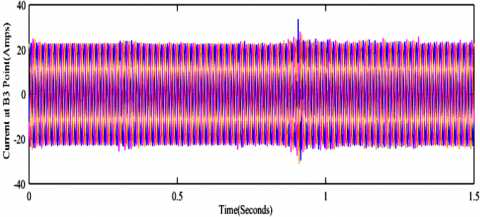
Figure 10. Current waveform measured at point B3
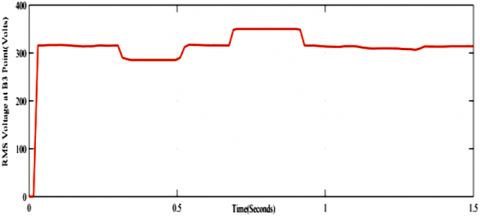
Figure 11. RMS voltage waveform measured at point B3
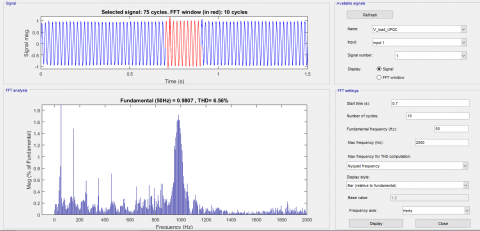
Figure 12. %THD measured in load voltage at t=0.3sec (during voltage sag)
Voltage waveform measured at load point B3 after connecting UPQC device with conventional PID controller as shown in Figure 9. Current waveform measured at load point B3 after connecting UPQC device with conventional PID controller as shown in Figure 10. Figure 11 shows RMS voltage waveform measured at point B3. A voltage sag is caused during the time period t=0.3sec to 0.5sec due to which the voltage decreased initial voltage 316V to 285V. Similarly, a voltage swell is caused during the time period t=0.7sec to 0.9sec due to which voltage is increased to 347V from an initial value of 316V. Also voltage waveform is distorted due to harmonics during the time period 1.1sec to 1.3sec. The decrease and increase of voltages are clearly observed in the RMS voltage wave form as shown in Figure 11.
Figure 12, Figure 13 and Figure 14 shows the harmonic spectra of load voltage (B3 point) for different time instants. %THD at t=0.3sec (Voltage sag harmonic) is 6.38%, at t=0.7 sec (Voltage swell harmonic) is 6.56%. and at t=1.1 sec (harmonics due to nonlinear load) is 6.07% respectively.
Figure 13. %THD measured load voltage at t=0.7sec (during voltage swell)
Figure 14. %THD measured in load voltage at t=1.1sec (during harmonics)
4.2 Simulation Results of IUPQC with Conventional PID Controller
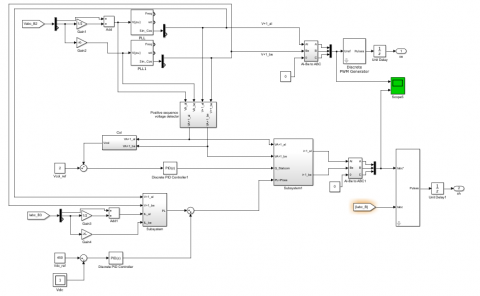
The Simulink model of IUPQC device is same as that of UPQC device, only the internal control circuit is of IUPQC is differed from the UPQC device. The Simulink circuit of IPQC device connected at PCC point in the test system as shown in Figure 15. Simulink model of Internal control circuit of IUPQC device as shown in Figure 16.
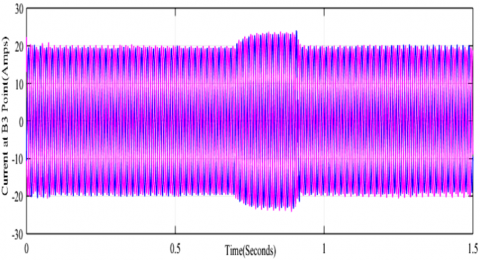
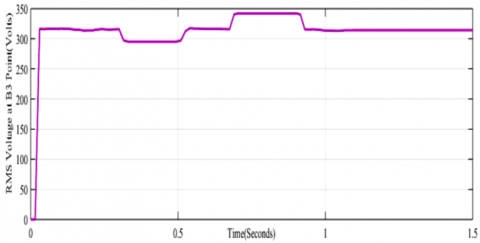
Figure 17 shows voltage waveform measured at load point B3. Figure 18 shows the current waveform measured at load point B3. By observing these figures, it is noticed that when IUPQC is controlled by conventional PID controller distortions in voltage and current waveforms have been reduced compared to UPQC device. Figure 19 shows RMS voltage waveform at B3 point. It can be noticed that voltage drops to 295V during time period 0.3sec to 0.5sec due to voltage sag and voltage rises to 342V from an initial value of 316V. Also voltage waveform is distorted due to harmonics during the time period 1.1sec to 1.3sec.
Figure 15. MATLAB/SIMULINK Model for IUPQC device connected at PCC
Figure 16. Internal control circuit of IUPQC
Figure 17. Voltage waveform measured at point B3
Figure 18. Current waveform measured at point B3
Figure 19. RMS Voltage measured at point B3
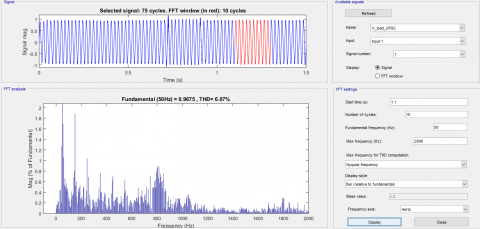
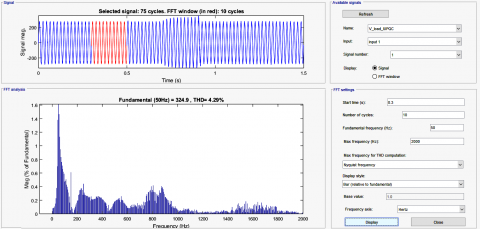
Figure 20. % THD in load voltage waveform measured at t=0.3sec (during sag)
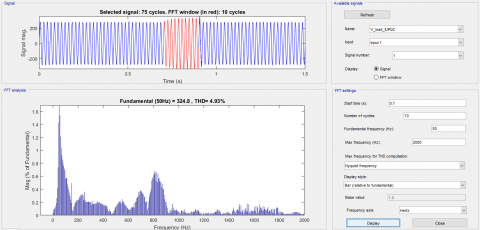
Figure 20, Figure 21 and Figure 22 represent %THD measured at point B3 in load voltage waveform for voltage sag, voltage swell and harmonic conditions respectively. It is observed that %THD measured during voltage sag at t = 0.3 sec is nearly 4.29%. %THD measured during voltage swell at t = 0.7 sec is nearly 4.93%. %THD measured at t = 1.1sec (when harmonics occur due to non-linear load conditions) is nearly 3.41%. Table 1 and Table 2 show the %THD and RMS voltages of UPQC and IUPQC devices employing conventional PID controller.
Figure 21. %THD in load voltage waveform measured at t=0.7sec (during swell)
Figure 22. %THD in load voltage waveform measured at t=1.1sec (when harmonics occur due to non-linear load)
Table 1. %THD comparative analysis of conventional PID controller with UPQC and IUPQC devices
|
% THD For Vload at |
UPQC |
IUPQC |
|
t=0.3 sec (Voltage Sag) |
6.38 |
4.29 |
|
t=0.7 sec (Voltage Swell) |
6.56 |
4.93 |
|
t=1.1 sec (Harmonics) |
6.07 |
3.41 |
Table 2. RMS voltage comparative analysis of conventional PID controller with UPQC and IUPQC devices
|
RMS Voltage (Volts) |
UPQC |
IUPQC |
|
SAG |
Reference Voltage 316V decreased to 285V |
Reference Voltage 316V decreased to 295V |
|
SWELL |
Reference Voltage 316V increased to 347V |
Reference Voltage 316V increased to 342V |
In this paper the performance of UPQC and IUPQC devices are discussed by employing conventional PID controller. The different power quality issues are created at different time instants to analyse the performance of the system. Mainly voltage sag, voltage swell and harmonics are treated as a different power quality issue. MATLAB/SIMULINK software is used for designing the models and analyzing the systems. The UPQC and IUPQC devices with conventional PID controller are employed at the load point to mitigate the above power quality issues. Comparative simulation results depict that IUPQC device with conventional PID controller improves the performance of DFIG based WECS by offering better compensation for power quality issues and by providing required active and reactive powers compare to UPQC device.
|
Pm |
Mechanical Power developed by Wind Turbine |
|
Cp |
power coefficient |
|
λ |
Tip - Speed Ratio |
|
$\beta$ |
Pitch Angle |
|
ρ |
Air density |
|
Ar |
Rotor Area in m2 |
|
Vw |
Velocity of wind m/sec |
|
ωr |
Angular Velocity of rotor |
[1] Saleh, M.A., Eskander, M.N., Amer, S., Nashed, M.N. (2014). Enhancing the LVRT capability of grid connected wind energy conversion system using Unified Power Quality Controller. 2014 IEEE Conference and Expo Transportation Electrification Asia-Pacific (ITEC Asia-Pacific), Beijing, pp. 1-5. https://doi.org/10.1109/ITEC-AP.2014.6940906
[2] Zaveri, T., Bhalja, B., Zaveri, N. (2012). Comparison of control strategies for DSTATCOM in three-phase, four-wire distribution system for power quality improvement under various source voltage and load conditions. International Journal of Electrical Power & Energy Systems, 43(1): 582-594. https://doi.org/10.1016/j.ijepes.2012.06.044
[3] Xu, X., Edmonds, M.J., Bishop, M., Sember, J. (2012). Application of distributed static compensators in wind farms to meet grid codes. 2012 Asia-Pacific Power and Energy Engineering Conference, Shanghai, pp. 1-5. https://doi.org/10.1109/APPEEC.2012.6307088
[4] Ghosh, A., Ledwich, G. (2012). Power Quality Enhancement Using Custom Power Devices. Springer Science & Business Media. https://doi.org/10.1007/978-1-4615-1153-3
[5] Han, B., Bae, B., Kim, H., Baek, S. (2005). Combined operation of unified power-quality conditioner with distributed generation. IEEE Transactions on Power Delivery, 21(1): 330-338. https://doi.org/10.1109/TPWRD.2005.852843
[6] Rama Sekhar Reddy, M., Pandu Ranga Reddy, G., Vijaya Kumar, M. (2020). Power quality Improvement in DFIG based WECS connected to the grid using UPQC controlled by fractional order PID and ANFIS controllers. Journal of Mechanics of Continua and Mathematical Sciences, (Sp. 5): 1-13. https://doi.org/10.26782/jmcms.spl.5/2020.01.00001
[7] Haile, W.A., Chandrasekar, P. (2018). A review of power quality problems and mitigation techniques. International Journal of Pure and Applied Mathematics, 118(22): 1637-1642.
[8] Kumkratug, P. (2011). Static synchronous series compensator controller based on fuzzy logic control for power system stabilization. American Journal of Applied Sciences, 8(10): 1014-1018. https://doi.org/10.3844/ajassp.2011.1014.1018
[9] Adebiyi, A.A., Akindeji, K.T. (2017). Investigating the effect of Static Synchronous Compensator (STATCOM) for voltage enhancement and transmission line losses mitigation. 2017 IEEE PES Power Africa, Accra, pp. 462-467. https://doi.org/10.1109/PowerAfrica.2017.7991269
[10] Phan, V.T., Lee, H.H. (2011). Control strategy for harmonic elimination in stand-alone DFIG applications with nonlinear loads. IEEE Transactions on Power Electronics, 26(9): 2662-2675. https://doi.org/10.1109/TPEL.2011.2123921
[11] Jadhao, S.S., Ratnaparkhi, G.P., Dhole, G.M., Paraskar, S.R. (2017). Voltage quality enhancement using unified power quality conditioner (UPQC). 2017 International Conference on Energy, Communication, Data Analytics and Soft Computing (ICECDS), Chennai, pp. 3270-3274. https://doi.org/10.1109/ICECDS.2017.8390064
[12] Pei, S.P., Chen, Y.G. (2011). The control and compensation strategy research of unified power quality conditioner. 2011 International Conference on Consumer Electronics, Communications and Networks (CECNet), Xianning, pp. 1775-1778. https://doi.org/10.1109/CECNET.2011.576910
[13] Mohod, S.W., Aware, M.V. (2010). A STATCOM-control scheme for grid connected wind energy system for power quality improvement. IEEE Systems Journal, 4(3): 346-352. https://doi.org/10.1109/JSYST.2010.2052943
[14] Axente, I., Basu, M., Conlon, M.F. (2011). DC link voltage control of UPQC for better dynamic performance. Electric Power Systems Research, 81(9): 1815-1824. https://doi.org/10.1016/j.epsr.2011.05.005
[15] Khadkikar, V. (2011). Enhancing electric power quality using UPQC: A comprehensive overview. IEEE transactions on Power Electronics, 27(5): 2284-2297. https://doi.org/10.1109/TPEL.2011.2172001
[16] Fujita, H., Akagi, H. (1998). The unified power quality conditioner: The integration of series-and shunt-active filters. IEEE Transactions on Power Electronics, 13(2): 315-322. https://doi.org/10.1109/63.662847
[17] França, B.W., da Silva, L.F., Aredes, M.A., Aredes, M. (2014). An improved iUPQC controller to provide additional grid-voltage regulation as a STATCOM. IEEE Transactions on Industrial Electronics, 62(3): 1345-1352. https://doi.org/10.1109/TIE.2014.2345328
[18] Kamran, F., Habetler, T.G. (1998). Combined deadbeat control of a series-parallel converter combination used as a universal power filter. IEEE Transactions on Power Electronics, 13(1): 160-168. https://doi.org/10.1109/63.654971
[19] Sudhakar, P., Malaji, S., Sarvesh, B. (2016). Impact of UPQC on protection of distributed generation integrated distribution system. 2016 International Conference on Electrical, Electronics, and Optimization Techniques (ICEEOT), Chennai, pp. 631-636. https://doi.org/10.1109/ICEEOT.2016.7754757
[20] Kumaraswamy, G., Reddy, Y.R., Harikrishna, C. (2012). Design of interline unified power quality conditioner for power quality disturbances using simulink. IJART, 1(5): 228-237.
[21] Mohamed, H.F., Saad, N.H., Eldin, K.A.A.S. (2018). Moderation of voltage sag and swell in grid connected wind energy based PMSG by DSTATCOM. 2018 Twentieth International Middle East Power Systems Conference (MEPCON), Cairo, Egypt, pp. 433-439. https://doi.org/10.1109/MEPCON.2018.8635239
[22] Zhang, J., Xu, X., Feltes, J.W. (2010). Development and planning of wind power in China. IEEE PES General Meeting, Providence, RI, pp. 1-6. https://doi.org/10.1109/PES.2010.5589476