Abbas S. Al-Ameer | Lubna E. Chabok*
© 2026 The authors. This article is published by IIETA and is licensed under the CC BY 4.0 license (http://creativecommons.org/licenses/by/4.0/).
OPEN ACCESS
Drying shrinkage affects the volumetric stability and durability of concrete, particularly in hot climates. This study investigates the combined effect of relative humidity (RH) and water-to-cement (w/c) ratio on long-term drying shrinkage at a target temperature of 40 ℃, representing Iraqi summer conditions. Three concrete mixtures with w/c ratios of 0.4, 0.5, and 0.6 were water-cured for 28 days and then exposed to monitored RH conditions of 35 ± 5%, 55 ± 5%, and 75 ± 5%. Length change was monitored up to 120 days from casting, with negative strain values indicating shrinkage. At 120 days, shrinkage under 75 ± 5% RH reached −695, −758, and −741 microstrain for M(0.4), M(0.5), and M(0.6), respectively. Under 55 ± 5% RH, the corresponding values were −811, −1133, and −702 microstrain, while under 35 ± 5% RH, they were −856, −1046, and −919 microstrain. Shrinkage varied with both RH and mixture composition. M(0.5) showed maximum shrinkage under medium RH, whereas M(0.4) and M(0.6) showed maximum shrinkage under low RH, and high RH reduced shrinkage for all mixtures. Overall, it is concluded that the drying shrinkage was governed by the combined effects of RH, w/c ratio, cement content, paste volume, and moisture movement rather than by a single factor.
drying shrinkage, relative humidity, water-to-cement ratio, concrete durability, capillary tension, hot climate
Shrinkage is one of the fundamental characteristics of cementitious materials, occurring in both the plastic and hardened stages of concrete. Volumetric shrinkage could be generated by tensile stresses due to inhomogeneous deformation within the material, which can cause harmful cracks [1]. These cracks act as preferential pathways for the penetration of aggressive agents such as chlorides and sulfates. The ingress of these agents accelerates the deterioration of concrete and adversely affects its durability and long-term service life [1-3]. Previous studies in the construction sector have shown that long-term cracks are among the most serious problems affecting concrete structures throughout their service life, owing to their considerable structural and economic impacts [4].
The repair and maintenance costs associated with shrinkage damage are also high; reports indicate that addressing cracks and related defects in residential buildings has been a significant financial burden in recent decades [4]. In addition, cracks facilitate the penetration of moisture and corrosive agents, accelerating the corrosion of reinforcing steel if proper maintenance measures are not taken. Therefore, improving the resistance of concrete to shrinkage-induced deformations is essential to enhance the durability of structures, reduce repair costs, and limit the environmental impacts associated with demolition and construction waste [4].
Shrinkage mechanisms in concrete are a complex phenomenon resulting from the interaction of several physical and chemical processes that extend from the early stages of concrete's life to the advanced stages of its service life. Depending on the dominant mechanism, shrinkage in cementitious materials is classified as plastic shrinkage, autogenous shrinkage, drying shrinkage, and carbonation shrinkage [5]. In traditional concrete with water-to-cement (w/c) ratios exceeding 0.4, drying shrinkage accounts for the largest portion of total shrinkage compared to the other types [6]. When the w/c ratio exceeds the critical value of approximately 0.42, the water content exceeds the requirements for complete hydration of cement. Consequently, the influence of autogenous shrinkage gradually decreases while the concrete's susceptibility to physical water loss increases, resulting in a corresponding increase in drying shrinkage [7]. When the w/c ratio exceeds 0.45, drying shrinkage is the main factor responsible for the physical cracks that concrete is exposed to during its service life [8]. Drying shrinkage in porous cementitious materials results from the loss of internal moisture to attain moisture equilibrium with the relative humidity (RH) of the surrounding environment [9]. The severity of drying shrinkage is closely related to several factors, most notably the curing system, pore size distribution, and thermodynamic behaviour of water within the pores. The nature and texture of hydration products within the concrete microstructure also play an important role [10, 11]. This phenomenon has been explained based on several mechanisms, including surface energy changes (Gibbs–Bangham effect), capillary forces, separation pressure, and water movement between layers of hydrated calcium silicate gel (C–S–H) [12, 13]. The Gibbs–Bangham effect is mainly effective at RH levels below 40%, while capillary tension and separation pressure work together in the RH range between 40% and 95% [14, 15]. At the critical humidity range between 40% and 50%, the controlling mechanism transitions from capillary tension forces to surface energy effects. Within this range, capillary tension forces exert their maximum effect on volumetric deformation [12, 16]. Since concrete structures are rarely exposed to RH below 40% continuously, capillary tension forces are considered the dominant mechanism responsible for drying shrinkage in cementitious materials under practical environmental conditions [17, 18].
Accordingly, numerous studies have addressed ways to reduce drying shrinkage using various methods, including mineral and chemical additives, fibres, alternative aggregates, and improvements to external and internal curing systems. In general, controlling drying shrinkage relies on three basic principles: reducing the stresses generated on capillary walls, maintaining internal moisture to promote cement hydration and densify the microstructure, and increasing the hardness and crack resistance of concrete. Together, these principles contribute to the development of high-strength and sustainable concrete materials. Despite numerous studies on drying shrinkage in concrete, the long-term behaviour of this shrinkage under high temperatures and in combination with the effects of different RH and w/c ratios remains insufficiently studied. Therefore, this research aims to study the influence of RH on the long-term drying shrinkage of concrete with different w/c ratios (0.4, 0.5, and 0.6) at a constant temperature of 40 ℃ for a period of 120 days. Previous studies have shown that drying shrinkage is highly sensitive to environmental exposure conditions, particularly temperature and RH. High temperature accelerates moisture movement and increases the drying rate, whereas RH controls the moisture gradient between concrete and the surrounding environment. However, most available studies have focused on drying shrinkage under standard laboratory conditions or on individual parameters such as w/c ratio, admixtures, or general moisture loss. Fewer studies have examined the combined effect of high temperature, controlled RH exposure, and mixture composition on long-term drying shrinkage, especially under hot-climate conditions similar to Iraq. A brief comparison between selected previous studies and the present study is shown in Table 1 to clarify the research gap addressed in this work.
The novelty of this study lies in evaluating the combined influence of RH exposure level and mixture composition on the long-term drying shrinkage of concrete under hot-climate conditions representative of Iraqi summer environments. Although drying shrinkage has been widely studied, limited attention has been given to the combined effect of monitored RH conditions and different w/c ratios under high-temperature exposure.
Therefore, this study aims to answer the following research questions: (1) How does RH level affect the long-term drying shrinkage of concrete exposed to hot conditions? (2) Does increasing the w/c ratio lead to a direct increase in drying shrinkage? (3) How does mixture composition interact with RH exposure to influence shrinkage behaviour? The practical significance of this study is to support better curing and moisture-protection practices for concrete structures exposed to hot climates.
Table 1. Summary of selected previous studies versus the present study, highlighting the research gap
|
Study |
Main Focus |
Environmental Condition |
Research Gap |
|
[6] |
General drying shrinkage mechanisms in concrete |
General drying and relative humidity (RH) effects |
Provides fundamental mechanisms but does not focus on hot-climate RH-controlled exposure |
|
[1] |
Concrete microstructure, moisture movement, and shrinkage |
General concrete durability conditions |
Discusses shrinkage mechanisms but not long-term RH-controlled shrinkage at high temperature |
|
[19] |
Drying shrinkage of concrete with different water-to-cement (w/c) ratios |
Different concrete mixtures and shrinkage-reducing admixture |
Limited focus on controlled RH exposure under high-temperature conditions |
|
Present study |
Long-term drying shrinkage under different RH levels and w/c ratios |
40 ℃ and monitored RH conditions representative of Iraqi summer exposure |
Evaluates the combined influence of RH exposure and mixture composition under hot-climate conditions |
2.1 Materials
Conventional concrete materials were used to produce concrete, including ordinary Portland cement, fine aggregate, coarse aggregate, and potable water. All materials were selected in accordance with approved standard specifications. The test results are presented in Tables 2-4.
Table 2. Chemical and physical properties of cement
|
Chemical Composition |
Percentage by Mass |
Limit of IQS No. 5/2019 [20] |
|
Lime (CaO) |
60.7 |
- |
|
Silica (SiO₂) |
20.52 |
- |
|
Alumina (Al₂O₃) |
5.33 |
- |
|
Iron oxide (Fe₂O₃) |
3.98 |
- |
|
Magnesia (MgO) |
2.44 |
5.0 (max) |
|
Sulfate (SO₃) |
2.45 |
2.8 (max) |
|
Loss on ignition (L.O.I) |
2.55 |
4.0 (max) |
|
Insoluble residue (I.R) |
0.93 |
1.5 (max) |
|
Tetracalcium Aluminoferrite (C₄AF) |
12.1 |
- |
|
Physical Properties |
Test Result |
Limit of IQS No. 5:2019 [20] |
|
Fineness (Blaine) (cm²/gm) |
3200 |
≥2800 |
|
Soundness autoclave method |
0.19% |
≤0.8% |
|
Initial setting time (min) |
190 |
≥45 |
|
Final setting time (h) |
4 |
≤10 |
|
Compressive strength at 2 days (MPa) |
22.4 |
≥20 |
|
Compressive strength at 28 days (MPa) |
43.2 |
≥42.5 |
Table 3. Characteristics of fine aggregate
|
Physical Properties |
Test Results |
IQS No. 45/1984 [21] |
|
Fineness modulus of sand |
2.4 |
- |
|
Specific gravity |
2.60 |
- |
|
Absorption, % |
2.6 |
- |
|
Materials finer than 75 µm, % |
3.4 |
≤5% |
|
Chemical Properties |
Test Results |
IQS No. 45/1984 [21] |
|
Sulfate content, % |
0.12 |
Not more than 0.5% |
Table 4. Characteristics of coarse aggregate
|
Physical Properties |
Test Results |
Limits of IQS No. 45/1984 [21] |
|
Specific Gravity |
2.6 |
- |
|
Absorption, % |
0.75 |
- |
|
Bulk Density, kg/m³ |
1550 |
- |
|
Chemical Properties |
|
|
|
Sulfate content, % |
0.01 |
Not more than 0.1% |
2.2 Mix proportions
The mix design in this study was conducted in accordance with ACI 211.1-22 [22], and the mix proportions are presented in Table 5.
The slump of all concrete mixtures was maintained within the range of 75–100 mm to provide comparable workability among the mixtures. The same superplasticizer dosage was used for all mixtures. Fresh density and air content were not included as primary measured variables in this experimental program because the study focused mainly on the combined effects of w/c ratio and RH exposure on long-term drying shrinkage under hot-climate conditions. However, their possible influence on pore structure and drying behavior is acknowledged as a limitation of the study.
Table 5. Mix design method ACI 211.1-22 [22]
|
Mix |
w/c |
Cement, kg/m3 |
Water, kg/m3 |
Gravel, kg/m3 |
Sand, kg/m3 |
SP, %* |
|
M(0.4) |
0.4 |
540 |
216 |
973.5 |
553.8 |
0.5 |
|
M(0.5) |
0.5 |
432 |
216 |
973.5 |
642.2 |
0.5 |
|
M(0.6) |
0.6 |
360 |
216 |
973.5 |
702 |
0.5 |
Note: *SP: Glenium 54 (modified polycarboxylate ether, ASTM C494 Type A & F) with percentage of cement mass; w/c: water-to-cement ratio.
2.3 Specimens and selection of test method
Specimens were prepared for different tests. The compressive strength test and the absorption and porosity tests were conducted using three cubic specimens with dimensions of (100 × 100 × 100) mm. In addition, the length change test was carried out using prism specimens with dimensions of (70 × 70 × 280) mm for each mixture and RH condition; three prism specimens were tested for each mixture under each RH exposure condition. Length-change measurements were performed using a digital length comparator equipped with a digital dial gauge. The specimens were water-cured for 28 days and then exposed to the selected RH conditions. Length-change readings were recorded up to 120 days from casting, following the general procedure of ASTM C157/C157M [23], with deliberate modifications to suit local climate conditions: modified specimen dimensions (70 × 70 × 280) mm were utilized, and the exposure temperature was fixed at 40 ℃.
2.4 Storage and relative humidity control system
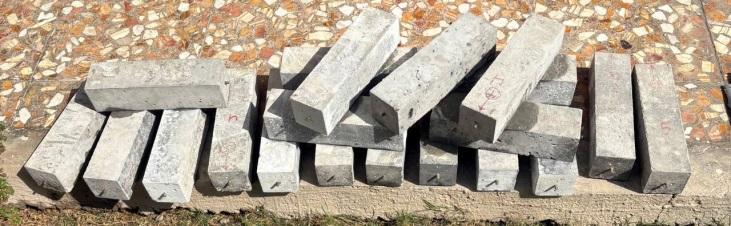
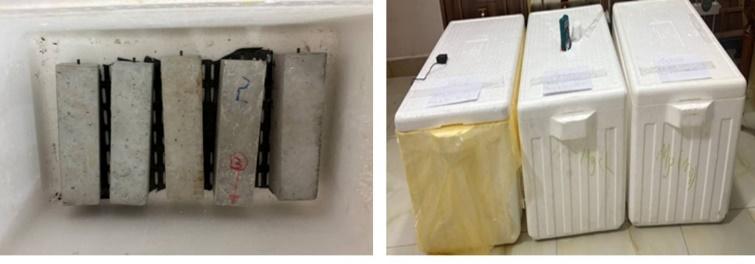
After demolding, all length-change specimens were water-cured for 28 days and then transferred to sealed storage boxes to investigate the effect of RH on long-term drying shrinkage. The exposure temperature was maintained at a target value of 40 ℃, selected based on temperature data obtained from the Iraqi Meteorological Organization and Seismology to represent hot summer conditions in Iraq. Three RH conditions were selected to represent low, medium, and high humidity exposure levels. Length-change specimens are shown in Figure 1, while the sealed storage boxes used during the experiment are shown in Figure 2.
Figure 1. Length change samples
Figure 2. The controlled environmental chambers designed to maintain the specified temperature and humidity levels
2.5 Selection and control of relative humidity using saturated salt solutions
The RH conditions were selected to represent low, medium, and high humidity exposure levels that may occur in Iraqi summer environments, particularly in the humid southern regions. These RH conditions were reproduced experimentally in sealed storage boxes using saturated salt solutions. Magnesium chloride (MgCl₂), magnesium nitrate [Mg(NO₃)₂], and sodium chloride (NaCl) were used to obtain low, medium, and high RH conditions, respectively, in the experiment.
Table 6. Monitoring of environmental conditions, temperature, and relative humidity (RH) of the test
|
Group |
Target Temp. (℃) |
Salt Solution |
Theoretical RH at 40 ℃ (%) |
Reported Monitored RH (%) |
|
Low RH |
40 |
Magnesium chloride (MgCl₂) |
31.60 ± 0.13 |
35 ± 5 |
|
Medium RH |
40 |
Magnesium nitrate [Mg(NO₃)₂] |
48.42 ± 0.37 |
55 ± 5 |
|
High RH |
40 |
Sodium chloride (NaCl) |
74.68 ± 0.13 |
75 ± 5 |
Note: The theoretical RH values at 40 ℃ were obtained from Omega Engineering [24] Z-103 saturated salt solution data. The monitored RH values are reported as mean ± fluctuation based on the measured RH ranges inside the sealed boxes during the exposure period.
According to the Omega Engineering Z-103 saturated salt solution data [24], the theoretical equilibrium RH values at 40 ℃ are 31.60 ± 0.13% for MgCl₂, 48.42 ± 0.37% for Mg(NO₃)₂, and 74.68 ± 0.13% for NaCl. Details of the salt types used for each RH condition are shown in Table 6. During the exposure period, the RH and air temperature inside the storage boxes were monitored periodically using a digital thermo-hygrometer (TOTAL). The temperature was also checked using an infrared thermometer (DEKO, measuring range −50 ℃ to 600 ℃).
Measurements were generally taken manually and recorded at approximately 10-day intervals, and the interval was extended at later ages when the variations became relatively small. Based on the monitored RH ranges, the exposure conditions were reported as 35 ± 5%, 55 ± 5%, and 75 ± 5% RH for low, medium, and high humidity conditions, respectively.
3.1 Compressive strength, absorption, and porosity
The compressive strength, absorption, and porosity results were obtained from three specimens for each mixture and age. The absorption and porosity tests were conducted following the general procedure of ASTM C642:21 [25]. The reported values represent the average of three readings from three separate specimens for each mixture.
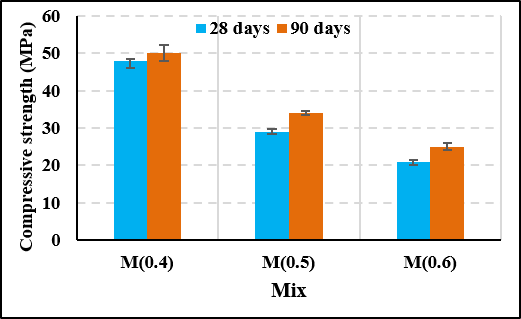
Figure 3. Compressive strength of the concrete mixture used
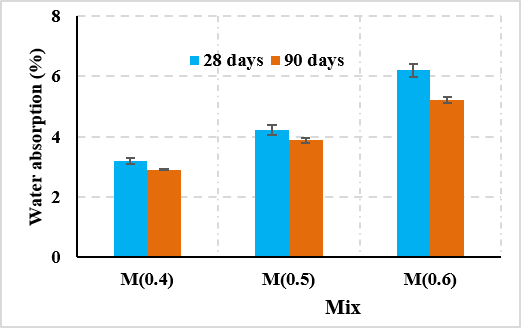
Figure 4. Water absorption (%) of the concrete mixtures used
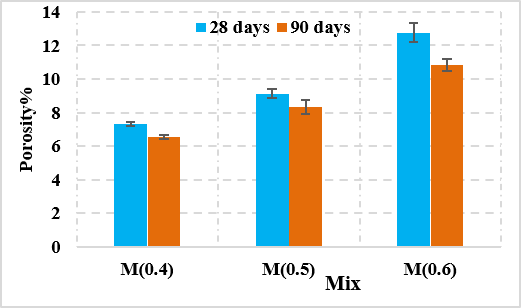
The error bars shown in Figures 3-5 represent the variation among the three specimens, expressed as the standard deviation (SD) of these results. The results showed a direct relationship between the increase in the w/c ratio and both porosity and absorption. In contrast, an inverse relationship was observed between the w/c ratio and compressive strength, as shown in Table 7 and Figure 3.
The mixture with a ratio of 0.4 achieved the highest mechanical efficiency (50 MPa at 90 days) and the lowest porosity (6.53). This may be attributed to the formation of a denser microscopic structure owing to reduced water content and the continuation of the hydration process over time [6, 19].
Table 7. Results of compressive strength, absorption, and porosity
|
Mix |
Age (days) |
Compressive Strength (MPa) |
Absorption (%) |
Porosity (%) |
|||
|
|
|
Mean |
SD |
Mean |
SD |
Mean |
SD |
|
M(0.4) |
28 |
48 |
0.46 |
3.2 |
0.1 |
7.23 |
0.12 |
|
M(0.4) |
90 |
50 |
2.08 |
2.9 |
0.02 |
6.53 |
0.1 |
|
M(0.5) |
28 |
29 |
0.76 |
4.21 |
0.17 |
9.11 |
0.27 |
|
M(0.5) |
90 |
34 |
0.58 |
3.87 |
0.07 |
8.33 |
0.42 |
|
M(0.6) |
28 |
21 |
0.42 |
6.2 |
0.22 |
12.76 |
0.57 |
|
M(0.6) |
90 |
25 |
0.98 |
5.23 |
0.1 |
10.82 |
0.36 |
Note: All values are based on three readings from three distinct specimens. SD: standard deviation.
3.2 Effect of relative humidity and water-to-cement ratio on drying shrinkage
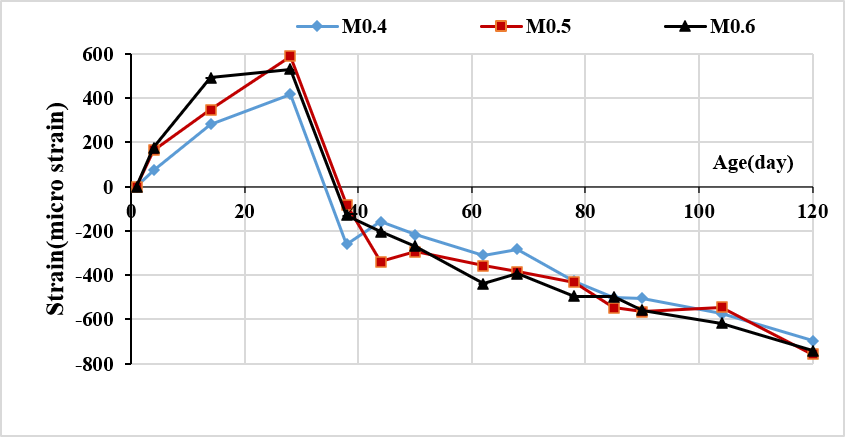
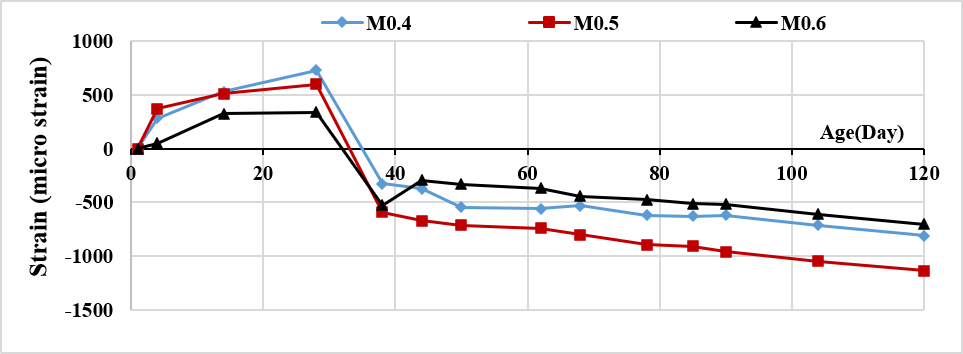
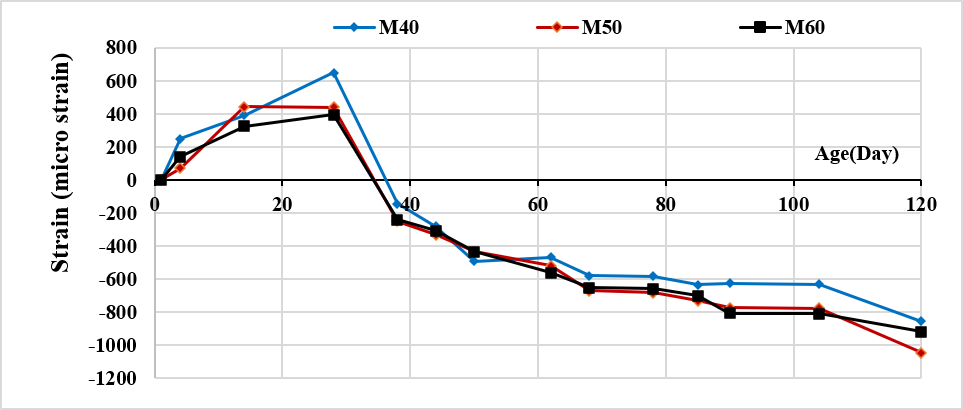
The results of length change, shrinkage and expansion for the different mixtures are shown in Table 8 and Figures 6-8. The initial length reading taken immediately after demolding was used as the reference reading (zero-length baseline) for calculating the subsequent length changes. During the 28-day water-curing period, the specimens were periodically removed from the curing water for length-change measurements and then returned to the water. Therefore, the positive length-change values recorded before 28 days represent expansion relative to the initial reference reading. After curing the samples in water up to 28 days old, all the mixtures showed positive strain expansion ranging from 340 to 730 microstrain for all mixtures. This early-age expansion is attributed to continued cement hydration and swelling associated with the formation of C–S–H products [1, 6]. After transferring the samples to air and exposing them to different RHs, the volumetric behavior reversed between 28 and 38 days from expansion to contraction, as a result of the onset of moisture loss from the capillary pores.
Table 8. Length-change results for M(0.4), M(0.5), and M(0.6) ages counted from casting
|
Age (Day) |
75 ± 5% RH |
55 ± 5% RH |
35 ± 5% RH |
||||||
|
M(0.4) |
M(0.5) |
M(0.6) |
M(0.4) |
M(0.5) |
M(0.6) |
M(0.4) |
M(0.5) |
M(0.6) |
|
|
1 |
0 |
0 |
0 |
0 |
0 |
0 |
0 |
0 |
0 |
|
4 |
74 |
165 |
175 |
284 |
368 |
49 |
249 |
70 |
140 |
|
14 |
281 |
347 |
491 |
530 |
509 |
326 |
392 |
442 |
323 |
|
28 |
418 |
589 |
530 |
730 |
600 |
340 |
649 |
439 |
393 |
|
38 |
-260 |
-81 |
-130 |
-326 |
-589 |
-526 |
-144 |
-249 |
-242 |
|
44 |
-158 |
-340 |
-204 |
-375 |
-670 |
-295 |
-281 |
-333 |
-309 |
|
50 |
-218 |
-295 |
-270 |
-547 |
-712 |
-330 |
-491 |
-435 |
-435 |
|
62 |
-309 |
-358 |
-439 |
-558 |
-740 |
-368 |
-467 |
-519 |
-561 |
|
68 |
-284 |
-385 |
-393 |
-530 |
-800 |
-442 |
-579 |
-670 |
-653 |
|
78 |
-428 |
-432 |
-495 |
-618 |
-895 |
-474 |
-583 |
-684 |
-660 |
|
85 |
-502 |
-547 |
-498 |
-628 |
-909 |
-512 |
-635 |
-730 |
-702 |
|
90 |
-505 |
-565 |
-558 |
-618 |
-958 |
-519 |
-625 |
-775 |
-807 |
|
104 |
-574 |
-544 |
-618 |
-620 |
-960 |
-520 |
-630 |
-776 |
-810 |
|
120 |
-695 |
-758 |
-741 |
-811 |
-1133 |
-702 |
-856 |
-1046 |
-919 |
Figure 6. Expansion and shrinkage result for M(0.4), M(0.5), and M(0.6) at 75 ± 5% RH
Figure 7. Expansion and shrinkage result for M(0.4), M(0.5), and M(0.6) at 55 ± 5% relative humidity (RH)
Figure 8. Expansion and shrinkage result for M(0.4), M(0.5), and M(0.6) at 35 ± 5% relative humidity (RH)
Table 9. Shrinkage risk classification at 120 days
|
Relative Humidity (RH) Condition |
Main Observation at 120 Days |
Risk Level |
Practical Implication |
|
75 ± 5% RH |
Lower shrinkage values were recorded for all mixtures, ranging from −695 to −758 microstrain. |
Relatively Lower |
Higher moisture exposure reduces drying shrinkage. |
|
55 ± 5% RH |
The highest shrinkage was recorded for M(0.5), reaching −1133 microstrain. |
High |
Medium RH exposure may require careful post-curing moisture control. |
|
35 ± 5% RH |
M(0.4) and M(0.6) showed the highest shrinkage under this condition. |
High |
Rapid drying conditions may increase the risk of shrinkage and cracking. |
At 120 days, the shrinkage response varied depending on both RH condition and mixture composition. The highest shrinkage for M(0.5) was recorded under the medium RH condition, reaching −1133 microstrain, whereas M(0.4) and M(0.6) showed their highest shrinkage under the low RH condition. This behavior may be attributed to the development of sustained capillary tension within partially saturated pores under the medium RH condition, where the pores are partially filled with water. Specifically, for the M(0.5) mixture, this capillary pressure reaches its critical maximum due to the optimal balance between its pore size distribution and water-to-cement ratio. Under low RH, rapid drying may disrupt the continuity of the capillary pore-water network, thereby reducing the sustained capillary tension stresses within the pore structure [1].
In contrast, high RH (75 ± 5%) reduced the final shrinkage, with values ranging from −695 to −758 microstrain, due to the lower moisture loss and reduced vapor pressure gradient, as reported in previous studies [6, 26]. At low RH (35 ± 5%), shrinkage ranged from −856 to −1046 microstrain for M(0.4) and M(0.5), while M(0.6) reached −919 microstrain. Under this condition, rapid drying may reduce the continuity of capillary menisci over time, which may limit the persistence of capillary tension [27]. With regard to the w/c ratio, the results did not show a direct linear relationship with shrinkage, as the M(0.6) mixtures did not exhibit the highest shrinkage in all cases [1]. Therefore, the shrinkage behavior cannot be attributed to the w/c ratio alone. Because the water content was kept constant while the cement content varied, the mixtures differed not only in w/c ratio but also in cement content and paste volume; consequently, the observed shrinkage response should be interpreted as the combined effect of mixture composition rather than the isolated effect of w/c ratio alone.
The relatively high shrinkage observed for M(0.5) may be related to the combined influence of the medium w/c ratio, cement content, paste volume, and pore-structure sensitivity to moisture movement. Since the pore-size distribution, internal RH, and mass-loss measurements were not conducted in this study, the proposed mechanism should be considered as a possible interpretation rather than direct evidence.
To provide a practical interpretation of the experimental results, a simple shrinkage risk classification was developed based on the final shrinkage values at 120 days, as shown in Table 9.
This classification provides a practical indication of the RH conditions that may require greater attention during post-curing exposure of concrete in hot climates.
It should be noted that the classification presented in Table 9 is intended as a relative comparison among the investigated RH conditions rather than an absolute assessment of structural cracking risk. Although the shrinkage values at 75 ± 5% RH remained considerable, they were lower than those measured under 55 ± 5% and 35 ± 5% RH. Therefore, the classification reflects the comparatively lower shrinkage observed under the highest RH condition within the scope of this study.
Although direct drying mass-loss curves for the shrinkage prism specimens, mercury intrusion porosimetry (MIP), and internal RH measurements were not included in the present experimental program, water absorption and porosity tests were conducted on concrete specimens made from the same mixtures. These results provide indirect material evidence of differences in the pore-related properties of the mixtures. However, absorption and porosity measurements do not directly describe moisture transport during drying. Therefore, the shrinkage mechanism discussed in this study should be regarded as a possible interpretation based on the measured length-change results, absorption/porosity data, and supporting literature, rather than as direct moisture-transport evidence.
This study investigated the combined influence of RH exposure and mixture composition on the long-term drying shrinkage of concrete under a target temperature of 40 ℃, representing hot Iraqi summer conditions. Based on the results, the following conclusions can be drawn:
•High RH exposure (75 ± 5%) consistently reduced drying shrinkage across all mixtures, confirming the importance of maintaining moisture after curing to limit the long-term shrinkage.
•The shrinkage response depended on both the RH condition and mixture composition rather than on a single dominant factor: M(0.5) exhibited its highest shrinkage at 55 ± 5% RH, reaching −1133 microstrain, whereas M(0.4) and M(0.6) exhibited their highest shrinkage at 35 ± 5% RH.
•The effect of the w/c ratio was not linear. Because the water content was held constant while the cement content varied, the observed shrinkage should be interpreted as the combined effect of the w/c ratio, cement content, paste volume, RH exposure, and moisture movement.
•From an engineering perspective, these findings highlight the need for proper curing and moisture protection of concrete exposed to hot Iraqi summer conditions to reduce shrinkage and cracking risk.
•As direct drying mass-loss curves, MIP pore-structure data, and internal RH measurements were not included in this study, the proposed mechanism should be regarded as a plausible interpretation rather than direct material evidence. Future studies should incorporate these measurements to verify the underlying moisture transport mechanism.
[1] Mehta, P.K., Monteiro, P.J.M. (2014). Concrete: Microstructure, Properties and Materials. McGraw-Hill Education. https://www.accessengineeringlibrary.com/content/book/9780071797870.
[2] Kadhum, A.O., Al-Ameeri, A.S., Edrees, S.J. (2025). Investigation of the properties of green concrete exposed to different aggressive environments. Journal of Building Pathology and Rehabilitation, 10: 93. https://doi.org/10.1007/s41024-025-00601-z
[3] Nili, M., Ramezanianpour, A.K., Sobhani, J. (2021). Evaluation of the effects of silica fume and air-entrainment on deicer salt scaling resistance of concrete pavements: Microstructural study and modeling. Construction and Building Materials, 308: 124972. https://doi.org/10.1016/j.conbuildmat.2021.124972
[4] Gardner, D., Lark, R., Jefferson, T., Davies, R. (2018). A survey on problems encountered in current concrete construction and the potential benefits of self-healing cementitious materials. Case Studies in Construction Materials, 8: 238-247. https://doi.org/10.1016/j.cscm.2018.02.002
[5] Collins, F., Sanjayan, J.G. (2000). Effect of pore size distribution on drying shrinking of alkali-activated slag concrete. Cement and Concrete Research, 30(9): 1401-1406. https://doi.org/10.1016/S0008-8846(00)00327-6
[6] Neville, A.M. (2011). Properties of Concrete, 5th ed. Pearson Education Limited. https://dokumen.pub/properties-of-concrete-5nbsped-0273755803-9780273755807.html.
[7] Almudaiheem, J.A. (1991). Prediction of drying shrinkage of portland cement paste: Influence of shrinkage mechanisms. Journal of King Saud University-Engineering Sciences, 3(1): 69-86. https://doi.org/10.1016/S1018-3639(18)30538-5
[8] Kayondo, M., Combrinck, R., Boshoff, W.P. (2019). State-of-the-art review on plastic cracking of concrete. Construction and Building Materials, 225: 886-899. https://doi.org/10.1016/j.conbuildmat.2019.07.197
[9] Ohno, T., Mitani, Y., Maruyama, I. (2019). Influence of relative humidity and curing period on drying shrinkage property of concrete [in Japanese]. Taiheiyo Cement Kenkyu Hokoku, 2019(177): 3-11. https://doi.org/10.69252/taiheiyoresearch.2019.177_3
[10] Wu, L.M., Farzadnia, N., Shi, C.J., Zhang, Z.H., Wang, H. (2017). Autogenous shrinkage of high performance concrete: A review. Construction and Building Materials, 149: 62-75. https://doi.org/10.1016/j.conbuildmat.2017.05.064
[11] Yang, L., Shi, C.J., Wu, Z.M. (2019). Mitigation techniques for autogenous shrinkage of ultra-high-performance concrete-A review. Composites Part B: Engineering, 178: 107456. https://doi.org/10.1016/j.compositesb.2019.107456
[12] Maruyama, I., Nishioka, Y., Igarashi, G., Matsui, K. (2014). Microstructural and bulk property changes in hardened cement paste during the first drying process. Cement and Concrete Research, 58: 20-34. https://doi.org/10.1016/j.cemconres.2014.01.007
[13] Šavija, B., Luković, M. (2016). Carbonation of cement paste: Understanding, challenges, and opportunities. Construction and Building Materials, 117: 285-301. https://doi.org/10.1016/j.conbuildmat.2016.04.138
[14] Maruyama, I., Ohkubo, T., Haji, T., Kurihara, R. (2019). Dynamic microstructural evolution of hardened cement paste during first drying monitored by 1H NMR relaxometry. Cement and Concrete Research, 122: 107-117. https://doi.org/10.1016/j.cemconres.2019.04.017
[15] Maruyama, I., Igarashi, G., Nishioka, Y. (2015). Bimodal behavior of C–S–H interpreted from short-term length change and water vapor sorption isotherms of hardened cement paste. Cement and Concrete Research, 73: 158-168. https://doi.org/10.1016/j.cemconres.2015.03.010
[16] Jennings, H.M., Kumar, A., Sant, G. (2015). Quantitative discrimination of the nano-pore-structure of cement paste during drying: New insights from water sorption isotherms. Cement and Concrete Research, 76: 27-36. https://doi.org/10.1016/j.cemconres.2015.05.006
[17] Abdalhmid, J.M., Ashour, A.F., Sheehan, T. (2019). Long-term drying shrinkage of self-compacting concrete: Experimental and analytical investigations. Construction and Building Materials, 202: 825-837. https://doi.org/10.1016/j.conbuildmat.2018.12.152
[18] Hu, X., Shi, Z.G., Shi, C.J., et al. (2017). Drying shrinkage and cracking resistance of concrete made with ternary cementitious components. Construction and Building Materials, 149: 406-415. https://doi.org/10.1016/j.conbuildmat.2017.05.113
[19] Kioumarsi, M., Azarhomayun, F., Haji, M., Shekarchi, M. (2020). Effect of shrinkage reducing admixture on drying shrinkage of concrete with different w/c ratios. Materials, 13(24): 5721. https://doi.org/10.3390/ma13245721
[20] Iraqi Specification No. 5/2019. (2019). Portland Cement. Central Organization for Standardization and Quality Control (COSQC), Baghdad, Iraq.
[21] Iraqi Specification. No. 45/1984. (1984). Aggregates from Natural Sources for Concrete and Building Construction. Central Organization for Standardization and Quality Control, Baghdad, Iraq.
[22] ACI 211.1-22. (2022). Selecting Proportions for Normal-Density and High-Density Concrete—Guide. American Concrete Institute.
[23] ASTM C157/C157M. (2017). Standard Test Method for Length Change of Hardened Hydraulic-Cement Mortar and Concrete. ASTM International. https://doi.org/10.1520/C0157_C0157M-17
[24] Omega Engineering Inc. (n.d.). Equilibrium relative humidity: Saturated salt solutions. https://www.omega.com/temperature/z/pdf/z103.pdf, accessed on Aug. 12, 2026.
[25] ASTM C642-21. (2022). Standard Test Method for Density, Absorption, and Voids in Hardened Concrete. ASTM International. https://doi.org/10.1520/C0642-21
[26] Iwaki, I., Kimura, Y., Miura, T. (2004). A study on shrinkage behavior of concrete depending on ambient temperature and relative humidity. Concrete Research and Technology, 15(3): 15-24. https://doi.org/10.3151/crt1990.15.3_15
[27] Bažant, Z.P. (1988). Mathematical Modeling of Creep and Shrinkage of Concrete. John Wiley & Sons Ltd. http://www.civil.northwestern.edu/people/bazant/PDFs/Backup%20of%20Papers/S21.pdf.