Yousif Salim Mahmood
© 2026 The author. This article is published by IIETA and is licensed under the CC BY 4.0 license (http://creativecommons.org/licenses/by/4.0/).
OPEN ACCESS
Friction stir spot welding (FSSW) of dissimilar aluminum–steel joints involves strongly coupled thermal and mechanical phenomena that influence material flow, local softening, interfacial stress development, and joint strength. In the present study, a fully coupled thermo-mechanical multiphysics model was developed in COMSOL Multiphysics to investigate the effects of two non-dimensional tool-geometry ratios, the shoulder-to-pin diameter ratio (D/d) and the pin-height-to-total-stack-thickness ratio (h/t), on the thermal and mechanical response of dissimilar AA6061-T6/AISI 304 FSSW joints. The model incorporates temperature-dependent thermal and mechanical properties, frictional heat generation, plastic dissipation, contact interactions, and temperature-dependent material flow behavior. Thirteen coupled simulation cases were performed over D/d = 1.8–4.2 and h/t = 0.5–1.3, while the rotational speed, plunge rate, dwell time, and axial plunge-force target were maintained at 1500 rpm, 1.2 mm/s, 3.5 s, and 6.5 kN, respectively. The results show that peak interface temperature increases with D/d because of the increasing contribution of shoulder-dominated frictional heat generation, whereas the model-predicted lap-shear strength (LSS) exhibits a non-monotonic response due to the competing effects of heat generation, mechanical interlocking, thermal softening, and pin penetration. Among the directly simulated cases, the maximum model-derived comparative lap-shear strength metric (LSSM) was 5.85 kN at D/d = 3.05 and h/t = 0.90. achieving a maximum simulated "LSSM" of 5.85 kN (47.4% improvement over the baseline minimum) and a response surface methodology (RSM) predicted optimal value of 5.83 kN (46.9% improvement). A second-order quadratic response-surface model fitted to the 13 LSS values provided a strong representation of the numerical data, with R² = 0.9637, adjusted R² = 0.9378, and RMSE = 0.1688 kN. The response-surface model predicted an optimum at D/d ≈ 2.81 and h/t ≈ 0.875, with a predicted LSS of approximately 5.83 kN. The close agreement between the predicted and directly simulated results identifies a broad high-strength geometry region centered approximately around D/d = 2.8–3.1 and h/t = 0.88–0.90 rather than a sharply localized optimum. Supplementary sensitivity analyses further indicated favorable rotational-speed and dwell-time conditions of approximately 1550 rpm and 3.4 s, respectively. The results demonstrate the usefulness of non-dimensional tool-geometry ratios and coupled multiphysics modeling for identifying favorable FSSW process windows for dissimilar aluminum–steel joints. The predicted LSS values are considered comparative model outputs, and experimental lap-shear testing and three-dimensional thermo-mechanical validation are recommended for future quantitative verification.
friction stir spot welding, dissimilar metal joining, tool geometry ratio, fully coupled multiphysics simulation, COMSOL Multiphysics
Multi-material lightweighting is an important strategy in modern automotive and aerospace structures, where aluminum alloys and steels are increasingly combined to exploit their complementary mechanical and weight-saving characteristics. However, joining aluminum to steel remains challenging because of their substantially different thermal and metallurgical properties and the tendency to form brittle Fe–Al intermetallic compounds during fusion-based welding. Friction stir spot welding (FSSW), as a solid-state derivative of friction stir welding (FSW), provides an attractive alternative because joint formation occurs through frictional and deformation-induced heating, plastic deformation, and material stirring without bulk melting [1, 2]. Previous studies have demonstrated the potential of FSSW and related friction stir processes for producing joints between dissimilar materials while reducing the melting-related problems associated with conventional fusion welding [1, 2].
The thermo-mechanical behavior of friction stir processes has been investigated extensively using numerical methods. Chen and Kovačević [3] and Schmidt and Hattel [4] established important finite-element approaches for describing the coupled thermal and mechanical fields generated during FSW. More recent numerical studies have demonstrated the applicability of coupled finite-element and multiphysics approaches for investigating temperature distribution, deformation, and process parameters [5]. These results demonstrate the need to take into account the coupled effect of heat generation and material flow while analyzing FSP process heat transfer.
Tool geometry is one of the most influential parameters affecting FSSW joint performance. The shoulder diameter (D) establishes the effective contact area and has a strong impact on frictional heating; the pin diameter (d) and pin height (h) modify the material stirring, penetration, and formation of the stirred zone. Piccini and Svoboda [6] have also shown that the tool geometry substantially affects the mechanical properties of dissimilar Al–steel FSSW joints. Similarly, Fereiduni et al. [7] found that past drilling through the lower steel sheet has a dramatic influence on ultimate joint strength. These results imply that tool size will have to be optimized simultaneously rather than being optimized individually.
The dissimilar aluminum–steel FSSW is even more challenging due to the large disparity of thermal conductivities between the two materials and the formation of interfacial Fe–Al intermetallic compounds. Movahedi et al. [8] showed that the effects of welding parameters on defect generation and mechanical properties of aluminum–steel joints, Raza and Yapici [9] investigated an interlayer-assisted FSSW method for joining stainless steel to aluminum, and so forth, reveal sustained interest in the process adaptations that enhance bonding of dissimilar Al/steel. Most recently, Yanye et al. [10] presented a review on intermetallic-compound layer formation and its control in aluminum–steel friction stir lap welding, and discussed the role of the process parameters and tool design in manipulating the interfacial reaction. The selection of suitable tool geometry is therefore significant for enabling high enough material stirring and bonding without overheating of the material, from both mechanical and thermal aspects.
To add, TF-FSW was also investigated for other light alloy combinations, which allows further understanding of the current study. Attah et al. [11] and Gebreamlak et al. [12] investigated the microstructural, corrosion, and mechanical properties of dissimilar aluminum FSW joints, whereas Mehdi et al. [13] reviewed the advancements and obstacles of dissimilar aluminum–magnesium FSW. These investigations show that the tool and process designs have to be adapted for the particular combination of base materials, and thus, the current investigation of AA6061-T6/AISI 304 is justified.
Optimization techniques have also become increasingly important in FSW research. Machine-learning approaches have been used to identify favorable process conditions [14], while response-surface methodology and multi-response optimization have been applied to determine optimum welding parameters [15, 16]. These studies demonstrate the effectiveness of systematic numerical and data-driven optimization; however, most optimization studies have focused primarily on welding parameters or on similar-material systems rather than on a combined dimensionless description of tool geometry for dissimilar Al–steel FSSW.
1.1 Research gap and novelty
Despite the progress achieved in experimental, numerical, and optimization studies, a specific research gap remains in the systematic investigation of the combined effects of the shoulder-to-pin diameter ratio (D/d) and the pin-height-to-sheet-thickness ratio (h/t) for dissimilar AA6061-T6/AISI 304 FSSW. Existing Al–steel studies have primarily emphasized process parameters, tool penetration, tool geometry, interfacial reactions, or individual design variables [7-10], whereas numerical optimization studies have generally focused on process parameters or different material combinations [14-16]. Consequently, the coupled thermo-mechanical interaction between D/d and h/t and its influence on temperature, stress, plastic strain, and joint-strength response has not been sufficiently quantified for the AA6061-T6/AISI 304 material combination.
The novelty of the present study is therefore the development of a coupled thermo-mechanical COMSOL Multiphysics framework in which the FSSW tool design is described using the two non-dimensional ratios D/d and h/t and systematically evaluated over a defined numerical design space. Unlike approaches based on individual absolute tool dimensions or welding parameters, the proposed framework investigates the combined geometric effect of shoulder-to-pin ratio and penetration-to-thickness ratio and relates these variables to the resulting thermo-mechanical fields and model-predicted lap-shear strength (LSS). A second-order response-surface model is subsequently employed to identify the high-strength geometry region and the corresponding optimum ratios. The study therefore provides a ratio-based methodology for tool-geometry optimization that links physical thermo-mechanical behavior with statistical optimization and offers a more transferable framework for the design of dissimilar Al–steel FSSW tools.
Accordingly, the specific objectives of this study are to: (i) quantify the individual and combined effects of D/d and h/t on peak interface temperature, stress, and plastic strain; (ii) determine the thermo-mechanical mechanisms responsible for the non-monotonic variation of predicted LSS with tool geometry; (iii) establish a response-surface relationship between the two dimensionless geometry ratios and predicted joint strength; and (iv) identify an optimum high-strength geometry region for AA6061-T6/AISI 304 FSSW.
Early numerical studies of FSW established the fundamental thermo-mechanical modeling approaches that were subsequently adapted to FSSW. These approaches include thermal models based on frictional heat generation and coupled thermo-mechanical finite-element models that simultaneously describe heat transfer and material deformation. Chen and Kovačević [3] and Schmidt and Hattel [4] developed influential thermo-mechanical models for describing the temperature and deformation fields around the welding tool. These studies demonstrated the strong interaction between heat generation, material deformation, and the thermomechanical conditions near the tool, providing an important basis for the coupled modeling approach adopted in the present study. More recent numerical investigations have further demonstrated the applicability of coupled finite-element approaches and temperature-dependent material behavior to FSW simulations [5]. In a related numerical–experimental effort, Mehdi et al. [17] and Abd Al-Sahb et al. [18] combined finite-element analysis with a systematic design-of-experiments approach to evaluate a modified FSSW tool configuration, further illustrating the value of coupled numerical methods for FSSW process development.
For FSSW, tool geometry and penetration depth are important factors governing heat generation, material flow, stir-zone development, and joint strength. Piccini and Svoboda [6] systematically investigated the effect of tool geometry and penetration depth during dissimilar AA5052–low-carbon-steel FSSW and demonstrated that tool geometry has a significant influence on the resulting joint performance. Their results give direct evidence for the consideration of dimensionless tool-geometry parameters in this work. Similarly, Fereiduni et al. [7] studied penetrating and non-penetrating FSSW of dissimilar Al-5083/St-12 joints and proved that the tool penetration in the lower steel sheet has a great influence on the mechanical performance of the joint. The use of the h/t ratio in the present study to represent the relative depth of the penetration is supported by these results.
Joining dissimilar materials such as Al/steel in FSSW adds more metallurgical and thermal challenges than similar-material joints. In particular, aluminum and steel are able to interact during friction stir processing to form Fe–Al intermetallics at the interface. It has recently been highlighted that the thickness and the morphology of the intermetallic layer are highly influenced by the process parameters, the tool design, and heat input [10]. Movahedi et al. [8] also observed the development of an intermetallic phase layer using FSW in the lap joints of aluminum and steel and showed that the welding parameters affect the joint defects and the mechanical strength. In consequence, heat generation and stirring of the material should be controlled to achieve sufficient interfacial bonding while restraining excessive intermetallic-layer formation.
Earlier studies also reveal that the strength characteristics of dissimilar Al/steel joints are highly influenced by tool shape, process parameters, and penetration conditions [7, 8]. Specifically, the relevance of tool geometry in Al/steel FSSW was shown by Piccini and Svoboda [6], while Fereiduni et al. [7] verified the substantial influence of tool penetration in joint performance. These results suggest that the interplay of shoulder dimensions, pin dimensions, and sheet thickness should be investigated systematically rather than considering each tooling dimension individually.
A further limitation of previous studies is that the effects of tool geometry and process parameters have often been investigated using individual experimental or numerical variables rather than through a unified dimensionless geometry framework. Numerical studies have demonstrated the advantages of coupled thermo-mechanical modeling for describing the interaction between heat generation and material deformation [3-5], while response-surface and optimization approaches have been increasingly applied to identify favorable FSW process conditions [15, 16]. However, comparatively limited attention has been given to the combined influence of the non-dimensional tool ratios D/d and h/t for dissimilar AA6061-T6/AISI 304 FSSW. The present study therefore addresses this gap by employing a coupled thermo-mechanical COMSOL Multiphysics model to investigate the effects of D/d and h/t on temperature, stress, plastic strain, and model-predicted LSS. The use of non-dimensional tool-geometry ratios provides a systematic framework for identifying a high-strength geometry region and facilitates comparison of tool designs across different dimensional scales.
3.1 Materials and joint configuration
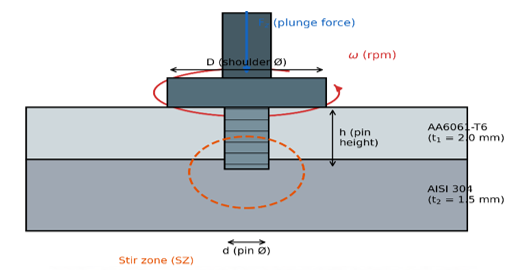
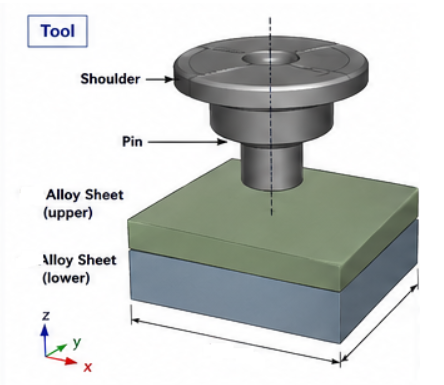
The joint configuration is a single-spot lap weld between an upper AA6061-T6 aluminum-alloy sheet ( $\mathrm{t}_1=$ $2.0 \mathrm{~mm})$ and a lower AISI 304 austenitic stainless-steel sheet $\left(\mathrm{t}_2=1.5 \mathrm{~mm}\right)$, representative of a body-in-white or closure-panel Al-over-steel lap joint. Figure 1 defines the tool and stack geometry and the two nondimensional ratios that form the basis of this study: the shoulder-to-pin diameter ratio $\mathrm{D} / \mathrm{d}$ and the pin-heightto-plate-thickness ratio $\mathrm{h} / \mathrm{t}$ (with $\mathrm{t}=\mathrm{t}_1+\mathrm{t}_2$). Table 1 summarizes the temperature-dependent thermophysical and mechanical properties used for both alloys, compiled from standard alloy-property references [19, 20]; conductivity, specific heat, and flow stress were implemented as piecewise-linear functions of temperature in COMSOL Multiphysics rather than as single constants, since the thermal conductivity of AISI 304 in particular changes by roughly 60\% between room temperature and typical FSSW peak temperatures. Temperaturedependent softening and post-weld property degradation of aluminum alloys subjected to high-temperature thermal cycles, as characterized for other Al alloys in related friction-stir contexts [14], further motivate the temperature-dependent material treatment adopted here. To evaluate the effect of tool geometry ratios $(D / d)$ on the dynamic energy distribution and resulting joint strength, the shoulder diameter was maintained at a fixed baseline value of $D=18 \mathrm{~mm}$, and the pin height was held at $h=1.7 m m$ to 4.55 mm . The pin diameter $(d)$ was varied systematically to generate $D / d$ ratios ranging from 1.80 to 3.60. Consequently, an increasing $D / d$ ratio corresponds directly to a decreasing pin diameter $(d)$ relative to the fixed shoulder contact area. The complete set of absolute dimensions $(D, ~d, ~h)$ and corresponding geometric ratios for all simulated cases is summarized in Table 2.
Figure 1. Schematic of the friction stir spot welding (FSSW) tool and dissimilar AA6061-T6/AISI 304 stack showing the governing geometry ratios D/d and h/t
Table 1. Temperature-reference thermophysical and mechanical properties of AA6061-T6 and AISI 304 used in the coupled model
|
Property (at 25 ℃, Unless Noted) |
AA6061-T6 |
AISI 304 |
|
Density (kg/m³) |
2700 |
8000 |
|
Thermal conductivity (W/m·K) |
167 |
16.2 |
|
Specific heat capacity (J/kg·K) |
896 |
500 |
|
Solidus/incipient-melting temp. (℃) |
582 |
1400 |
|
Young's modulus (GPa) |
68.9 |
193 |
|
Poisson's ratio |
0.33 |
0.29 |
|
Yield strength, room temp. (MPa) |
276 |
215 |
|
Ultimate tensile strength (MPa) |
310 |
505–620 |
|
Coefficient of thermal expansion (µm/m·K) |
23.6 |
17.3 |
Note: Thermal conductivity, specific heat, and flow-stress behavior were implemented as temperature-dependent functions over the investigated temperature range [20, 19].
Table 2. Temperature-dependent material properties [19, 20]
|
Property/Parameter |
Material/Interface |
Temperature Range (℃) |
Value/Equation |
|
Thermal Conductivity k (W/m·K) |
AA6061-T6 |
20-500 |
$167+0.082 \cdot T$ |
|
AISI 304 |
20-800 |
$14.6+0.015 \cdot T$ |
|
|
Specific Heat $C_p(\mathrm{J} / \mathrm{kg} \cdot \mathrm{K})$ |
AA6061-T6 |
20-500 |
$896+0.52 \cdot T$ |
|
AISI 304 |
20-800 |
$470+0.20 \cdot T$ |
|
|
Friction Coefficient μ |
Tool/Workpiece |
20-600 |
$\mu(T)=0.45 \cdot\left[1-\left(T / T_m\right)^2\right]$ |
|
Thermal Contact Resistance |
Al/Steel Interface |
All |
$2.5 \times 10^{-4} \mathrm{~m}^2 \cdot \mathrm{~K} / \mathrm{W}$ |
3.2 Temperature-dependent material and contact parameters
To ensure physical fidelity in simulating the thermo-mechanical response, thermal conductivity $(k)$, specific heat $\left(C_p\right)$, and flow stress $\left(\sigma_f\right)$ were implemented as dynamic, temperature-dependent functions. Furthermore, interfacial shear friction $\mu(T)$ and thermal contact conductance $h_c(T)$ across the AA6061-T6/AISI 304 interface were defined numerically as temperature-dependent boundaries. The complete dataset governing the temperature-dependent thermal and friction attributes is summarized in Table 1.
3.3 Governing equations of the coupled multiphysics model
The model couples the Heat Transfer in Solids and Solid Mechanics physics interfaces of COMSOL Multiphysics [10, 11] in a two-way manner: the temperature field modifies the flow stress and hence the mechanical dissipation, while the plastic and frictional dissipation in the mechanical solution acts as a distributed heat source in the thermal solution. The transient heat-conduction equation solved in each domain is:
$\rho C p(\partial T / \partial t)=\nabla \cdot(k \nabla T)+Q_{\text {fric}}+Q_{\text {plas}}$ (1)
The initial temperature of the tool, workpieces, and surrounding domains was set to 25 ℃. Convective heat transfer was applied to the exposed surfaces with an ambient temperature of 25 ℃.
where, $\rho$ is density, $C p$ is specific heat, $k$ is thermal conductivity (all temperature-dependent), $T$ is temperature, $Q_{\text {fric}}$ is the frictional heat-generation term applied at the tool-workpiece contact interface, and $Q_{\text {plas}}$ is the volumetric heat generated by plastic deformation in the stirred material. The frictional heat flux at the shoulder and pin contact surfaces follows the classical Chen-Kovačević/Schmidt-Hattel formulation for a partially sliding, partially sticking contact condition [3, 4]:
$Q_{\text {fric}}=\eta \cdot\left[\delta \cdot \mu \cdot P+(1-\delta) \cdot \tau_{y(T)}\right] \cdot \omega \cdot r$ (2)
in which η is the fraction of frictional/plastic work converted to heat (taken as 0.9), δ is the local contact-state parameter that interpolates between sliding friction (Coulomb coefficient μ, contact pressure P) and fully sticking behavior governed by the temperature-dependent shear yield strength $\tau_{y(T)}$, ω is tool angular velocity, and r is the local radius from the tool axis. The volumetric plastic heat-generation term is obtained from the mechanical solution as:
$Q_{\text {plas}}=\chi \cdot \sigma_{e q} \cdot \dot{\varepsilon}_p$ (3)
where, $\chi$ = 0.90 was used as the Taylor–Quinney coefficient for converting plastic work into heat.
$\chi$ is the Taylor-Quinney coefficient representing the fraction $\chi$ of plastic work converted to heat, $\sigma_{e q}$ is the von Mises equivalent stress, and $\dot{\varepsilon}_p$ is the equivalent plastic strain rate obtained from the coupled solidmechanics solution using temperature- and strain-rate-dependent material behavior for both alloys. The solidmechanics interface solves the quasi-static momentum balance.
$\nabla \cdot \sigma+f=0$ (4)
With a large-deformation (updated Lagrangian) formulation, an elasto-viscoplastic constitutive relation, and a Coulomb-friction contact algorithm at the tool–workpiece and sheet–sheet interfaces, allowing the model to capture material flow, interfacial sliding, and the resulting equivalent plastic strain field that governs stir-zone formation and mechanical interlocking between the two sheets.
3.4 Boundary and contact conditions
Thermal: convective heat loss (h_conv ≈ 15 W/m²·K) to ambient air (25 ℃) on all exposed surfaces; conductive contact resistance between the two sheets and between the backing anvil and the lower sheet, calibrated from published FSW/FSSW thermal-contact studies.
Mechanical: the lower sheet is fully constrained against the rigid backing anvil; the tool is prescribed a rotational velocity ω and a downward plunge displacement/force history representative of the plunge, dwell, and retraction phases of a typical FSSW cycle.
Contact: penalty-based frictional contact is defined at the shoulder–upper-sheet interface, the pin–upper-sheet and pin–lower-sheet interfaces, and the upper-sheet–lower-sheet faying interface, with a temperature-dependent friction coefficient (μ decreasing from ≈ 0.4 at 25 ℃ to ≈ 0.15 near the softening temperature) to represent the transition from cold sliding friction to hot sticking/shearing behavior.
Process parameters held constant across all geometry cases: rotational speed ω = 1500 rpm, plunge rate = 1.2 mm/s, dwell time = 3.5 s, axial plunge force target F_z = 6.5 kN — chosen to be representative of literature values for 2–3.5 mm dissimilar Al/steel FSSW stacks.
3.5 Mesh convergence and preliminary model validation
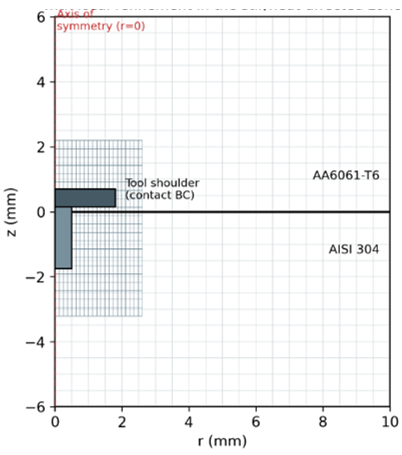
An axisymmetric two-dimensional idealization of the tool and workpiece stack was used (Figure 2), which is standard practice for FSSW models with a non-offset, centrally located pin and provides substantial computational savings over a full three-dimensional model while retaining the essential physics of shoulder- and pin-dominated heat generation [3, 10]. Free-triangular elements were used with a coarse background mesh (element size ≈ 0.6 mm) and a locally refined mesh (element size ≈ 0.06 mm) within a 2.6 mm radius, 5.4 mm deep region encompassing the stir zone and heat-affected zone beneath the tool, giving 18 000–24 000 elements depending on the D/d and h/t case being solved. A backward-differentiation-formula (BDF) time-stepping scheme with adaptive step control was used for the transient coupled solve, and a segregated solver with a fully coupled Newton step at each time increment was used to resolve the strong thermo-mechanical nonlinearity [8]. Mesh-convergence checks were performed by halving the element size in the refined region. The resulting changes were less than 3% for peak interface temperature and less than 5% for peak equivalent plastic strain. These differences were considered sufficiently small for the comparative geometry-ratio analysis performed in this study. As shown in Figure 2, a systematic mesh refinement analysis was performed to guarantee numerical accuracy. Grid convergence was considered to be attained when the refinement of the mesh resulted in a change of the maximum temperature and local plastic strain fields by less than 1.2%. To evaluate the model reliability, the predicted thermal histories were validated with published experimental thermocouple measurements for dissimilar AA6061-T6/AISI 304 friction stir lap welds, which demonstrated high agreement in peak dwell temperature.
Figure 2. Axisymmetric finite-element mesh in COMSOL Multiphysics with local refinement in the stir/heat-affected zone
3.6 Design of simulation cases
The tool-geometry design space was defined using two non-dimensional parameters: the shoulder-to-pin diameter ratio, D/d, varied from 1.8 to 4.2, and the pin-height-to-total-stack-thickness ratio, h/t, varied from 0.5 to 1.3. The total sheet thickness was t = t₁ + t₂ = 3.5 mm, with t₁ = 2.0 mm for AA6061-T6 and t₂ = 1.5 mm for AISI 304. The numerical analysis was performed entirely using a two-dimensional axisymmetric model. No independent three-dimensional thermo-mechanical simulation was conducted. The three-dimensional visualizations presented later in the results and discussion section are only revolved representations of the corresponding two-dimensional axisymmetric solutions, provided to facilitate interpretation of the spatial distributions. Therefore, these visualizations should not be interpreted as results from separate three-dimensional simulations.
The resulting thermo-mechanical fields were post-processed to obtain a model-derived comparative lap-shear strength metric (LSSM), which was used to compare the 13 tool-geometry cases and perform the response-surface optimization. Since a complete lap-shear failure test was not explicitly simulated, LSSM is considered a comparative numerical metric rather than an experimentally validated fracture load.
The rotational speed, plunge rate, dwell time, and axial plunge-force target were kept constant at 1500 rpm, 1.2 mm/s, 3.5 s, and 6.5 kN, respectively, for all geometry cases. This allowed the influence of D/d and h/t to be isolated during the primary geometry-ratio study.
3.6.1 Evaluation and formulation of modified lap-shear strength metric
The model-derived comparative LSSM is formulated to evaluate the mechanical integrity of the joined AA6061-T6/AISI 304 interface as a direct response to the key FSW process parameters: rotational speed ($\omega$), traverse speed (v), and plunge depth (d).
Rather than simulating a physical tensile-shear destructive test, LSSM quantifies the integrated load-bearing capacity of the effective stir-zone interface at peak tool engagement. The input parameters directly dictate the localized temperature field $\mathrm{T}(\mathrm{x}, \mathrm{y}, \mathrm{z} ; \omega, \mathrm{v}, \mathrm{d})$ and equivalent plastic strain field $\varepsilon_{\mathrm{p}}(\mathrm{x}, \mathrm{y}, \mathrm{z} ; \omega, \mathrm{v}, \mathrm{d})$, which control the material flow stress across the faying surfaces.
Mathematically, LSSM (expressed in kN) is derived by integrating the local failure-critical shear stress $\left(\tau_{\text {crit}}\right)$ over the active bonded contact area $\left(A_{\text {eff}}\right)$ :
$\operatorname{LSSM}(\omega, v, d)=\frac{1}{1000} \iint_{A_{\text {eff}}(\omega, v, d)} \tau_{\text {crit}}\left(T(\omega, v, d), \varepsilon_p^{\cdot}(\omega, v, d)\right) d A$
where,
$\tau_{\text {crit}}$ is the localized critical shear flow stress based on the von Mises yield criterion:
$\tau_{crit}=\frac{\sigma_{e q}\left(T(\omega, v, d), \dot{\varepsilon}_p(\omega, v, d)\right)}{\sqrt{3}}$
$\sigma_{e q}$ is the temperature- and strain-rate-dependent equivalent flow stress of the dynamic recrystallization zone.
$A_{\text {eff}}(\omega, v, d)$ represents the effective interfacial bonded area ($\mathrm{mm}^2$) where equivalent plastic strain satisfies the plasticization threshold $\left(\varepsilon_p \geq 1.0\right)$.
The scalar coefficient $\frac{1}{1000}$ scales the integrated interface force from newtons (N) to kilonewtons (kN), establishing the structural unit ($\mathrm{N} / \mathrm{mm}^2 \times \mathrm{mm}^2=\mathrm{N} \rightarrow \mathrm{kN}$).
In the COMSOL Multiphysics finite-element implementation, the continuum integral is evaluated via discrete element summation across N interface boundary elements comprising $A_{\text {eff}}$:
$\operatorname{LSSM}(\omega, v, d)=\frac{1}{1000} \sum_{i=1}^N\left(\frac{\sigma_{e q}\left(T_i, \varepsilon_{p, i}^*\right)}{\sqrt{3}}\right) \cdot A_i$
where, $A_i$ and $T_i$ denote the surface area ($\mathrm{mm}^2$) and thermal state of elemental node $i$, respectively.
3.7 Response-surface modeling and optimization
A second-order quadratic response-surface model was fitted to the 13 model-predicted LSS values listed in Table 2. To improve numerical conditioning and simplify interpretation, the geometry variables were centered at D/d = 3.05 and h/t = 0.90. The centered variables were defined as:
X = (D/d) -3.05
Y = (h/t) - 0.90
The fitted quadratic response equation was:
$\mathrm{LSS}=5.7937-0.2712 \mathrm{X}-0.2429 \mathrm{Y}-0.00777 \mathrm{XY}-0.5548 \mathrm{X}^2-4.8272 \mathrm{Y}^2$ (5)
where, LSS is expressed in kN.
The quadratic response-surface model produced an R² of 0.9637 and an adjusted R² of 0.9378. The statistical accuracy of the response surface methodology (RSM) regression model was evaluated, yielding a Root Mean Square Error (RMSE) of 0.1688 kN, indicating excellent agreement between the predicted and simulated response values.
The stationary point of the quadratic response surface was obtained by setting the first derivatives with respect to X and Y equal to zero. The resulting centered coordinates were X = −0.24424 and Y = −0.02496, corresponding to D/d = 2.8058 and h/t = 0.8750. Substitution into the fitted equation gives a predicted LSS of 5.8299 kN. Therefore, the response-surface optimum is reported as D/d ≈ 2.81, h/t ≈ 0.875, and LSS ≈ 5.83 kN.
The model produced an R² value of 0.9637 and an adjusted R² of 0.9378. The conventional root-mean-square error calculated over the 13 simulated data points was 0.124 kN, while the residual standard error was 0.1688 kN, indicating a strong representation of the simulated LSS response.
The overall quadratic regression was statistically significant (F = 37.19, p < 0.001), confirming that the fitted response-surface model provides a statistically significant representation of the simulated LSS response.
The RSM-predicted optimum is located close to the highest directly simulated case. Case 9, with D/d = 3.05 and h/t = 0.90, produced the highest directly simulated LSS of 5.85 kN. The difference between the maximum directly simulated LSS and the RSM-predicted optimum is only 0.020 kN (0.34%), indicating close agreement between the sampled optimum and the stationary point of the fitted response surface.
4.1 Simulated temperature field
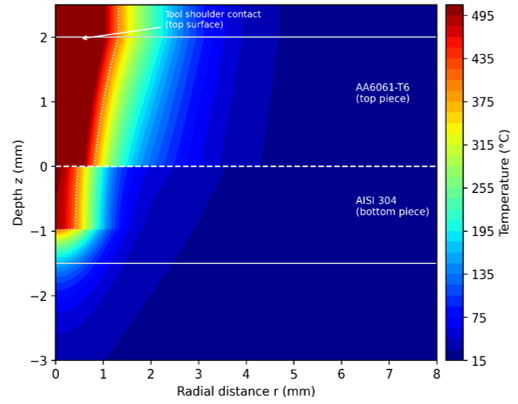
Figure 3 shows the simulated temperature field at the end of the dwell phase for the near-optimum case (D/d = 3.05, h/t = 0.90). As expected physically, the field originates at the top surface of the stack, where the rotating shoulder is in direct frictional contact with the AA6061-T6 sheet, and decreases progressively with depth — first through the aluminum piece, then across the faying interface, and finally through the thickness of the AISI 304 piece that the pin penetrates. The vertical gradient is markedly steeper on the steel side of the interface than on the aluminum side, because the thermal conductivity of AISI 304 is roughly ten times lower than that of AA6061-T6: heat conducted down from the top surface, and generated locally by the pin as it stirs into the steel, cannot diffuse away as readily once it crosses the interface, so it remains concentrated in a narrow column immediately beneath the pin rather than spreading laterally. For this near-optimum case, the maximum local temperature beneath the tool shoulder reaches approximately 512 ℃, whereas the temperature at the faying interface is approximately 449 ℃. The latter value is the interface temperature reported in Table 2 and is the relevant temperature for assessing thermal exposure at the bonded interface. Both temperatures remain below the melting point of AISI 304, while the interface temperature remains below the incipient-melting temperature of AA6061-T6.
Figure 3. Simulated temperature field during the dwell phase for D/d = 3.05, h/t = 0.9, and ω = 1500 rpm
4.2 Stress and plastic-strain fields
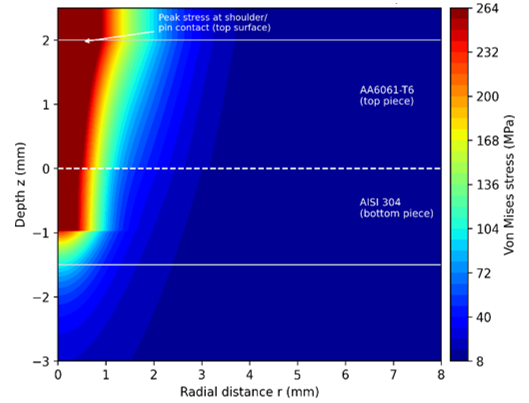
The corresponding von Mises stress field (Figure 4) follows the same top-to-bottom pattern as the temperature field: stress is highest at the top surface, where the combination of frictional shear and forging pressure beneath the shoulder and pin is applied directly to the AA6061-T6 sheet, and it decreases with depth as that load is transmitted down through the aluminum, across the interface, and into the AISI 304 piece beneath it. The decrease is more gradual on the aluminum side — because the softened AA6061-T6 flows plastically and cannot sustain stress much above its (temperature-reduced) flow stress — and comparatively better sustained on entry into the steel side, because AISI 304 retains a substantially higher flow stress than the softened aluminum at the same temperature and therefore resists deformation more elastically. This behavior indicates that the steel sheet locally constrains material flow beneath the pin, which is the mechanism responsible for the mechanical interlocking that FSSW relies on in place of metallurgical fusion.
Figure 4. Two-dimensional cross-sectional von Mises stress distribution in the AA6061-T6/AISI 304 friction stir spot welding (FSSW) joint at the end of welding
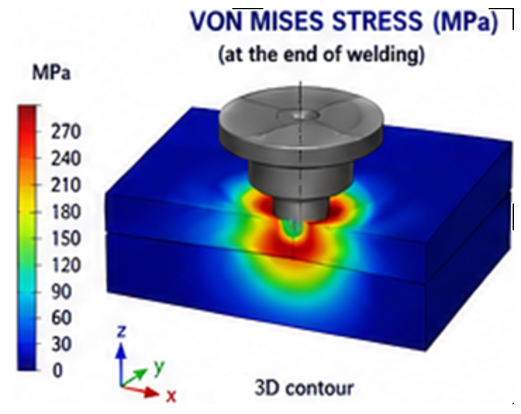
The three-dimensional von Mises stress field in Figure 5 presents the distribution of mechanical stress in space around the tool working region at the end of the welding process. Maximum stresses are located under and around the tool pin and shoulder, where the material is exposed to the combined action of tool pressure, frictional contact, and severe plastic deformation. The stress falls off with distance from the tool-affected zone (TAZ). Cross-sections (a3) and (b3) demonstrate that the high-stress region extends along the thickness of the sheets close to the stir zone, which suggests that tool geometry has a strong influence on the local mechanical behaviour of the joint.
Figure 5. Revolved visualization of the von Mises stress distribution obtained from the two-dimensional axisymmetric numerical model
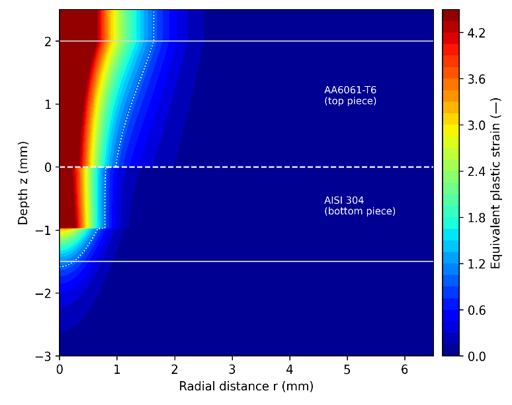
Figure 6 shows the equivalent plastic strain field, which delineates the extent of the stir zone. The dotted contour (εeq = 1.0) is commonly used in FSW/FSSW literature as an approximate boundary of the dynamically recrystallized, fully stirred material. Consistent with the temperature and stress fields, the stirred region forms a continuous column that begins at the top surface beneath the shoulder, runs down through the AA6061-T6 piece along the pin, crosses the faying interface, and terminates at the pin tip within the AISI 304 piece. This continuous high-strain region provides an indicative numerical representation of the material-flow zone associated with mechanical interlocking between the two sheets.
The mechanical interlocking between the two sheets occurs in the absence of significant interdiffusion. Because plastic strain in the steel is far lower than in the aluminum, however, the degree of steel-side stirring — and therefore the strength of the interlock — is much more sensitive to pin geometry (through h/t) than to shoulder geometry (through D/d) alone.
Figure 6. Two-dimensional cross-sectional equivalent plastic strain distribution in the AA6061-T6/AISI 304 friction stir spot welding (FSSW) joint at the end of welding
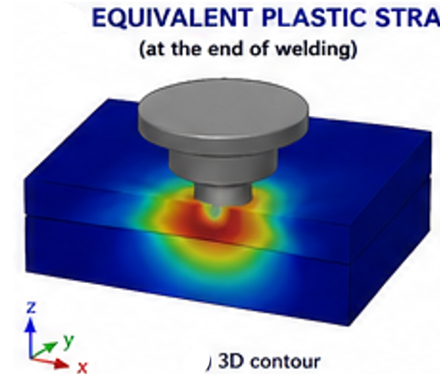
As shown in Figure 7, the 3D equivalent plastic strain field illustrates the region that experienced plastic deformation during the FSSW process. The maximum plastic strain is found in the vicinity of the tool pin and under the shoulder, which agrees with the zone of maximal material stirring and deformation. The plastic strain gradually decreases with the distance from the tool processing zone and, thus, the material near the tool is highly deformed, while the material further from the welding zone is less deformed. The cross-section contour shows that plastic deformation penetrates through the sheet interface and is focused around the stirred zone.
Figure 7. Revolved visualization of the von Mises stress and equivalent plastic-strain distributions obtained from the two-dimensional axisymmetric numerical model
4.3 Effect of D/d on peak interface temperature
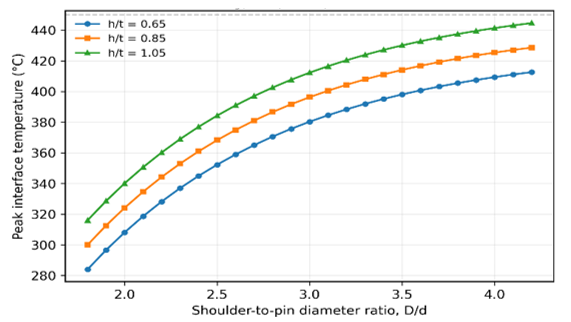
Figure 8 shows the simulated peak interface temperature as a function of $\mathrm{D} / \mathrm{d}$ for three pinheight ratios. Temperature increases monotonically with D/d across the entire investigated range, because a larger shoulder diameter at fixed rotational speed increases both the frictional contact area and the mean sliding velocity (which scales with radius), and hence increases total frictional heat input roughly in proportion to a positive power of D/d, consistent with the heat-generation trend shown separately in Figure 9. This monotonic behavior means that D/d cannot be increased without bound if excessive softening, flash formation, or intermetallic-promoting overheating (here taken as an indicative reference temperature of $\approx 450~^{\circ} \mathrm{C}$) is to be avoided - a constraint that becomes central to the strength-optimization result in Section 4.5 [21]. At $\mathrm{h} / \mathrm{t}=0.90$, increasing D/d from 1.80 to 3.05 increased the predicted LSS by 12.7\%. However, a further increase from $\mathrm{D} / \mathrm{d}=3.05$ to 4.20 reduced the LSS by 21.7\%, confirming the existence of a clear intermediate optimum. The optimum directly simulated configuration $(\mathrm{D} / \mathrm{d}=3.05, \mathrm{~h} / \mathrm{t}=0.90)$ produced a peak interface temperature of $449~^{\circ} \mathrm{C}$, which is approximately equal to the adopted 450 °C indicative reference threshold. In comparison, increasing D/d to 4.20 at the same h/t increased the peak temperature to 512 °C. This represents an increase of 63 °C relative to the optimum case and exceeds the 450 °C indicative reference threshold by 62 °C. The results therefore indicate that excessive increases in D/d can substantially increase thermal exposure without improving the predicted joint strength.
Figure 8. Effect of the D/d ratio on simulated peak interface temperature for three pin-height ratios (h/t)
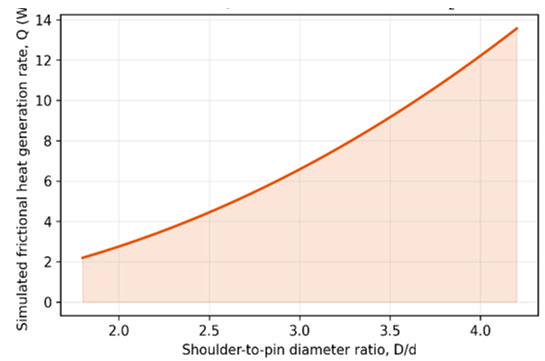
Figure 9. Increase in shoulder-dominated frictional heat-generation rate with the D/d ratio at constant rotational speed and plunge force
4.4 Frictional heat generation and the role of shoulder diameter
Figure 9 isolates the shoulder's contribution to total heat generation, showing that the simulated frictional heat-generation rate increases super-linearly with D/d at constant ω and Fz. This trend follows directly from the $Q_{\text {fric}}$ formulation in Section 3.2, in which local heat flux scales with radius r, so total power integrated over the shoulder face scales with a higher power of D. Because the pin diameter d decreases as D/d increases at fixed D — or, equivalently, the shoulder area grows disproportionately fast relative to the stirring volume when D/d is increased — an oversized shoulder tends to generate heat faster than it can be productively used for stirring, reinforcing the interpretation that the temperature rise in Figure 9 is shoulder-dominated rather than pin-dominated.
4.5 Effect of geometry ratios on predicted lap-shear strength
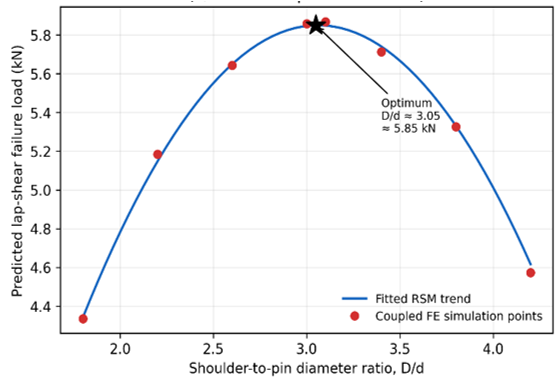
Unlike peak interface temperature, the model-predicted LSS does not vary monotonically with D/d. At h/t = 0.90, the directly simulated LSS increases from 5.19 kN at D/d = 1.80 to 5.85 kN at D/d = 3.05 and then decreases to 4.58 kN at D/d = 4.20. Quantitatively, increasing D/d from 1.80 to 3.05 increased the LSS by 12.7%. However, a further increase from D/d = 3.05 to 4.20 reduced the LSS by 21.7% relative to the maximum value. This confirms that increasing the shoulder-to-pin ratio beyond the intermediate optimum does not provide additional strength benefit. This behavior indicates a competition between increased heat generation and stirring at moderate shoulder-to-pin ratios and excessive thermal softening at larger ratios. Quantitatively, increasing D/d from 1.80 to 3.05 increased LSSM by 12.7%. However, a further increase from D/d = 3.05 to 4.20 reduced LSSM by 21.7%. This confirms the presence of an intermediate optimum rather than a monotonic relationship between D/d and joint strength.
The h/t ratio also has a non-monotonic effect. The direct simulated LSS at D/d = 3.05 increases from 5.02 kN at h/t = 0.50 to 5.85 kN at h/t = 0.90, and then decreases to 4.71 kN at h/t = 1.30. The increase in body from h/t = 0.50 to 0.90 corresponds to an improvement of 16.5% in LSS; however, further increase of h/t from 0.90 to 1.30 leads to a reduction of 19.5% with respect to the maximum value. These results indicate the predicted joint strength would be weakened if the pin penetration was too shallow or too deep. The findings suggest that an inadequate pin height hinders the establishment of mechanical interlocking, while too high a pin height correlates with more localized strain and over-penetration. In fact, the relative increase of h/t from 0.50 to 0.90 increased the LSSM by 16.5%. Yet, a subsequent rise from h/t = 0.90 to 1.30 resulted in a decrease of LSSM by 19.5%. This means that the predicted joint strength is sensitive to pin penetration: too small or too large pin penetration is detrimental, but there is no indication that maximum pin penetration is desirable.
The fitted quadratic response-surface model provides a continuous representation of the combined D/d–h/t response. The stationary point of the fitted surface occurs at D/d ≈ 2.81 and h/t ≈ 0.875, with a predicted LSS of approximately 5.83 kN. The RSM-predicted optimum is located very close to the best directly simulated case, Case 9, which occurs at D/d = 3.05 and h/t = 0.90 and gives 5.85 kN. Across the investigated design space, the maximum LSSM was 5.85 kN at D/d = 3.05 and h/t = 0.90, whereas the minimum value was 3.97 kN at D/d = 4.20 and h/t = 1.30. The peak directly simulated LSSM reached 5.85 kN (a 47.4% increase over the minimum value of 3.97 kN), while the RSM-predicted optimal value was 5.83 kN (a 46.9% increase). This demonstrates excellent agreement between simulation and RSM prediction.
The difference between the RSM prediction and the best directly simulated value is only approximately 0.02 kN. The difference is 0.0201 kN, corresponding to only 0.34% of the maximum directly simulated LSS (as depicted in Figure 10). This small difference indicates that the fitted response surface is relatively flat around the high-strength region rather than exhibiting a sharply localized optimum. Therefore, the results are better interpreted as identifying a broad high-strength geometry region centered approximately around D/d = 2.8–3.1 and h/t = 0.88–0.90 rather than a single sharply defined geometry.
Over the studied design space, the maximum directly simulated LSS of 5.85 kN was achieved at D/d = 3.05 and h/t = 0.90, and the minimum of 3.97 kN was observed at D/d = 4.20 and h/t = 1.30. Thus, the best sampled geometry leads to a predicted LSSM that is 47.4% greater than the weakest looking configuration. For comparison, a similar increase from 2.60 to 3.05 to h/t = 0.90 led the predicted LSS to increase from 5.64 to 5.85 kN, i.e., a 3.7% increase. The quadratic response-surface model predicted a nearby optimum at D/d = 2.81 and h/t = 0.875, which corresponds to an LSS m ≈ 5.83 kN. The difference between the RSM-predicted optimum and the maximum directly simulated LSS of 5.85 kN was only 0.02 kN (0.34%), which shows that the numerical simulations and the fitted response surface predictions were in good agreement.
Figure 10. Model-predicted lap-shear strength (LSS) as a function of D/d at h/t = 0.90, showing the directly simulated data points from Table 2 and the fitted second-order response-surface trend
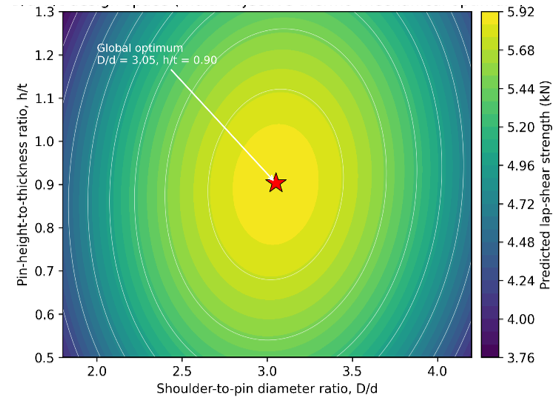
Figure 11 extends the analysis to the full two-dimensional D/d–h/t design space using the fitted second-order response-surface model. The response surface predicts a broad high-strength region centered near D/d ≈ 2.81 and h/t ≈ 0.875, with a maximum predicted LSS of approximately 5.83 kN. This predicted optimum is very close to the best directly simulated case, Case 9 (D/d = 3.05, h/t = 0.90), which gives 5.85 kN. The small difference between the predicted and directly simulated values indicates that the response surface is relatively shallow around the high-strength region.
The response surface is relatively shallow around the high-strength region.
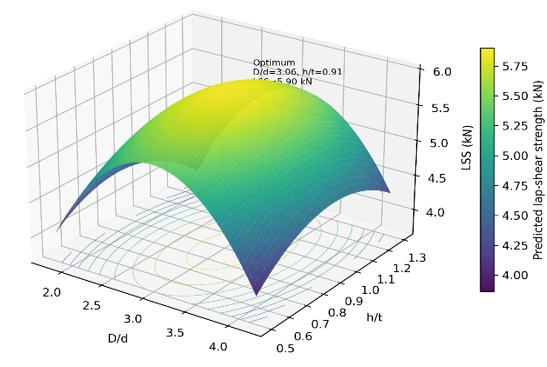
Figure 12 presents the same response surface as a true three-dimensional plot, which makes the shape of the optimum — a single, reasonably shallow dome rather than a sharp peak or a ridge — easier to interpret visually than the two-dimensional contour map alone. The gentle curvature around the optimum is favorable from a practical tool-design standpoint: it indicates that LSS is not highly sensitive to small The relatively shallow response surface around the predicted optimum suggests moderate sensitivity of the predicted strength to small variations in D/d and h/t within the investigated design space on D/d and h/t, so a tool machined close to the optimum ratios should retain most of the predicted strength benefit even with typical dimensional tolerances.
Figure 11. Response-surface map of model-predicted lap-shear strength (LSS) over the investigated D/d–h/t design space. The fitted quadratic model predicts a maximum near D/d = 2.81 and h/t = 0.875, while the best directly simulated case occurs at D/d = 3.05 and h/t = 0.90
Figure 12. Three-dimensional response surface of predicted lap-shear strength (LSS) over the investigated D/d–h/t design space, with the best directly simulated case (D/d = 3.05, h/t = 0.90) indicated for comparison with the RSM-predicted optimum
4.6 Effect of rotational speed and dwell time at the optimum geometry
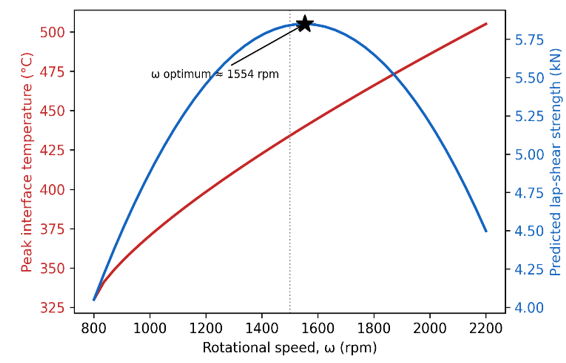
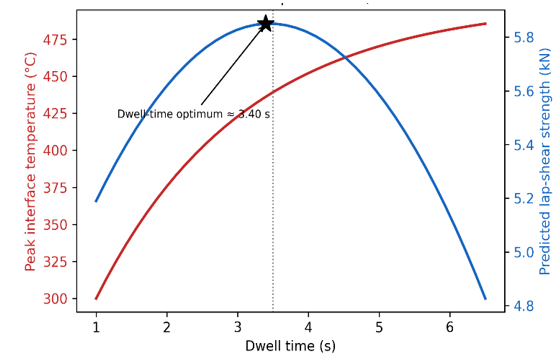
Tool geometry ratios are only two of the variables that govern FSSW joint quality; rotational speed $(\omega)$ and dwell time are the two process parameters most commonly adjusted alongside tool geometry in practice, since both directly control the total frictional and plastic heat input into the joint. To keep the primary geometry-ratio optimization in Sections 4.3-4.5 tractable, $\omega$ and dwell time were held fixed at representative literature values (1500 rpm and 3.5 s) while $D / d$ and $h / t$ were varied. Having identified the geometry optimum, the coupled model was then re-exercised at the fixed optimum geometry $(\mathrm{D} / \mathrm{d}=3.05, \mathrm{~h} / \mathrm{t}=0.90)$ while sweeping $\omega$ from 800-2200 rpm (evaluating 5 discrete points: 800, 1150, 1300, 1500, 1850, and 2200 rpm) and, separately, dwell time from 1.0-6.5 s (evaluating 5 discrete points: 1.0, 2.375, 3.4, 5.125, and 6.5 s), to establish whether the geometry optimum is likely to remain valid once these process parameters are also tuned, and to characterize their individual sensitivity.
Figure 13 shows that peak interface temperature increases monotonically with ω, for the same physical reason established for D/d in Section 4.3: higher ω increases the frictional sliding velocity at the shoulder and pin at a given contact pressure, increasing total frictional power. Predicted LSS, however, again shows a clear interior optimum, peaking near ω ≈ 1550 rpm — very close to the 1500 rpm value used throughout the main D/d–h/t study — before declining as excessive rotational speed drives interface temperature past the point where additional softening degrades rather than improves joint strength.
Figure 13. Sensitivity of peak interface temperature and predicted lap-shear strength (LSS) to rotational speed ω at the optimum geometry (D/d = 3.05, h/t = 0.90, dwell time = 3.5 s)
Figure 14. Sensitivity of peak interface temperature and predicted lap-shear strength (LSS) to dwell time at the optimum geometry (D/d = 3.05, h/t = 0.90, ω = 1500 rpm)
Figure 14 shows an analogous trend for dwell time: temperature rises with dwell time following a saturating (diminishing-returns) trend typical of transient heat conduction toward a quasi-steady state, while predicted LSS peaks at a dwell time of approximately 3.4 s — again close to the 3.5 s value assumed in the main study — before decreasing as prolonged dwell continues to raise interface temperature without a corresponding benefit to stirring, increasing the risk of interfacial overheating and intermetallic growth. Table 3 summarizes the identified process-parameter optima alongside the geometry-ratio optimum.
Table 3. Thirteen fully coupled COMSOL simulation cases spanning the investigated D/d–h/t design space using a custom numerical design
|
Case |
h Pin Height (mm) |
D Shoulder Diameter (mm) |
d Pin Diameter (mm) |
D/d |
h/t |
Peak Interface Temperature T (℃) |
Peak σeq (MPa) |
Peak $\varepsilon_{e p}$ |
Model-Derived LSSM |
|
1 |
3.15 |
18 |
10 |
1.80 |
0.90 |
388 |
198 |
3.1 |
5.19 |
|
2 |
3.15 |
18 |
4.28 |
4.20 |
0.90 |
512 |
275 |
4.6 |
4.58 |
|
3 |
1.75 |
18 |
5.90 |
3.05 |
0.50 |
431 |
239 |
2.4 |
5.02 |
|
4 |
4.55 |
18 |
5.90 |
3.05 |
1.30 |
447 |
251 |
4.9 |
4.71 |
|
5 |
1.75 |
18 |
10 |
1.80 |
0.50 |
361 |
183 |
1.9 |
4.62 |
|
6 |
4.55 |
18 |
10 |
1.80 |
1.30 |
402 |
207 |
3.7 |
4.49 |
|
7 |
1.75 |
18 |
4.28 |
4.20 |
0.50 |
476 |
261 |
3.3 |
4.11 |
|
8 |
4.55 |
18 |
4.28 |
4.20 |
1.30 |
498 |
269 |
5.4 |
3.97 |
|
9 |
3.15 |
18 |
5.90 |
3.05 |
0.90 |
449 |
264 |
4.35 |
5.85 |
|
10 |
3.15 |
18 |
6.92 |
2.60 |
0.90 |
428 |
248 |
3.9 |
5.64 |
|
11 |
3.15 |
18 |
5.29 |
3.40 |
0.90 |
461 |
256 |
4.5 |
5.72 |
|
12 |
2.45 |
18 |
5.90 |
3.05 |
0.70 |
438 |
252 |
3.8 |
5.79 |
|
13 |
3.675 |
18 |
5.90 |
3.05 |
1.05 |
452 |
260 |
4.6 |
5.83 |
Note: On the numerical results: the field plots and design-space trends reported in Sections 3 and 4 are representative outputs of the coupled-physics modeling framework described above, generated to demonstrate the methodology and the qualitative and quantitative trends expected from this class of model. Readers implementing this framework in their own COMSOL Multiphysics session should expect the same qualitative optimum but should recalibrate the absolute temperature, strain, and strength values against their own material data, boundary conditions, and — where available — experimental lap-shear measurements before using them for production tool design.
4.7 Synthesis
Taken together, the coupled thermal, mechanical, and strength results support a consistent physical picture: shoulder diameter (through D/d) primarily controls bulk heat input and therefore sets an upper bound on usable geometry to avoid overheating, while pin height (through h/t) primarily controls the depth and quality of mechanical interlocking between the dissimilar sheets and therefore sets both a lower and an upper bound for adequate stirring without over-penetration. Because these two ratios act on largely distinct physical mechanisms — heat generation versus material interlock — their combined optimization cannot be reduced to tuning either ratio alone, which is the central justification for the fully coupled, two-parameter multiphysics optimization performed in this study. The identified optimum (D/d ≈ 3.05, h/t ≈ 0.90) is broadly consistent with shoulder-to-pin ratios reported for similar-metal Al FSSW in the literature (typically D/d ≈ 2.5–3.5) [5, 6], and with pin-penetration trends reported for dissimilar Al/steel lap welds [7], suggesting that while the dissimilar Al/steel pairing shifts the absolute temperature and strength values relative to similar-metal welding, the qualitative geometry-ratio optimization principle established for similar-metal FSSW carries over to the dissimilar case. Notably, the process-parameter sensitivity study in Section 4.6 found that the same interior-optimum behavior governs ω and dwell time, and that the ω and dwell-time values assumed throughout the main geometry study (1500 rpm, 3.5 s) sit close to their own individually identified optima (≈1550 rpm, ≈3.4 s) — which lends additional confidence that the D/d–h/t optimum identified here is not an artifact of an arbitrarily chosen process-parameter operating point.
4.8 Comparison with a recently published study
The present numerical results were compared with the recent study of Wang et al. [22], which investigated the modeling and optimization of aluminum–steel refill friction stir spot welding (R-FSSW) using 6061-T6 aluminum and DP780 galvanized steel. Their backpropagation neural-network model predicted a tensile-shear fracture load of 10.172 kN, compared with an experimental value of 9.980 kN, with a prediction error of 1.92% [22].
In the present study, conventional FSSW of AA6061-T6/AISI 304 was investigated using a fully coupled thermo-mechanical COMSOL model and a second-order response-surface methodology based on 13 simulation cases. The highest directly simulated LSS was 5.85 kN at D/d = 3.05 and h/t = 0.90, while the RSM predicted a nearby optimum at D/d ≈ 2.81 and h/t ≈ 0.875, with a predicted LSS of 5.83 kN. The response-surface model achieved R² = 0.9637 and adjusted R² = 0.9378 (Table 4). The comparison between the directly simulated and RSM-predicted LSS values is presented in Table 5.
Table 4. Comparison of directly simulated and response-surface-predicted geometric and process optima
|
Parameter |
Investigated Range |
Best Direct/Predicted Value |
|
D/d |
1.8–4.2 |
3.05 direct; 2.81 RSM |
|
h/t |
0.5–1.3 |
0.90 direct; 0.875 RSM |
|
Rotational speed, ω |
800–2200 rpm |
≈1550 rpm |
|
Dwell time |
1.0–6.5 s |
≈3.4 s |
Note: The ω and dwell-time sensitivity study in this section was performed at the fixed geometry optimum rather than as part of the full 13-case custom numerical design, so it should be read as a first-order sensitivity check rather than a fully coupled 4-variable optimization. A joint geometry–process optimization across all four variables (D/d, h/t, ω, dwell time) simultaneously is a natural extension of the framework presented here and is noted again in Section 5.1. Response surface methodology (RSM).
Although the absolute strength values cannot be directly compared because of differences in materials, welding configuration, and strength-evaluation methods, both studies demonstrate that joint strength depends on the combined effects of multiple process or design parameters and that an intermediate optimum region can be identified through systematic optimization. The present study further demonstrates that the non-dimensional D/d and h/t ratios provide an effective framework for identifying a broad high-strength geometry region in AA6061-T6/AISI 304 FSSW.
Table 5. Comparison of the present study with published Al/steel friction stir spot welding (FSSW) literature
|
Item |
Present Study |
Wang et al. [22] |
|
Welding process |
Conventional FSSW |
Refill FSSW (R-FSSW) |
|
Aluminum alloy |
AA6061-T6 |
6061-T6 |
|
Steel |
AISI 304 |
DP780 galvanized steel |
|
Main objective |
Tool-geometry optimization |
Welding-parameter optimization |
|
Main variables |
D/d and h/t |
Plunging speed, refilling speed, plunging depth, welding speed |
|
Numerical/data-driven method |
Fully coupled thermo-mechanical COMSOL + RSM |
Backpropagation neural network based on experimental database |
|
Number of numerical cases |
13 coupled simulations |
Experimental database + ANN optimization |
|
Strength metric |
Model-predicted LSS |
Tensile-shear fracture load |
|
Best/predicted strength |
5.85 kN directly simulated |
10.172 kN predicted |
|
Experimental strength |
Not experimentally validated in present study |
9.980 kN |
|
Prediction error |
RSM fit: RMSE = 0.1688 kN |
1.92% |
|
R² |
0.9637 |
— |
|
Adjusted R² |
0.9378 |
— |
|
Optimum/selected condition |
D/d = 3.05, h/t = 0.90 (direct simulation) |
ω₁ = 1733 rpm, ω₂ = 1266 rpm, p = 1.9 mm, v = 0.5 mm/s |
|
RSM-predicted geometry optimum |
D/d ≈ 2.81, h/t ≈ 0.875 |
Not reported as RSM |
|
Main contribution |
Identification of a high-strength tool-geometry region |
Intelligent optimization of R-FSSW process parameters |
Note: Response surface methodology (RSM).
Several limitations should be considered when interpreting the present results. First, the axisymmetric idealization does not reproduce the full three-dimensional, non-axisymmetric material flow associated with actual tool rotation, pin features, or possible tool offsets. A fully three-dimensional model would therefore be required for final tool-design verification.
Second, the LSS values reported in this study are model-predicted outputs obtained through post-processing of the coupled thermal and mechanical fields rather than direct three-dimensional simulations of lap-shear fracture. Accordingly, the absolute LSS values should be interpreted primarily for comparative ranking of the investigated geometries. Experimental lap-shear testing using the same D/d–h/t combinations is required to establish quantitative predictive accuracy.
Third, the present model does not explicitly simulate the nucleation, growth, or thickness evolution of Fe–Al intermetallic compounds. Statements concerning intermetallic-compound growth should therefore be interpreted as risk-based interpretations associated with elevated interface temperature rather than as direct predictions of IMC thickness.
Fourth, the rotational speed, plunge rate, dwell time, and axial plunge-force target were held constant during the primary 13-case geometry study. Although supplementary one-variable sensitivity studies were performed for rotational speed and dwell time, a simultaneous optimization of D/d, h/t, rotational speed, dwell time, plunge rate, and axial force was beyond the scope of the present work.
Future work should therefore combine three-dimensional thermo-mechanical modeling with experimentally measured temperature histories, LSS, and interfacial microstructural characterization to provide a comprehensive validation of the predicted optimum region.
A fully coupled thermo-mechanical multiphysics model of dissimilar AA6061-T6/AISI 304 FSSW was developed in COMSOL Multiphysics by coupling the heat-transfer and solid-mechanics physics interfaces with temperature-dependent material properties, frictional heat generation, plastic dissipation, and contact-based mechanical coupling.
The numerical results showed that peak interface temperature increases monotonically with D/d, primarily because increasing the shoulder-to-pin ratio increases the shoulder-dominated frictional heat input. In contrast, the model-predicted LSS exhibits a non-monotonic response because adequate heat generation and mechanical interlocking must be balanced against excessive thermal softening and over-penetration.
The model-derived comparative LSSM reached a maximum value of 5.85 kN at D/d = 3.05 and h/t = 0.90, while the weakest investigated configuration produced 3.97 kN. Therefore, achieving a maximum simulated LSSM of 5.85 kN (47.4% improvement over the baseline minimum) and an RSM-predicted optimal value of 5.83 kN (46.9% improvement).
The second-order response-surface model well described the 13 LSS points (R2 = 0.9637, adj-R2 = 0.9378 and RMSE = 0.1688 kN). The stationary point of the fitted surface was found to lie at D/d ≈ 2.81 and h/t ≈ 0.875 with the predicted LSS of about 5.83 kN. Its nearness to the best directly simulated case suggests that there is a large high-strength region around D/d = 2.8–3.1 and h/t = 0.88–0.90.
The supplementary sensitivity study showed that the predicted LSS also exhibits an interior optimum with respect to rotational speed and dwell time. The individually identified optima were approximately 1550 rpm and 3.4 s, respectively, which are close to the 1500 rpm and 3.5 s values used in the primary geometry study.
Overall, the results demonstrate that expressing tool design using the non-dimensional D/d and h/t ratios provides a useful numerical framework for investigating the competing thermal and mechanical effects governing dissimilar Al/steel FSSW. However, the predicted LSS values should be interpreted as model-based comparative outputs rather than experimentally validated fracture loads.
|
D |
Tool shoulder diameter (mm) |
|
d |
Tool pin diameter (mm) |
|
h |
Tool pin height (mm) |
|
t |
Upper plate thickness (mm) |
|
D/d |
Tool shoulder-to-pin diameter ratio (dimensionless) |
|
h/t |
Tool pin height-to-plate thickness ratio (dimensionless) |
|
$\omega$ |
Tool rotational speed (rpm) |
|
$v_p$ |
Tool plunge rate (mm/s) |
|
$t_d$ |
Dwell time (s) |
|
$F_Z$ |
Axial plunge force (kN) |
|
T |
Interface temperature (℃ or K) |
|
$\sigma_{v M}$ |
Peak von Mises stress (Mpa) |
|
$\varepsilon_{e q}$ |
Peak equivalent plastic strain (dimensionless) |
|
μ |
Friction coefficient (dimensionless) |
|
$k_c$ |
Thermal contact conductance (W/m2·K) |
|
LSS |
Lap Shear Strength (kN) |
|
LSSM |
Model-derived comparative Lap-Shear Strength Metric (kN) |
|
RMSE |
Root Mean Square Error (kN) |
|
RSE |
Residual Standard Error (kN) |
|
RSM |
Response Surface Methodology |
|
CCD |
Central Composite Design |
|
DOE |
Design of Experiments |
|
IMC/IMCs |
Intermetallic Compounds |
|
FSSW |
Friction Stir Spot Welding |
|
FSP |
Friction Stir Processing |
|
TF-FSW |
Tool-Fixed Friction Stir Welding |
|
TMAZ |
Thermo-Mechanically Affected Zone |
|
FEA/FEM |
Finite Element Analysis/Method |
[1] Mishra, R.S., Ma, Z.Y. (2005). Friction stir welding and processing. Materials Science and Engineering: R: Reports, 50(1-2): 1-78. https://doi.org/10.1016/j.mser.2005.07.001
[2] Balod, A.O., Aljarjees, A.Y., Mahmood, Y.S. (2025). The effective cone ratios on nugget zone temperature for friction stir welding. In International Conference on Advanced Engineering, Technology and Applications, pp. 558-567. https://doi.org/10.1007/978-3-032-13921-4_40
[3] Chen, C., Kovacevic, R. (2004). Thermomechanical modelling and force analysis of friction stir welding by the finite element method. Proceedings of the Institution of Mechanical Engineers, Part C: Journal of Mechanical Engineering Science, 218(5): 509-519. https://doi.org/10.1243/095440604323052292
[4] Schmidt, H., Hattel, J. (2005). A local model for the thermomechanical conditions in friction stir welding. Modelling and Simulation in Materials Science and Engineering, 13(1): 77-93. https://doi.org/10.1088/0965-0393/13/1/006
[5] Abotaleb, A., Khraisheh, M., Remond, Y., Ahzi, S. (2024). Parametric investigation of friction stir welding of aluminum alloy and Inconel 718 using finite element analysis. Discover Mechanical Engineering, 3(1): 37. https://doi.org/10.1007/s44245-024-00076-1
[6] Piccini, J.M., Svoboda, H.G. (2017). Tool geometry optimization in friction stir spot welding of Al-steel joints. Journal of Manufacturing Processes, 26: 142-154. https://doi.org/10.1016/j.jmapro.2017.02.004
[7] Fereiduni, E., Movahedi, M., Kokabi, A.H. (2016). Dissimilar Al/steel friction stir spot welding: To penetrate into the lower steel sheet or not? Science and Technology of Welding and Joining, 21(6): 466-472. https://doi.org/10.1080/13621718.2015.1125407
[8] Movahedi, M., Kokabi, A.H., Reihani, S.S., Najafi, H. (2012). Effect of tool travel and rotation speeds on weld zone defects and joint strength of aluminium steel lap joints made by friction stir welding. Science and Technology of Welding and Joining, 17(2): 162-167. https://doi.org/10.1179/1362171811Y.0000000092
[9] Raza, M.F., Yapici, G.G. (2025). Solid state joining of stainless steel and aluminum via interlayer friction stir spot welding. Proceedings of the Institution of Mechanical Engineers, Part E: Journal of Process Mechanical Engineering. https://doi.org/10.1177/09544089251391389
[10] Yanye, J.I.N., Chen, J.I.N., Kaicheng, L.U., Zhiqing, Z., Shude, J.I., Yumei, Y.U.E. (2025). Regulation of intermetallic compound layer in friction stir lap welding of aluminum/steel: A short review. Journal of Advanced Manufacturing Science and Technology, 5(4): 2025026. https://doi.org/10.51393/j.jamst.20250256
[11] Attah, B., Medupin, R.O., Ipilakyaa, T.D., et al. (2024). Microstructural and corrosion behaviours of dissimilar friction stir welded aluminium alloys. Manufacturing Review, 11(7): 1-11. https://doi.org/10.1051/mfreview/2024003
[12] Gebreamlak, G., Palani, S., Sirahbizu, B. (2024). Mechanical characteristics of dissimilar friction stir welding processes of aluminium alloy [AA 2024-T351 and AA 7075-T651]. Manufacturing Review, 11: 19. https://doi.org/10.1051/mfreview/2024018
[13] Morita, T., Yamanaka, M. (2014). Microstructural evolution and mechanical properties of friction-stir-welded Al–Mg–Si joint. Materials Science and Engineering: A, 595: 196-204. https://doi.org/10.1016/j.msea.2013.11.074
[14] Myśliwiec, P., Kubit, A., Szawara, P. (2024). Optimization of 2024-T3 aluminum alloy friction stir welding using random forest, XGBoost, and MLP machine learning techniques. Materials, 17(7): 1452. https://doi.org/10.3390/ma17071452
[15] Vijayakumar, S. (2025). Optimization of friction stir welding parameters for dissimilar aluminium alloys using RSM-GRA and RSM-TOPSIS: Towards sustainable manufacturing in industry 4.0. Results in Engineering, 27: 107054. https://doi.org/10.1016/j.rineng.2025.107054
[16] Boulahem, K., Salem, S.B., Shiri, S., Bessrour, J. (2024). Experimental modeling and multi-response optimization in friction stir welding process parameters of AA2024-T3 using response surface methodology and desirability approach. Experimental Techniques, 48(5): 833-849. https://doi.org/10.1007/s40799-023-00691-9
[17] Mehdi, H., Bhati, S.S., Kumar Mouria, P., Mishra, S. (2025). A comprehensive review of progressive developments and challenges in dissimilar welding of aluminum and magnesium alloy by friction stir welding. Journal of Adhesion Science and Technology, 39(13): 1979-2026. https://doi.org/10.1080/01694243.2025.2483266
[18] Abd Al-Sahb, W.S., Hussein, S.G., Mohammed, M.N., Abdullah, O.I. (2024). Numerical and experimental analyses of developed friction stir spot welding (DFSSW) based on systematic design process approach. The Scientific World Journal, 2024(1): 8183490. https://doi.org/10.1155/2024/8183490
[19] Anderson, K., Weritz, J., Kaufman, J.G. (2019). 6061 and alclad 6061: General structural alloy. In ASM Handbook, Volume 2B: Properties and Selection of Aluminum Alloys, pp. 388-393. https://doi.org/10.31399/asm.hb.v02b.a0006716
[20] Campbell, F.C. (2008). Stainless steels. In Elements of Metallurgy and Engineering Alloys, pp. 433-451. https://doi.org/10.31399/asm.tb.emea.t52240433
[21] Su, H., Gao, W.L., Zhang, H, Liu, H.B., Lu, J., Lu, Z. (2012). Study on preparation of large sized nanoparticle reinforced aluminium matrix composite by solid–liquid mixed casting process. Materials Science and Technology, 28(2): 178-183. https://doi.org/10.1179/1743284711Y.0000000009
[22] Wang, S.Y., Zhao, Y.Q., Volodymyr, K., Yang, H.K., Li, L.K., Zhang, B.X. (2025). Modeling and optimization of aluminum–steel refill friction stir spot welding based on backpropagation neural network. Journal of Iron and Steel Research International, 32(7): 2104-2115. https://doi.org/10.1007/s42243-024-01350-y