M. A. Mohammed*![]() | Noor Hatem
| Noor Hatem![]() | Azzam D. Hassan
| Azzam D. Hassan![]() | Nuha Hadi Jasim Al Hassan
| Nuha Hadi Jasim Al Hassan![]() | Safaa A.S. Almtori
| Safaa A.S. Almtori![]() | Zaid H. Obayes
| Zaid H. Obayes![]()
© 2025 The authors. This article is published by IIETA and is licensed under the CC BY 4.0 license (http://creativecommons.org/licenses/by/4.0/).
OPEN ACCESS
The thermoelectric properties of doped BiCuSeO are influenced by doping on both the Bi2O2 and Cu2Se2 layers. Density functional theory (DFT) simulations were used in this work to predict thermoelectric performance after doping to both layers of BiCuSeO in order to reduce the monetary and time costs of experimental testing, allowing for more rigorous review of the resulting changes in electrical and thermal conductivity and evaluation of how these modifications can be used to optimize the material's thermoelectric efficiency. Testing whether the various changes to temperature and doping had any substantial impact on the material’s thermoelectric properties was done using statistical methodologies. The best results were thus obtained for Bi0.9Ca0.1CuSeO at 950℃, at a value of 2 E+12. The doped layer of Cu2Se2 had lower ZTe values than pure BiCuSeO, however, indicating that these efforts to improve thermoelectric capabilities were ineffective.
thermoelectric, density functional theory, first-principles calculation, ceramics oxide materials, BiCuSeO, doping
Waste heat could be a significant source of energy if handled correctly. By adopting carrier and phonon transport, thermoelectric technology that can directly change heat into electricity may offer a potential means of recovering such heat from waste, and this topic has been studied frequently in recent decades [1]. In order to advance the application of such methods, however, it is essential to have develop improved thermoelectric performance, typically evaluated using the dimensionless figure of merit, ZT = T(S2σ/κ). The symbols S, σ, κ, and T used in this calculation represent the Seebeck coefficient, electrical conductivity, thermal conductivity, and absolute temperature, respectively. High-quality thermoelectric (TE) materials offer high ZT values, which are dependent on the presence of a large power factor (PF = S2σ) and low thermal conductivity (κ). The lattice thermal conductivity, κlat, and electronic thermal conductivity, κele, are the primary components of the total thermal conductivity, κ [2, 3]; this means that the intricate interconnection between these parameters can create difficulty in terms of enhancing the capacity of thermoelectric (TE) materials [4].
The thermoelectric material oxychalcogenide (LnCuChO) has been extensively researched in recent years. It has a ZrCuSiAs type structure with a P4/nmm space group. The Ln3+ ions used in the material are La3+, Bi3+, and Nd3+, while the Ch2− ions are S2−, Se2−, and Te2− [5]. Oxychalcogenide thus consists of two types of layers: insulating (Ln2O2)2+ layers and conducting (Cu2Ch2)2− layers, which combine to create a natural superlattice structure [6].
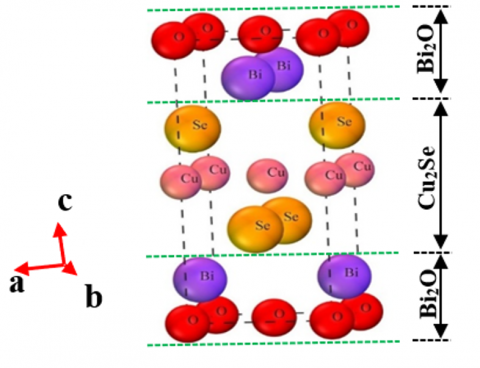
Since Li's initial report on this material [5], BiCuSeO has come to be viewed as the most promising oxide in this capacity due to its naturally low thermal conductivity. BiCuSeO, an oxyselenide belonging to the wider group of oxychalcogenides, has thus attracted significant attention as a thermoelectric material [7]. The crystal structure of BiCuSeO belongs to the tetragonal P4/mm space group, with its composite crystal structure, shown in Figure 1, consisting of alternating layers of (Cu2Se2)2- and (Bi2O2)2+ stacked along the c axis of the tetragonal cell [8]. The insulating layers of (Bi2O2)2+ serve as a reservoir for carriers and as a phonon scattering region, while the conductive layers of (Cu2O2)2− are responsible for the transportation of carriers.
Figure 1. Unit cell structure of BiCuSeO
BiCuSeO is a semiconductor with a large energy gap of approximately 0.82 electron volts (eV). The layered structure also yields a high Seebeck coefficient (>300 mVK-1 at 25-500 ℃) and low thermal conductivity (0.4 Wm-1K-1 at 600℃). The low intrinsic thermal conductivity of the material is a result of the anharmonicity of its lattice vibrations, while its low thermal conductivity may be attributed to the weak bonding between the two layers and a low Young's modulus of -76.5 GPa [9]. According to some researchers, the best way to improve the thermoelectric performance of BiCuSeO is thus by enhancing its electrical transport performance, as while BiCuSeO has intrinsically low carrier mobility (20 cm−2 V−1 s−1) and carrier concentration (1018 cm−3) [10], its thermoelectric application remains inhibited due to its low electrical conductivity [11].
Several researchers have discussed the effects of doping the Bi2O2 and Cu2Se2 in BiCuSeO, leading to several recent findings and research trends. A study by Kang et al. [12] on doping BiCuSeO with rare-earth elements such as Yb in the Bi site suggested that this significantly alters both electrical conductivity and the Seebeck coefficient. The addition of Ca doping then increases the number of carriers and their ability to move, resulting in significant improvement in both electrical conductivity and power factor. Ca2+ ions can also be used to enhance the electrical transport properties, as these act as hole dopants at Bi3+ sites. They also contribute to reducing the lattice thermal conductivity by introducing nanoprecipitates, causing large mass fluctuation, and creating point-defects [13].
Another study explored the effects of dual-doping with elements such as In and Pb at the Bi site, which tended to improve the material's thermoelectric performance, particularly in terms of enhancing its power factor and reducing thermal conductivity [14]. Improved thermoelectric performance of BiCuSeO by adding Ag at the Cu site can also enhance S and reduce the resulting total thermal conductivity (k) by supporting phonon scattering [15]. Utilizing a method of generating Cu vacancies is an additional approach that may enhance the thermoelectric power factor and reduce the thermal conductivity of the lattice [9, 11]. Most previous research has, however, studied doped elements in the Bi site (Bi2O2), married with Cu vacancies; fewer articles about doping in the Cu2Se2 layer have emerged.
Doping with sodium (Na) substantially increases the electrical conductivity and power factor of BiCuSeO. Researchers have also investigated the effects of adding sodium and fluorine (NaF) with regard to the microstructure and thermoelectric properties of BiCuSeO, determining adding NaF improves electrical conductivity while decreasing thermal conductivity [16]. Researchers have also explored the potential of magnesium doping to improve the thermoelectric performance of BiCuSeO [17], while one study looked at how adding aluminum might change the tiny structures and thermoelectric features of BiCuSeO, determining that this material becomes stable even at high temperatures [RSC Publishing]. Scientists have also examined how adding gallium (Ga) changes the band structure and thermoelectric properties of BiCuSeO, as well as evaluating the potential impact of thorium (Tl) doping on the thermoelectric performance of the compound [14]. Lead (Pb) doping has also been shown to offer significant improvements in both the electrical conductivity and power factor of BiCuSeO [18]. Finally, some scientists have found that adding cadmium is a beneficial way to improve BiCuSeO’s electrical conductivity and Seebeck coefficient [19]. Adding different elements to the various sites creates various different effects on thermoelectric properties, however.
The investigation of Ca-doped BiCuSeO is important as Ca substitution at the Bi site not only generates extra holes but also enables advantageous alterations in the band structure. These adjustments can result in an improved Seebeck coefficient and optimal carrier concentration, which are essential for enhancing overall thermoelectric performance. Moreover, the layered structure of BiCuSeO inherently restricts thermal conductivity, and and Ca doping may further enhance phonon scattering mechanisms. Density functional theory (DFT) has the benefit of investigating atomistic effects with great accuracy, therefore minimizing experimental trial-and-error and expediting the discovery of interesting compositions. Recent studies have shown that DFT can accurately forecast changes in electronic structure and transport characteristics, hence validating its use as a supplementary tool to experimental investigations [7, 17].
Unfortunately, the experimental techniques required to test such doping are expensive and require a significant amount of time [20]. Computer simulation has thus emerged as a potent tool for studying changes in intricate systems, such as the thermoelectric properties of materials, as advancements in hardware and software have continued apace. Density functional theory (DFT) is a widely used computational method in materials science, particularly with regard to first-principles calculations such as those for predictive capability, versatility, efficiency, insights into fundamental properties, and complementing experimental data [20-23]. Researchers also use DFT to evaluate the stability and properties of new 2D monolayer materials prior to beginning more targeted experimental synthesis, as this method helps identify stable materials and supports predictive design. Enhanced DFT methods can also improve the accuracy of thermoelectric property calculations, overcoming the various limitations of earlier approximations [24, 25].
In thermoelectric applications, DFT studies can predict the effects of different dopants and allow the exploration of new doping elements to enhance performance. Research by Toriyama et al. [17] offered insights into defect chemistry and doping strategies for the improvement of thermoelectric properties. The purpose of this paper is, similarly, to investigate the impact of doping Ca into both layers within BiCuSeO to help determine the reasons behind the limited amount of research conducted on doping the Cu2Se2 layer. To reduce the amount of time and money spent in investigation, DFT was thus utilized to make predictions regarding the resulting effects on the material’s thermoelectric properties.
Density functional theory framework was utilized to calculate the bulk properties of doped BiCuSeO compounds with an orthorhombic structural phase. This calculation was performed using the Quantum ESPRESSO (PWSCF) computational code [26], which serves as a pseudo-potential method for characterizing the interactions between electrons and ions. The code utilizes plane waves to construct the wave function and charge density. Each unit cell of the BiCuSeO compound contains a total of eight atoms, with two atoms each of bismuth (Bi), copper (Cu), selenium (Se), and oxygen (O). The compound itself is thus composed of various elements, each of which is associated with a specific type of pseudo-potential. All such pseudo-potentials are norm conserving, and they include Bi.pbe-d-mt.UPF, Cu.pbe-n-van_ak.UPF, Se.pbe-n-rrkjus_psl.1.0.0.UPF, O.pbe-rrkjus.UPF, and doped Ca.pbe-nsp-van.UPF. The calculations for this work were performed in a supercell with dimensions 5×2×1, and the plane-wave energy cutoff was set to 80 Ry, with the electronic energy convergence set to 1 e-5 eV. The exchange-correlation energy was estimated using the Perdew–Burke–Ernzerhof (PBE) functional and the generalized gradient approximation (GGA) within the projector augmented wave (PAW) method. The Monkhorst–Pack (MP) special k-point scheme (Γ-centered) was used to sample the Brillouin zone, with a 4×4×3 k-point mesh [27]. The electronic configurations used for our BiCuSeO compounds are [Xe] 4f14 5d10 6s2 6p3 for Bi, [Ar] 3d10 4s1 for Cu, [He] 2s2 2p4 for O, and [Ar] 3d10 4s2 4p4 for Se. The muffin tin radii (RMT) are taken as 2.30 a.u., 2.00 a.u., 1.55 a.u., and 1.93 a.u. for Bi, Cu, O, and Se atoms respectively.
Thermoelectric properties, including the Seebeck coefficient (S), electrical conductivity (σ), and thermal conductivity (κ), were computed using Boltzmann transport theory, with application of the BoltzTraP code [8]. The study demonstrated convergence of the self-consistent calculations in the orthorhombic phase of the compounds based on 26 cycles and 2x10⁻⁶ Ry accuracy. The transport properties were calculated using a semi-classical Boltzmann approach by applying the BoltzTraP code and using the Fourier energy bands expansion. Table 1 provides an illustration of the samples' names as well as the doping into the Bi or Cu site.
Table 1. List of samples with their corresponding doping Ca value ant site
|
No. |
Sample |
Ca doped Bi (x) |
Ca doped Cu (y) |
Symbol |
|
1 |
BiCuSeO |
0 |
0 |
XY=0.0 |
|
2 |
Bi0.95Ca0.05CuSeO |
0.05 |
0 |
X=0.05 |
|
3 |
Bi0.9Ca0.1CuSeO |
0.1 |
0 |
X=0.1 |
|
4 |
Bi0.85Ca0.15CuSeO |
0.15 |
0 |
X=0.15 |
|
5 |
BiCu0.95Ca0.05SeO |
0 |
0.05 |
Y=0.05 |
|
6 |
BiCu0.9Ca0.1SeO |
0 |
0.1 |
Y=0.1 |
|
7 |
BiCu0.85Ca0.15SeO |
0 |
0.15 |
Y=0.15 |
By utilizing a known electronic structure, it is possible to compute the ratio of σ/τ as a function of n and T. However, the calculation of σ is not feasible without the addition of information on the inverse scattering rate, τ-1. The thermoelectric properties of Bi1-xCaxCu1-yCaySeO were thus calculated for various compositions. Specifically, the values were determined for samples with XY=0, X=0.05, X=0.1, and X=0.15, as well as for samples with Y=0.05, Y=0.1, and Y=0.15. Electrical conductivity, Seebeck coefficient, thermal conductivity, and figure of merit were selected as the relevant thermoelectric properties, and all such properties were examined under the assumption that they are temperature dependent.
Figure 2 shows that the electrical conductivity per-relaxation time s/g of the three studied properties increases as the temperature increases except where y = 0.1 and y=0.15. The electrical conductivity of the materials with (XY=0), (X=0.05), (X=0.1), and (X=0.15) showed less temperature dependence, however, increasing as the temperature rises in a manner refined for semiconductors, where thermal activation enhances the number of free charge carriers. These materials remain relatively stable across a wide temperature range, however, with minimal increases at higher temperatures. Ideally, a singular substitution of the Bi3+ site by divalent ions in BiCuSeO can be used to introduce one free hole, increasing the hole concentration and electrical conductivity [28].
Figure 2. The effect of Ca doping on electrical conductivity of Bi1-xCaxCu1-yCaySeO
The material with (Y=0.05) showed a significant increase in conductivity with temperature increases, which is more characteristic of a highly doped semiconductor that is suitable for high-temperature applications. On the other hand, the material with (Y=0.1) maintained a high level of conductivity, yet this decreased slightly with temperature increases, indicating a complex interplay between charge carrier density and mobility. Similarly, the (Y=0.15) version exhibited initially high conductivity that then decreased with temperature increases. The (Cu2Se2)2− and (Bi2O2)2+ layers are stacked alternately along the c axis, so that the conductive layer is (Bi2O2)2+, and the carrier storage layer is (Cu2Se2)2−. Electronegativity refers to the degree of attraction that carriers possess., and considering the electronegativity effects on electrical conductivity [29], the electronegativity of Ca is 1, while that of Cu is 1.9 [30]. Following the addition of Ca doping, the (Cu2Se2)2− layer experiences a decrease in its capacity to attract carriers. This change is beneficial for the (Bi2O2)2+ conducting layer, which becomes more capable of obtaining carriers, leading to an increase in the concentration of carriers in that region [31].
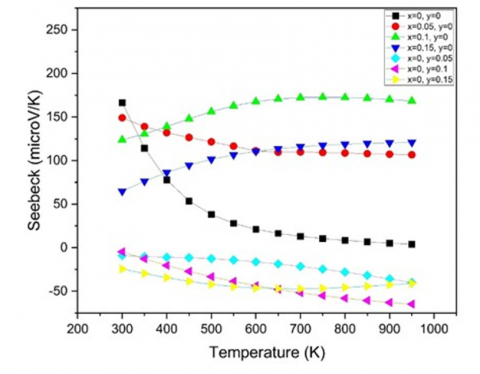
Figure 3 depicts the relationship between the Seebeck coefficient and temperature for various compositions. Positive Seebeck coefficients across the whole temperature range occurred, indicative of p−type conduction in all Ca doped Bi samples (y=0). The black squares (XY=0) demonstrated an initial value of 166 μV/K, though this value sharply decreased to 21 μV/K when the temperature reached 600 K. After that, a gradual decrease in value occurred, to approximately 3 μV/K at 900 K. The red circles at Ca=0.05 represent the material with the high Seebeck coefficient, which began at approximately 150 μV/K at 300 K, gradually decreasing to around 105 μV/K at 950 K. The green triangles, indicating where x=0.1, illustrate an initial thermoelectric voltage of approximately 124 μV/K at a temperature of 300 K. This voltage gradually decreased to around 168 μV/K as the temperature rose to 950 K. The blue downward triangles at x=0.15, show an initial value of 65 μV/K, which increased significantly to 121 μV/K as the temperature reached 950 K. These results indicate that the Seebeck coefficient exhibits an inverse relationship with electrical conductivity as the temperature changes [7]. The undoped BiCuSeO also exhibited a low Seebeck coefficient due to the two−dimensional confinement of its holes.
Figure 3. The effect of Ca doping on Seebeck of Bi1-xCaxCu1-yCaySeO
All samples of Ca-doped Cu (X=0) demonstrated negative Seebeck coefficients across the entire temperature range, indicating n-type conduction. Cyan diamonds at Y=0.05 show the material as having an initial value of -9 μV/K, which remained relatively stable, with a slight decrease to approximately -40 μV/K as the temperature increased to 950 K. The magenta leftward triangles (Y=0.1) show a trend beginning at approximately -4 μV/K, with the material demonstrating a constant but slightly decreasing value until -65 μV/K at a temperature of 950 K. Finally, the yellow rightward triangles (Y=0.15) indicate a Seebeck coefficient that begins at -24 μV/K, remains constant, and eventually reaches approximately -41 μV/K at a temperature of 950 K.
Comparing the lines, it is clear that the material represented by the red circles possesses the highest Seebeck coefficient, followed by those represented by the green triangles and blue downward triangles. On the other hand, the compositions with Y=0.05, Y=0.1, and Y=0.15 display comparatively lower, potentially negative Seebeck coefficients. This emphasizes the substantial influence of changes in composition on thermoelectric properties. The augmentation of the Seebeck coefficient in Ca-doped BiCuSeO is intricately linked to alterations in the electronic band structure. The presence of Ca generates localized states along the valence band edge, potentially augmenting the effective mass of charge carriers, a crucial element in enhancing the Seebeck coefficient as per the Mott relation. The subsequent change in the Fermi level enhances the energy-dependent transport coefficients, resulting in a better equilibrium between electrical conductivity and thermoelectric voltage production. The band convergence effect, substantiated by our density of states research, underscores the essential interaction between carrier concentration and band structure in attaining enhanced thermoelectric performance [7, 17].
Figure 4 presents the variation in electronic thermal conductivity with temperature for the different compositions, all marked with specific symbols and colors. Starting with the x=0 set, the yellow rightward triangles (Y=0.15) show the highest thermal conductivity, starting at around 1.2 × 10¹⁴ W/mKs at 300 K and rising steadily to about 5 × 10¹⁴ W/mKs at 950 K. The magenta leftward triangles and cyan diamonds for Y=0.1 and Y=0.05, respectively, also illustrate high thermal conductivities, however, with the former starting at 1.5 × 10¹⁴ W/mKs at 300 K and reaching approximately 4.4 × 10¹⁴ W/mKs at 950 K, while the latter follows a similar trend slightly lower. The black squares (XY=0) illustrate lower thermal conductivity, however, starting from around 1.5 × 10¹⁴ W/mKs and increasing to about 2.1 × 10¹⁴ W/mKs at 950 K.
Figure 4. The effect of Ca doping on electronic thermal conductivity of Bi1-xCaxCu1-yCaySeO
Electronic thermal conductivity for Ca doped Bi where (Y=0) can be seen to be limited: the red circles (X=0.05) illustrate the material with the lowest values, starting at zero and rising gradually to around 7 × 10¹³ W/mKs at 950 K. The materials represented by green triangles (X=0.1) and blue downward triangles (X=0.15) display similar trends, with their thermal conductivities remaining relatively low and consistent across the temperature range, not exceeding 5 × 10¹³ W/mKs. Comparing the lines, it is evident that the compositions with Y=0.15, Y=0.1, and Y=0.05 (yellow, magenta, and cyan) have significantly higher thermal conductivities as compared to other compositions, indicating a strong influence from the y-component with respect to enhancing thermal transport properties. The black squares (XY=0) show a moderate increase in thermal conductivity with temperature, while the red circles (X=0.05), green triangles (XY=0), and blue downward triangles (X=0.15) illustrate the maintenance of relatively low thermal conductivity across the temperature range, suggesting that these compositions are less effective at thermal conduction as compared to those with higher y-values.
The graph in Figure 5 illustrates the relationship between the electronic figure of merit (ZTe) and temperature for various compositions. The red circles (X=0.05) display the highest initial ZTe values, starting at approximately 1.6 × 10¹² at 300 K and gradually decreasing to around 5 × 10¹¹ at 950 K. This suggests that these additions perform well at lower temperatures, but that their performance diminishes as the temperature increases. The green triangles, (X=0.1) initially illustrate a value of approximately 8 × 10¹¹ at a temperature of 300 K before exhibiting a rising pattern, reaching a maximum value of around 2 × 10¹² at a temperature of 800 K prior to showing a slight decrease. The blue downward triangles, (X=0.15), start at lower values of approximately 1.7 × 10¹¹ and gradually rise to about 9.6 × 10¹¹ when the temperature reaches 950 K. The black squares, (XY=0), initially illustrate a low value of approximately 0.5 × 10¹²; however, as the temperature increases to 950 K, the value steadily declines to 2 × 10¹⁰, indicating a consistent detraction in the figure of merit with increasing temperature.
The Ca doped Cu site exhibits notably lower ZTe values, beginning close to 1.2 × 10⁹ and consistently remaining below 2.3 × 10¹¹ throughout the entire temperature range. This suggests that these variants offer minimal thermoelectric performance. Comparing the lines reveals that the version represented by red circles (X=0.05) exhibits the highest ZTe at lower temperatures, while those illustrated by green triangles (X=0.1) and blue downward triangles (X=0.15) display an increase in ZTe as the temperature rises, reaching peaks in the mid-to-high temperature range. The black squares (XY=0) also exhibit a rising pattern, albeit beginning from a lower initial value. The compositions with Y=0.05, Y=0.1, and Y=0.15 (cyan, magenta, and yellow) exhibit the lowest ZTe values, indicating subpar thermoelectric performance throughout the entire temperature range.
Figure 5. The effect of Ca doping on figure of merit of Bi1-xCaxCu1-yCaySeO
The performance measures, including electrical conductivity, Seebeck coefficient, and electronic figure of merit (ZTe), exhibit considerable variation with temperature. In Ca-doped BiCuSeO, particularly with doping at the Bi site, maximum performance is noted at elevated temperatures (exceeding 450℃), with the most advantageous balance of increased carrier concentration and beneficial band structure alterations happening about 950 K. The temperature-dependent study highlights the necessity of aligning the operating temperature range with the appropriate doping level to optimize thermoelectric efficiency. Comparable temperature-dependent behavior has been documented in recent thermoelectric research [10]. Any analysis focusing on the influence of changes in composition on the figure of merit must highlight those compositions that exhibit high performance within specific temperature ranges. The addition of calcium (Ca) to bismuth (Bi) is more effective than the act of doping copper (Cu) with calcium. The compound Bi0.95Ca0.05CuSeO can thus be utilized for medium temperature applications, ranging from 300 to 450℃, while Bi0.9Ca0.1CuSeO is more suitable for applications above 450℃.
Based on the close proximity of the thermoelectric properties observed in Figures 2-5, an ANOVA test was performed to assess the significance of any impact of BiCuSeO doping and/or temperature on electrical resistivity, Seebeck coefficient, and electronic thermal conductivity. Table 2 displays the ANOVA and Tukey test outcomes for the thermoelectric properties, showing that both the treatment conditions and temperature are significant factors affecting the thermoelectric properties. The ANOVA Table 2 shows a P-Value of 0.0, indicating significant differences caused by changes in the temperature and doping conditions. The Tukey test was used to assess the statistical significance of the differences between the means of temperature and doping, with results subsequently compared to the significance level α=0.05. This demonstrated substantial variations among all doping treatments, though no significant evidence of temperature changes emerged in this case.
Table 2 also presents the percentage contribution that temperature and treatment conditions have on each of the thermoelectric properties. This percentage is determined by utilizing the F-factors computed during the ANOVA test. Doping can thus be seen to have a predominant influence on the various changes, accounting for more than 99.5%, 99.94%, and 93.22% for the Seebeck coefficient, electrical resistivity, and electronic thermal conductivity, respectively.
Table 2. Contribution of temperature and percentage doping on thermoelectric properties of BiCuSeO based on F factor values
|
Thermoelectric Properties |
|||
|
|
Seebeck Coefficient |
Electrical Conductivity |
Electronic Thermal Conductivity |
|
Temperature |
1.28 (0.5%) |
0.59 (0.05%) |
9.59 (6.7%) |
|
Treatment |
250.60 (99.5%) |
1009.94 (99.94%) |
131.84 (93.22%) |
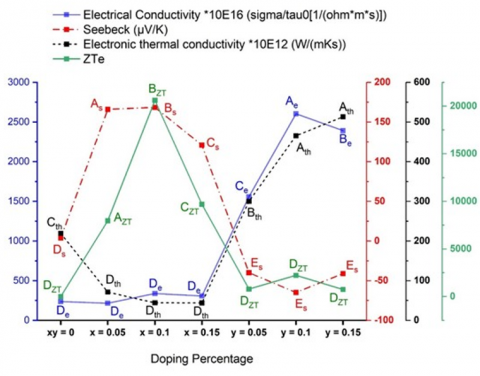
Figure 6 summarizes the electrical resistivity, Seebeck coefficient, electronic thermal conductivity, and ZTe of BiCuSeO at 950K after the doping treatment. Letters are used to refer to significant changes in thermoelectric properties. The graph thus provides a detailed analysis of the thermoelectric characteristics of each material at various levels of doping. It specifically examines four important properties: the Seebeck coefficient (shown in red), electrical conductivity (shown in blue), electronic thermal conductivity (shown in black), and the figure of merit (shown in green). Each property is labeled with capital letters and subscripts: a capital letter indicates a significant variation in values at various doping levels, while a subscript specifies the specific thermoelectric property. Repeated capital letters indicate no substantial disparity between doping percentages for a specific attribute, whereas distinct primary letters indicate noteworthy differences.
Figure 6. The statistical analysis of Ca doping effects on thermoelectric properties of Bi1-xCaxCu1-yCaySeO
The red dashed line represents the Seebeck coefficient, which measures the voltage generated by the material temperature difference. At 0% doping, the baseline Seebeck coefficient is Ds (XY=0). The Seebeck coefficient increases significantly as the doping percentage increases to 0.05 (X=0.05), indicating the material's improved ability to generate voltage from temperature differences. The Seebeck coefficient then increases a little (Bs) compared to that seen at X = 0.05 as the doping percentage increases to 0.1 (X=0.1) to reach its peak value (As). Increasing the percentage of doping to 0.15 (X=0.15) was found to lower the Seebeck coefficient (Cs), however, which suggests that heavy doping reduces the Seebeck effect. Es can be observed for y doping percentages ranging from 0.05 to 0.15, indicating no significant difference emerging in this property.
Electrical conductivity refers to the ability of a material to efficiently conduct electric current. The data points for electrical conductivity are depicted in a continuous light blue line. The repeated occurrence of the letter "De" within the range of XY=0 and x values from 0.05 to 0.15, however, indicates that there is no significant difference in electrical conductivity among these different levels of doping. The graph does illustrate a notable change in electrical conductivity as the doping percentage increases from Y=0.05 to Y=0.15, however, as indicated by the letters from Ce to Be, which signify a significant difference in values. These findings suggest that a doping percentage of Y=0.1 yields the optimal level of electrical conductivity.
Electronic thermal conductivity is shown with a dashed black line. The graph shows a peak at Ath, indicating that the highest electronic thermal conductivity occurs at a doping percentage of Y=0.15. Conversely, the emergence of the Dth marker at lower x doping percentages (0.05 to 0.15) suggests a decrease in electronic thermal conductivity with no significant difference in electronic thermal conductivity at these doping percentages, indicating stability in terms of this property.
The figure of merit, denoted as ZTe, is graphically represented by a solid green line, with changes indicated by primary letters with the subscript 'ZT'. The data reveals significant differences in materials, with an important point at BZT that aligns with a doping level of Y=0.10. The points AZT, BZT, CZT, and DZT then represent significant variations in the figure of merit at corresponding levels of x doping. BZT exhibits the highest figure of merit, indicating that the most favorable thermoelectric performance occurs at this specific level of doping. The recurrence of DZT, however, suggests that there is no significant difference between the respective levels of y doping.
DFT offers significant insights into electrical structure and possible thermoelectric properties, however it possesses intrinsic limits. The conventional DFT method does not explicitly include the relaxation period (τ), which is essential for precise estimation of electrical conductivity. Furthermore, the analysis of lattice dynamics is typically constrained, resulting in the omission of phonon thermal conductivity, a critical component of overall thermal performance. To mitigate these challenges, we have integrated DFT with Boltzmann transport theory; nevertheless, more enhancements (e.g., utilizing techniques such as ShengBTE for phonon transport or merging DFT with molecular dynamics) might result in greater accuracy. This discourse addresses the limitations and potential expansions, in light of recent advancements in computational thermoelectrics [32].
A model of doping in BiCuSeO layers was proposed and tested using DFT calculation to develop a detailed view of the resulting thermoelectric properties across different doping percentages. Within the model, Ca was thus introduced to Bi and Cu sites in the range of 300 to 950 K. The results indicated that the Ca doped Bi can effectively improve the Seebeck coefficient, while Ca doped Cu demonstrates an increase in electrical conductivity and electronic thermal conductivity. The maximum ZTe value of nearly 2E+12 at 950 K was observed for the sample Bi0.9Ca0.1CuSeO, with doping into the Bi2O2 layer. On the other hand, the highest value of ZTe for Ca doping with Cu was 2.2E+11 at the same temperature. Statistical testing found that a doping percentage of 0.10 offers the best results for the Seebeck coefficient, electrical conductivity, electronic thermal conductivity, and figure of merit, however. The lack of relaxation time and phonon thermal conductivity may make the DFT method less precise in terms of determining thermoelectric characteristics accurately. Nevertheless, this study offers an initial understanding of the appropriate element and site to use for doping in order to enhance the thermoelectric capabilities of BiCuSeO.
This paper was partly sponsored by the College of Engineering/ University of Basra.
[1] Zhou, Z., Huang, Y., Wei, B., Yang, Y., Yu, D., Zheng, Y., Lin, Y.H. (2023). Compositing effects for high thermoelectric performance of Cu2Se-based materials. Nature Communications, 14(1): 2410. https://doi.org/10.1038/s41467-023-38054-y
[2] Feng, B., Li, G., Pan, Z., Hou, Y., Zhang, C., Jiang, C., He, Z. (2018). Effect of Ba and Pb dual doping on the thermoelectric properties of BiCuSeO ceramics. Materials Letters, 217: 189-193. https://doi.org/10.1016/j.matlet.2018.01.074
[3] Shi, X.L., Zou, J., Chen, Z.G. (2020). Advanced thermoelectric design: from materials and structures to devices. Chemical Reviews, 120(15): 7399-7515. https://doi.org/10.1021/acs.chemrev.0c00026
[4] Seetawan, T., Amornkitbamrung, V., Burinprakhon, T., Maensiri, S., Tongbai, P., Kurosaki, K., Yamanaka, S. (2006). Effect of sintering temperature on the thermoelectric properties of NaxCo2O4. Journal of alloys and compounds, 416(1-2): 291-295. https://doi.org/10.1016/j.jallcom.2005.08.035
[5] Li, F., Li, J.F., Zhao, L.D., Xiang, K., Liu, Y., Zhang, B.P., Zhu, H.M. (2012). Polycrystalline BiCuSeO oxide as a potential thermoelectric material. Energy & Environmental Science, 5(5): 7188-7195. https://doi.org/10.1039/C2EE21274A
[6] Liu, Y., Ding, J., Xu, B., Lan, J., Zheng, Y., Zhan, B., Nan, C. (2015). Enhanced thermoelectric performance of La-doped BiCuSeO by tuning band structure. Applied Physics Letters, 106(23): 233903. https://doi.org/10.1063/1.4922492
[7] Kim, D.H., Hong, H.Y., Park, K. (2021). High thermoelectric properties of p-type BiCuSeO co−doped with Ca2+ and Ba2+. Journal of Alloys and Compounds, 876: 159969. https://doi.org/10.1016/j.jallcom.2021.159969
[8] Zhao, L.D., Berardan, D., Pei, Y.L., Byl, C., Pinsard-Gaudart, L., Dragoe, N. (2010). Bi1-xSrxCuSeO oxyselenides as promising thermoelectric materials. Applied Physics Letters, 97(9): 092118. https://doi.org/10.1063/1.3485050
[9] Xu, F., Li, A., Huang, Z., Rao, Y., Lu, B., Wu, Y. (2021). Effect of Al doping and Cu deficiency on the microstructures and thermoelectric properties of BiCuSeO-based thermoelectric materials. Journal of Electronic Materials, 50: 3580-3591. https://doi.org/10.1007/s11664-021-08862-3
[10] Zhao, Z., Zheng, J., Li, Y., Wang, S., Liu, S., Zhan, S., Zhao, L.D. (2024). Realizing BiCuSeO-based thermoelectric device for ultrahigh carrier mobility through texturation. Nano Energy, 126: 109649. https://doi.org/10.1016/j.nanoen.2024.109649
[11] Kim, D.H., Hong, H.Y., Lee, J.K., Park, S.D., Park, K. (2020). Crystal structure and thermoelectric transport properties of Cu-deficient BiCuSeO oxyselenides. Journal of Materials Research and Technology, 9(6): 16202-16213. https://doi.org/10.1016/j.jmrt.2020.11.022
[12] Kang, H., Li, J., Liu, Y., Guo, E., Chen, Z., Liu, D., Wang, T. (2018). Optimizing the thermoelectric transport properties of BiCuSeO via doping with the rare-earth variable-valence element Yb. Journal of Materials Chemistry C, 6(31): 8479-8487. https://doi.org/10.1039/C8TC02700E
[13] He, T., Li, X., Tang, J., Zuo, X., Zheng, Y., Zhang, D., Tang, G. (2020). Boosting thermoelectric performance of BiCuSeO by improving carrier mobility through light element doping and introducing nanostructures. Journal of Alloys and Compounds, 831: 154755. https://doi.org/10.1016/j.jallcom.2020.154755
[14] Shen, J., Yu, H., Pei, Y., Chen, Y. (2017). Resonant doping in BiCuSeO thermoelectrics from first principles. Journal of Materials Chemistry A, 5(3): 931-936. https://doi.org/10.1039/C6TA08788D
[15] Farooq, M.U., Butt, S., Gao, K., Pang, X.L., Sun, X., Mohmed, F., Mahmood, N. (2017). Improved thermoelectric performance of BiCuSeO by Ag substitution at Cu site. Journal of Alloys and Compounds, 691: 572-577. https://doi.org/10.1016/j.jallcom.2016.08.236
[16] Pei, Z., Xiang, G., Sun, X., Fu, Z., Qiao, Y., Wang, L., Chen, J. (2023). Effect of NaF doping on the microstructure and thermoelectric performance of BiCuSeO ceramics. Coatings, 13(12): 2069. https://doi.org/10.3390/coatings13122069
[17] Toriyama, M.Y., Qu, J., Snyder, G.J., Gorai, P. (2021). Defect chemistry and doping of BiCuSeO. Journal of Materials Chemistry A, 9(36): 20685-20694. https://doi.org/10.1039/D1TA05112A
[18] Li, F., Ruan, M., Chen, Y., Wang, W., Luo, J., Zheng, Z., Fan, P. (2019). Enhanced thermoelectric properties of polycrystalline BiCuSeO via dual-doping in Bi sites. Inorganic Chemistry Frontiers, 6(3): 799-807. https://doi.org/10.1039/C8QI01402G
[19] Farooq, M.U., Butt, S., Gao, K., Zhu, Y., Sun, X., Pang, X., Xu, W. (2016). Cd-doping a facile approach for better thermoelectric transport properties of BiCuSeO oxyselenides. RSC Advances, 6(40): 33789-33797. https://doi.org/10.1039/C6RA01686C
[20] Obot, I.B., Macdonald, D.D., Gasem, Z.M. (2015). Density functional theory (DFT) as a powerful tool for designing new organic corrosion inhibitors. Part 1: An overview. Corrosion Science, 99: 1-30. https://doi.org/10.1016/j.corsci.2015.01.037
[21] Rogl, P., Podloucky, R., Wolf, W. (2014). DFT calculations: A powerful tool for materials design. Journal of Phase Equilibria and Diffusion, 35: 221-222. https://doi.org/10.1007/s11669-014-0309-7
[22] Sharan, A., Sajjad, M., Singh, N. (2023). Fundamentals of first-principles studies. In Chemically Deposited Metal Chalcogenide-based Carbon Composites for Versatile Applications, pp. 379-392. https://doi.org/10.1007/978-3-031-23401-9_13
[23] Orio, M., Pantazis, D.A., Neese, F. (2009). Density functional theory. Photosynthesis Research, 102: 443-453. https://doi.org/10.1007/s11120-009-9404-8
[24] Naseri, M., Hoat, D.M. (2021). Prediction of a new 2D B2CO monolayer from density functional theory. Computational Materials Science, 186: 109975. https://doi.org/10.1016/j.commatsci.2020.109975
[25] Abdullah, B.J. (2022). Size effect of band gap in semiconductor nanocrystals and nanostructures from density functional theory within HSE06. Materials Science in Semiconductor Processing, 137: 106214. https://doi.org/10.1016/j.mssp.2021.106214
[26] Quantum ESPRESSO. (2024). https://www.quantum-espresso.org/Quantum.
[27] Das, S., Valiyaveettil, S.M., Chen, K.H., Suwas, S., Chandra Mallik, R. (2019). Thermoelectric properties of Pb and Na dual doped BiCuSeO. AIP Advances, 9(1): 015025. https://doi.org/10.1063/1.5066296
[28] Yang, Y., Liu, X., Liang, X. (2017). Thermoelectric properties of Bi 1− x Sn x CuSeO solid solutions. Dalton Transactions, 46(8): 2510-2515. https://doi.org/10.1039/C6DT04885D
[29] Feng, B., Li, G., Hu, X., Liu, P., Li, R., Zhang, Y., Fan, X.A. (2020). Enhancement of thermoelectric performances of BiCuSeO through Y doping and grain refining. Journal of Materials Science: Materials in Electronics, 31: 4915-4923. https://doi.org/10.1007/s10854-020-03056-9
[30] Laing, M. (2002). The electronegativity of a metal and its Eo: Should they correlate? South African Journal of Science, 98(11): 573-580. https://hdl.handle.net/10520/EJC97422.
[31] Feng, B., Li, G.Q., Hu, X.M., Liu, P.H., Li, R.S., Zhang, Y.L., Fan, X.A. (2020). Improvement of thermoelectric performance in BiCuSeO oxide by ho doping and band modulation. Chinese Physics Letters, 37(3): 037201. https://doi.org/10.1088/0256-307X/37/3/037201
[32] Pingak, R.K., Bouhmaidi, S., Harbi, A., Setti, L., Nitti, F., Moutaabbid, M., Ndii, M.Z. (2023). A DFT investigation of lead-free TlSnX 3 (X= Cl, Br, or I) perovskites for potential applications in solar cells and thermoelectric devices. RSC Advances, 13(48): 33875-33886. https://doi.org/10.1039/D3RA06685A