V.I. Aladesanmi*![]() | O.T. Laseinde
| O.T. Laseinde![]()
© 2025 The authors. This article is published by IIETA and is licensed under the CC BY 4.0 license (http://creativecommons.org/licenses/by/4.0/).
OPEN ACCESS
The effect of laser power variation on the mechanical properties of laser-clad titanium materials was studied in this research. An optimization model was executed to identify the independent effect of laser power over other processing parameters. The mechanical properties of the microhardness and wear of the produced samples were derived. The resulting microhardness ranges from 131.38HV to 350.04HV. The wear experiment's working loads were 5N and 10N. The 5N wear load reveals a wear rate range of 0.66mm2/N to 0.186mm2/N, with a wear volume of 0.66mm3 to 5.58mm3 and a coefficient of friction of 0.074 to 0.172. The 10N wear load reveals a wear rate range of 0.039mm2/N to 0.249mm3, a wear volume of 1.17mm3 to 7.47mm3, and a coefficient of friction range of 0.204 to 0.245. An optimum hardness of 350.04HV was obtained at 1.5KW laser power with a wear rate of 0.067mm2/N, a wear volume of 2.01mm3, a coefficient of friction of 0.111 at 5N load, and a wear rate of 0.090mm2/N, a wear volume of 2.70mm3, and a coefficient of friction of 0.227mm3/N at 10N load. As the laser power increased, we observed an increase in wear rate, wear volume, and coefficient of friction. We used Python 3.9 of Google Collab to compute a multilinear regression predictive analysis of the correlative relationship between the clad microhardness, wear rate, and processing parameter. The model revealed a coefficient of determinant r2-score of 0.89, a mean square error of 0.0006, and a mean absolute error of 0.0229. The model result confirmed a significant statistical correlation. This research is useful for the additive shaping of industrial carbon steel machinery for maintenance and wear control measures.
carbon steel, titanium, laser cladding, multilinear regression
Steel’s making and forming from the vast availability of iron ore makes it the most produced material. It is the core of manufacturing for infrastructure and industry purposes [1-4]. Steel mechanical properties have a range of performances liable to wear and delamination after long use and exposure to atmospheric conditions of moisture, air, heat, pressure, and humidity [1, 5-8]. According to Lyu et al. [9] wear greatly depends on the surrounding circumstances. His research demonstrated how adhesive wear is more common in low-moisture environments and gets worse at colder temperatures. As contact humidity increased, the steel material's wear mechanism changed from adhesive to oxidative wear. Steel wear types have been classified as either adhesive, abrasive, fatigued, or erosive. Abrasive wear is mostly characterized by speedy contact pull-off from steel surfaces. Adhesive wear is a mild contact wear mechanism. Erosive wear is depicted by liquid flow interactive contacts. Shock pressure and constant load distribution lead to fatigue wear [10-12]. Niu et al. [13] research introduced retained austenite in-between the martensite lath to improve the ductility and toughness of the high-strength wear-resistant steels through a dynamic partitioning process.
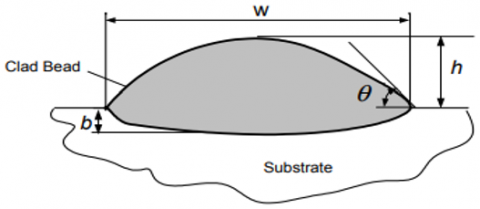
Figure 1. Laser clad bead on substrate
A means of improving the longevity and maintenance of carbon steel has initiated the techniques of additive manufacturing. According to Milewski's [14] research, additive manufacturing enables the production of intricate, free-form metal items through 3D, eliminating the need for costly processes, tools, and expertise in metalworking. This process instantly transforms solid free-form designs into nearly net-shaped metal objects [15]. Additive manufacturing processes have been executed through the medium of laser cladding lamination, power bed, or deposition. The engineering process of sintering, bonding, and fusion of powdered material through electron beams, electric arcs, and lasers is annexed. The manufacturing operations are executed under processing parameters such as laser power, gas flow rate, scanning speed, etc. Processing parameters with optimum mechanical properties are desirable [16]. These are scientifically achieved through predictive models established through the machine learning of the material data. According to Ackermann and Haase [17] there is a growing body of scientific literature in the field of metal additive manufacturing (AM), indicating the growing significance of data-driven approaches. The integration of data-driven techniques holds promise for removing existing manufacturing and design constraints. Machine learning (ML) techniques extend experimental and simulation-based methods to provide quick and computationally effective predictions. Multilinear regression predictive analysis of machine learning in additive manufacturing helps in the building of models, using minimum building time. This enables a quality 3D design of nanocomposite and metals with CAD. Machine learning models assist in designing algorithms for additive manufacturing, ensuring quality assurance, and optimizing processes for dimensional accuracy, thereby reducing deformation, enhancing structural strength, and improving surface optimization processes [18-22]. Figure 1 shows the pictural view of a laser-clad bead on a substrate.
The research derived a predictive relationship between the microhardness properties of laser cladded titanium coating on carbon steel and its wear properties measurement at a range of varying laser power of the experiment processing parameter. The research proposed machine learning derivatives of manufacturing materials. The insights provided in this research inform the new material's design wear rate performance at varying processing parameters.
A Kuka-Robot Ytterbic Laser (YLS-2000-TR) with a 3D-CAD model was used for metal bed manufacturing technology. It was operated in a high-power range between 1KW and 2KW, scanning speeds of 1.1mm/sec and 1.2mm/sec at constant gas and powder flow rates. The scanning speed was selected as a varying parameter based on its influence on heat input, clad quality, geometry, and process efficiency. The gas and powder flow rates were maintained at a constant level to ensure process stability and to concentrate on the impact of scanning speed during optimization. A substrate of carbon steel plate measuring 180mm×40mm×20mm in size was utilized. The substrate was initially sandblasted and cleansed with acetone to eliminate oil deposits and other contaminants, followed by preheating to 250℃ prior to the commencement of deposition utilizing a spot size of 1.2mm. The laser-clad operation material used was titanium powder (98% pure _87μm). This is melted in layers on the working surface of carbon steel in a three-dimensional printing mode until the desired clad height is achieved. The microstructure of the titanium clad at the optimum hardness was done with the scanning electron microscope before and after the wear experiment.
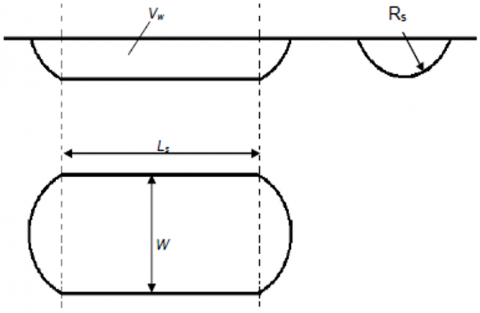
The hardness mechanical test was executed with an EmcoTEST-DuraScan hardness tester. Fifteen indentation hardness mechanical tests were executed at a load of 0.5kg and a dwell time of 15 sec. The mechanical wear experiment was carried out with the ball-on disc Standard Tribometer Version 7.3.13 made by Anton Paar GmBh. It works by cyclic reciprocating motion. The wear test was conducted on the sample with the highest hardness at 1.5KW laser power. The test uses steel of about 10mm diameter with a stroke length of 3m and 4.5m and a load of 5 N and 10 N respectively. The reciprocating spindle acquisition frequency is 100Hz, with a linear speed of 9.82m/s in a single-way mode. The wear scar width is evaluated with the profilometry of a scanning electron microscope. The wear depth and wear volume were derived from Archard’s wear model equations, as shown below in Eqs. (1) and (2). Figure 2 shows the schematic diagram of the wear scar.
A multilinear machine learning approach was used in the predictive analysis of the data on their processing parameters and mechanical wear properties. The multilinear regression machine learning technique was selected due to its comprehensibility, the moderate dataset of eleven samples, and the apparent linear correlations among the variables. The predictive analysis approach was affirmed by Malley et al. [23] that the mechanical properties and performance of engineering materials data are in correlation patterns and relationships with their manufacturing processing parameters [23].
$Z_W=R_S-\sqrt{R_S{ }^2-\frac{W^2}{4}}$ (1)
$V_W=L_s\left[R_S^2 sin ^{-1}\left(\frac{W}{2 R_S}\right)-\frac{W}{2}\left(R_S-Z_w\right)\right]+\frac{\pi}{3} Z_W^2\left(3 R_S-Z_W\right)$ (2)
where,
Vw=Wear volume,
Zw=Wear depth,
Ls=Stroke length,
W=Wear scar width,
Rs=Radius of round surface at both ends.
Figure 2. Wear scar schematic diagram
Table 1 shows the hardness results of titanium clad at each processing parameter of the laser clad and scanning speed, while Figure 3 shows its pictorial view. The average of the fifteen hardness iterations was derived. The titanium sample laser-clad surface has a maximum hardness of 350.04VH at a laser power of 1.5KW [24]. This is a good hardness level for titanium efficient coating applications. The microstructure of the titanium clad at optimum hardness shows elongated dendritic grains, as shown in Figure 4. The microstructure has barely any pores. This shows a firm welding bond between the titanium powder clad [24].
Table 1. The hardness of titanium-clad
|
Sample |
Laser Power (KW) |
Scanning Speed (mm/sec) |
Hardness (HV) |
|
1 |
1.0 |
1 |
131.38 |
|
2 |
1.1 |
1.1 |
190.07 |
|
3 |
1.2 |
1.2 |
250.40 |
|
4 |
1.3 |
1.1 |
299.54 |
|
5 |
1.4 |
1.1 |
325.22 |
|
6 |
1.5 |
1.2 |
350.04 |
|
7 |
1.6 |
1.1 |
290.03 |
|
8 |
1.7 |
1.1 |
200.43 |
|
9 |
1.8 |
1.1 |
175.83 |
|
10 |
1.9 |
1.2 |
167.78 |
|
11 |
2.0 |
1.1 |
145.41 |
Figure 3. Graph of hardness against laser power
Figure 4. Microstructure of titanium clad @ laser power 1.5KW
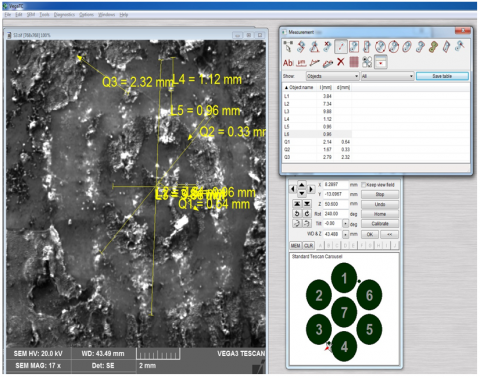
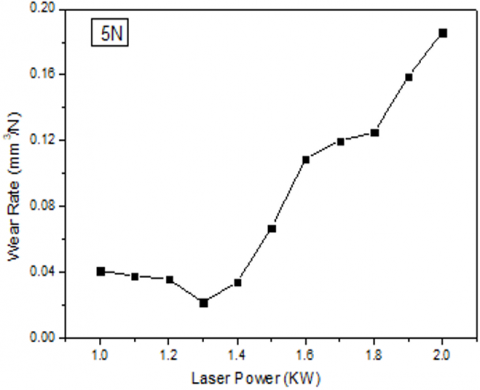
Figure 5 shows the wear depth profilometry evaluation with the scanning electron microscope. It reveals a dry slide surface microstructure with worn-out titanium-clad particles. Wear scar width and wear depth were measured and evaluated consecutively. Table 2 shows the wear analysis results of the wear rate and wear volume at 5N load, with Figures 6 and 7 showing their pictural view consecutively. An increase in the wear loss trend was observed as the laser power increased. The increase in wear rate and wear volume was due to the disintegration development in the sample membrane structure with minimal fusion bond at higher laser power [25].
Figure 5. Wear depth profilometry
Table 2. Wear rate and wear volume @ 5 N
|
Sample |
Wear Rate (mm2/N) |
Wear Volume (mm3) |
|
1 |
0.144 |
4.32 |
|
2 |
0.130 |
3.90 |
|
3 |
0.087 |
2.61 |
|
4 |
0.039 |
1.17 |
|
5 |
0.054 |
1.62 |
|
6 |
0.090 |
2.7 |
|
7 |
0.138 |
4.14 |
|
8 |
0.179 |
5.37 |
|
9 |
0.201 |
6.03 |
|
10 |
0.221 |
6.63 |
|
11 |
0249 |
7.47 |
Figure 6. Graph of wear rate against laser power @ 5 N
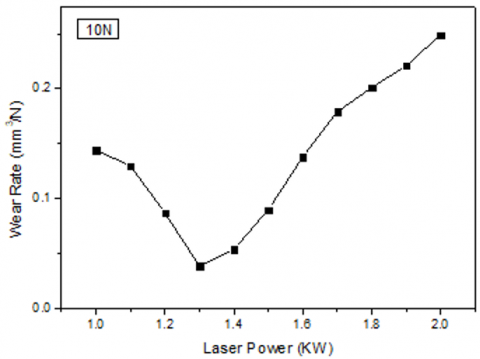
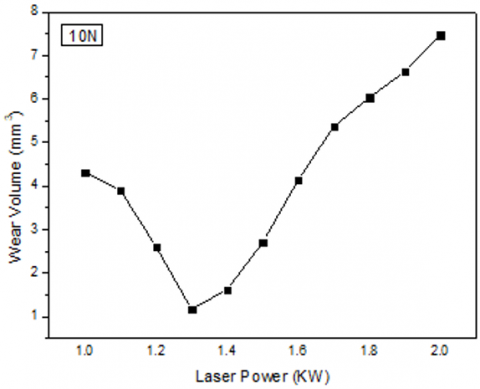
Table 3 shows the wear rate and wear volume results at 10 N load, with Figures 8 and 9 showing their pictorial views consecutively. We observe that the wear rate and volume increase with increasing load. An increase in load reveals an increase in clad wear surface plastic deformation, and increased delamination of the titanium clad [25].
Figure 7. Graph of laser power against wear volume @ 5 N
Table 3. Wear rate and wear volume @ 10 N
|
Sample |
Wear Rate (mm2/N) |
Wear Volume (mm3) |
|
1 |
0.041 |
1.23 |
|
2 |
0.038 |
1.14 |
|
3 |
0.036 |
1.08 |
|
4 |
0.022 |
0.66 |
|
5 |
0.034 |
1.02 |
|
6 |
0.067 |
2.01 |
|
7 |
0.109 |
3.27 |
|
8 |
0.120 |
3.60 |
|
9 |
0.125 |
3.75 |
|
10 |
0.159 |
4.77 |
|
11 |
0.186 |
5.58 |
Figure 8. Graph of laser power against wear rate @ 10 N
Figure 9. Graph of laser power against wear volume @ 10 N
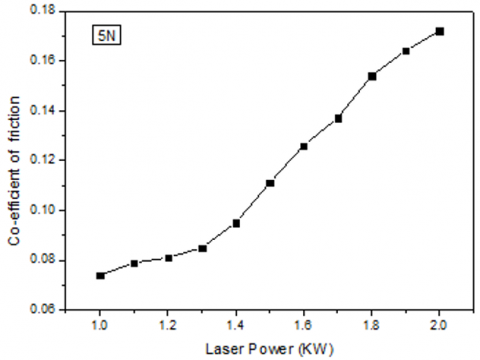
Table 4 reveals the coefficient of friction results and analysis at loads 5N and 10N, while Figures 10 and 11 show its pictorial view consecutively. It can be observed that the coefficient of friction increases as the load increases. A higher wear load increases frictional heat generation. This results in an increased coefficient of friction wear rate and volume.
Table 4. Coefficient of friction analysis
|
Samples |
Coefficient of Friction |
|
|
5 N |
10 N |
|
|
1 |
0.074 |
0.204 |
|
2 |
0.079 |
0.213 |
|
3 |
0.081 |
0.222 |
|
4 |
0.085 |
0.221 |
|
5 |
0.095 |
0.224 |
|
6 |
0.111 |
0.227 |
|
7 |
0.126 |
0.229 |
|
8 |
0.137 |
0.230 |
|
9 |
0.154 |
0.232 |
|
10 |
0.164 |
0.234 |
|
11 |
0.172 |
0.245 |
Figure 10. Graph of coefficient of friction @ 5N
Figure 11. Graph of coefficient of friction at 10 N
Table 5. R2-score with error values
|
|
R2-Score |
Mean Square Error |
Mean Absolute Error |
|
Wear Rate (mm2/N) |
0.89 |
0.0006 |
0.0229 |
The multilinear regression analysis was done on a higher 10 N test load dataset with a higher coefficient of friction. Google Collab Python 3.9 was utilized to derive the coefficients of the parameters, the intercepts, and the error in the equation. Python codes in conformance with multilinear regression analysis were utilized. Digital packages of Pandas, NumPy, and Sklearn-metrics were used to learn and train the dataset. The predictive results and analysis of wear rate as the dependent variable and hardness, laser power, and scanning speed as the independent variables are shown in Eq. (3) below. Table 5 shows the coefficient of the determinant r2-score as 0.89. This shows a statistically significant correlation result. The mean square error is 0.0006 and the mean absolute error is 0.0229. These error values also define a significant statistical correlation.
$W R=L P(0.10)+S S(0.04)-H D(0.15)+1045.30$ (3)
where, WR=Wear rate (mm2/N),
LP=Laser power (KW),
SS=Scanning speed (mm/sec),
HD=Hardness (HV).
This research approach is scalable due to improvements in automation, laser power, and powder delivery systems. Nonetheless, it is optimally designed for high-value, high-precision applications and is economically feasible for additive manufacturing sectors where superior performance, durability, and the repair of essential components warrant expenses.
We used titanium powder as an additive shaping material in cladding measures to create a resilient coating on carbon steel under various conditions. The mechanical properties of wear rate, wear volume, and coefficient of friction increased as the laser power increased. At a 5N wear load, the wear rate increased from 0.067mm2/N to 0.186mm2/N, the wear volume increased from 0.66mm3 to 5.58mm3, and a coefficient of friction increased from 0.074 to 0.172. At a 10N wear load, the wear rate increased from 0.039mm2/N to 0.249mm3, a wear volume increased from 1.17mm3 to 7.47mm3, and the coefficient of friction increased from 0.204 to 0.245. An optimum hardness of 350.04HV was obtained at 1.5kW laser power with a wear rate of 0.067mm2/N, a wear volume of 2.01mm3, a coefficient of friction of 0.111 at 5 N load, and a wear rate of 0.090mm2/N, a wear volume of 2.70mm3, and a coefficient of friction of 0.227mm3/N at 10 N load. It turns out that the machine learning versions of the multilinear regression have a strong statistical correlation, with an r2-score of 0.89, a mean square error of 0.0006, and a mean absolute error of 0.0229. This affirms the working parameter procedures, and results in the least minimum variable error. This research can be applied to the additive shaping of industrial carbon steel robots, rails, and machines under the experimental working parameters.
A due acknowledgement to the Laser Center facilities at CSIR, South Africa, for the additive manufacturing processes.
[1] Kanazawa, T., Hayakawa, M., Vinas, D., Tahara, Y., Hata, N., Yoshimoto, M. (2023). Sustainable technology for remanufacturing of carburized steels by laser hardening. Journal of Materials Research and Technology, 24: 39-48. https://doi.org/10.1016/j.jmrt.2023.02.226
[2] Chen, C.Y., Li, C.H., Tsao, T.C., Chiu, P.H., Tsai, S.P., Yang, J.R., Chiang, L.J., Wang, S.H. (2020). A novel technique for developing a dual-phase steel with a lower strength difference between ferrite and martensite. Materials Today Communications, 23: 100895. https://doi.org/10.1016/j.mtcomm.2020.100895
[3] Amraei, M., Zhao, X.L., Björk, T., Heidarpour, A. (2020). Bond characteristics between high/ultra-high strength steel and ultra-high modulus CFRP laminates. Engineering Structures, 205: 110094. https://doi.org/10.1016/j.engstruct.2019.110094
[4] Zeng, D., Xu, T., Liu, W., Lu, L., Zhang, J., Gong, Y. (2020). Investigation on rolling contact fatigue of railway wheel steel with surface defect. Wear, 446: 203207. https://doi.org/10.1016/j.wear.2020.203207
[5] Liu, J.P., Li, Y.Q., Zhou, Q.Y., Zhang, Y.H., Hu, Y., Shi, L.B., Wang, W.J., Liu, F.S., Zhou, S.B., Tian, C.H. (2019). New insight into the dry rolling-sliding wear mechanism of carbide-free bainitic and pearlitic steel. Wear, 432: 202943. https://doi.org/10.1016/j.wear.2019.202943
[6] Künzel, K., Papež, V., Carrera, K., Sovják, R. (2022). Magnetic properties of steel fibres commonly used in concrete. Materials Today: Proceedings, 62: 2599-2603. https://doi.org/10.1016/j.matpr.2022.04.134
[7] Winzer, N., Bischoff, C., Brugger, P., Thomas, I. (2023). Factors influencing the resistance of dual-phase steels to edge cracking. Materials Science and Engineering: A, 880: 145334. https://doi.org/10.1016/j.msea.2023.145334
[8] Aladesanmi, V.I. (2016). Material and wear characterisation of steel rail on curved railway track. University of Johannesburg (South Africa).
[9] Lyu, Y., Zhu, Y., Olofsson, U. (2015). Wear between wheel and rail: A pin-on-disc study of environmental conditions and iron oxides. Wear, 328: 277-285. https://doi.org/10.1016/j.wear.2015.02.057
[10] Yunxia, C.H.E.N., Wenjun, G.O.N.G., Rui, K.A.N.G. (2020). Review and propositions for the sliding/impact wear behavior in a contact interface. Chinese Journal of Aeronautics, 33(2): 391-406. https://doi.org/10.1016/j.cja.2018.06.004
[11] Kato, K. (2005). Classification of wear mechanisms/models. Wear-Materials, Mechanisms and Practice, 9-20. https://doi.org/10.1002/9780470017029.ch2
[12] Al-Samarai, R.A., Al-Douri, Y. (2024). Wear Mechanisms/Models. In Friction and Wear in Metals. Singapore: Springer Nature Singapore, pp. 33-60. https://doi.org/10.1007/978-981-97-1168-0_2
[13] Niu, G., Jin, D., Wang, Y., Gu, C., Ju, B., Ning, B., Gong, N., Misra, R.D.K., Shang, C., Wu, H. (2024). Effect of retained austenite on impact-abrasion wear performance of high-strength wear-resistant steel prepared by dynamic partitioning process. Wear, 538-539: 205200. https://doi.org/10.1016/j.wear.2023.205200
[14] Milewski, J.O. (2018). Materials and Corrosion. https://doi.org/10.1002/maco.201870124
[15] Aladesanmi, V.I., Fatoba, O.S., Akinlabi, E.T. (2019). Laser cladded Ti+TiB2 on steel rail microstructural effect. Procedia Manufacturing, 33: 709-716. https://doi.org/10.1016/j.promfg.2019.04.089
[16] Aladesanmi, V.I., Fatoba, S.O., Akinlabi, E.T. (2019). Influence of processing parameters on the microhardness property of laser cladded titanium powder. In Journal of Physics: Conference Series. IOP Publishing, 1378(4): 042080. https://doi.org/10.1088/1742-6596/1378/4/042080
[17] Ackermann, M., Haase, C. (2023). Machine learning-based identification of interpretable process-structure linkages in metal additive manufacturing. Additive Manufacturing, 71: 103585. https://doi.org/10.1016/j.addma.2023.103585
[18] Wang, C., Tan, X.P., Tor, S.B., Lim, C.S. (2020). Machine learning in additive manufacturing: State-of-the-art and perspectives. Additive Manufacturing, 36: 101538. https://doi.org/10.1016/j.addma.2020.101538
[19] Jin, Z., Zhang, Z., Demir, K., Gu, G.X. (2020). Machine learning for advanced additive manufacturing. Matter, 3(5): 1541-1556. https://doi.org/10.1016/j.matt.2020.08.023
[20] Qin, J., Hu, F., Liu, Y., Witherell, P., Wang, C.C., Rosen, D.W., Simpson, T.W., Tang, Q. (2022). Research and application of machine learning for additive manufacturing. Additive Manufacturing, 52: 102691. https://doi.org/10.1016/j.addma.2022.102691
[21] Kumar, S., Gopi, T., Harikeerthana, N., Gupta, M.K., Gaur, V., Krolczyk, G.M., Wu, C. (2023). Machine learning techniques in additive manufacturing: A state-of-the-art review on design, processes and production control. Journal of Intelligent Manufacturing, 34(1): 21-55. https://doi.org/10.1007/s10845-022-02029-5
[22] Wang, P., Yang, Y., Moghaddam, N.S. (2022). Process modeling in laser powder bed fusion towards defect detection and quality control via machine learning: The state-of-the-art and research challenges. Journal of Manufacturing Processes, 73: 961-984. https://doi.org/10.1016/j.jmapro.2021.11.037
[23] Malley, S., Reina, C., Nacy, S., Gilles, J., Koohbor, B., Youssef, G. (2022). Predictability of mechanical behavior of additively manufactured particulate composites using machine learning and data-driven approaches. Computers in Industry, 142: 103739. https://doi.org/10.1016/j.compind.2022.103739
[24] Nazari, K.A., Rashid, R.R., Palanisamy, S., Xia, K., Dargusch, M.S. (2018). A novel Ti-Fe composite coating deposited using laser cladding of low-cost recycled nano-crystalline titanium powder. Materials Letters, 229: 301-304. https://doi.org/10.1016/j.matlet.2018.07.038
[25] Bhowmik, A., Dey, D., Biswas, A. (2020). Tribological behaviour of aluminium-titanium diboride (Al7075-TiB2) metal matrix composites prepared by stir casting process. Materials Today: Proceedings, 26: 2000-2004. https://doi.org/10.1016/j.matpr.2020.02.436