Irianto*![]() | Miswar Tumpu
| Miswar Tumpu![]() | Didi S.S. Mabui | Reny Rochmawati | Ardi A. Sila
| Didi S.S. Mabui | Reny Rochmawati | Ardi A. Sila
© 2023 IIETA. This article is published by IIETA and is licensed under the CC BY 4.0 license (http://creativecommons.org/licenses/by/4.0/).
OPEN ACCESS
The recycling of plastics is a crucial element of efforts to reduce the environmental impact of plastic waste. While thermoplastic plastics can be reshaped and recycled, thermoset plastics are not recyclable due to their inherent stiffness. To meet the ambitious plastic waste targets set by the European Union for 2030, new thermochemical processes such as pyrolysis are being explored. In this study, we investigate the potential of pyrolysis to mix two different types of thermoplastic plastics, namely polyethylene terephthalate and polypropylene, and examine the correlation between composition, structural and chemical properties, and electromagnetic wave absorption performance through X-Ray Diffraction (XRD) analysis. The pyrolysis was conducted using a retch 5min+5Hz method in the laboratory with a ratio of 1:1 for the two plastics. Our observations reveal that polyethylene terephthalate plastic melts at 260℃, while polypropylene melts at 160℃. We found that the heated and unheated plastics had the same diffraction pattern, but with varying degrees of intensity. The pyrolyzed plastic wastes were successfully fused by heating at 100℃ for 30 minutes. Our XRD analysis indicates that the characteristic spectral lines of each polymer can be clearly distinguished, and the intensity varies with the composition of the plastic mix. The pyrolyzed plastic wastes showed potential to replace aggregates in asphalt mixes. In conclusion, our study demonstrates that pyrolysis is a promising method for mixing and recycling thermoplastic plastics. The structural and chemical properties of the mixed plastics can be analyzed through XRD analysis, which can provide valuable insights into the correlation between composition and electromagnetic wave absorption performance. The potential for using pyrolyzed plastic wastes as a replacement for aggregates in asphalt mixes highlights the potential for this method to contribute to the circular economy and reduce the environmental impact of plastic waste.
pyrolysis, plastic waste recycling, asphalt binders, polyethylene terephthalate, polypropylene
In Western European countries, the per capita usage of plastic materials is around 60kg/year, while in the United States, it is 80kg/year, and in the United Kingdom, it generates at least 3 million tons of plastic waste annually [1]. Plastic waste, mainly packaging materials such as drink bottles and plastic bags, accounts for the majority of plastic trash [2, 3]. This plastic debris, primarily made of low density polyethylene (LDPE), a thermoplastic plastic that can be easily recycled, has a density of between 0.910 and 0.940 g/cm3 and is highly flexible and provides adequate protection against water vapor, but not against other gases like oxygen [4-6]. Despite the advantages of plastics, their improper disposal negatively affects the ecosystem, reducing soil fertility, and causing flooding by blocking drainage ditches, rivers, and creeks. Burning plastic garbage can also emit potentially dangerous chemicals [7, 8].
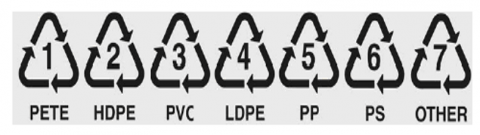
To address plastic waste, the 3Rs (reuse, reduce, recycle) have become the most popular approach. Reusing involves repeatedly using plastic products, reducing refers to limiting the usage or acquisition of plastic products, especially single-use items, while recycling involves repurposing products that have lost their economic value through physical, chemical, or both processes so that they can be used or traded once more [9, 10]. To facilitate identification, recyclable plastic types are marked with numbers, as shown in Figure 1.
Figure 1. Plastic code number [11]
Numerous domestic and international research has been conducted on the inclusion of plastic waste in asphalt mixtures. Researchers have investigated the impact of recycled plastic bottles, specifically PET, on asphalt concrete in flexible pavements [12]. Other studies have highlighted the economic and environmental benefits of incorporating PET plastic waste into asphalt concrete compositions, leading to improvements in Marshall's qualities [13]. Additionally, the response surface methodology has been used to assess the effects of applied stress and temperature on the fatigue life of a modified PET asphalt mixture [14]. Stone mastic asphalt (SMA) mixtures incorporating PET waste have also been studied, showing significant improvements in the mixture's stiffness and resistance to permanent deformation (groove) [15, 16].
Temperature is a critical factor in the quality of hot mix asphalt, and the visco-elastic property of the asphalt material impacts the properties of the asphalt layer, resulting in a decrease in the layer's modulus of elasticity as temperature rises [17]. Pyrolysis, a technology that allows combustion without involving oxygen in the combustion process, is an alternative method for obtaining hydrocarbon energy sources [18]. Waste materials, including plastics, have been increasingly used in asphalt mixtures as part of a sustainable approach to pavement construction. The pyrolysis process can break down the chemical bonds in plastic polymers into hydrocarbon monomers, which can then be used as an energy source. However, the success of the pyrolysis process depends on various factors, including flow velocity, temperature, and catalysts [19].
This study aims to blend two types of plastic, namely polyethylene terephthalate and polypropylene, to establish compositional correlations and correlate structural and chemical qualities with electromagnetic wave absorption performance. The pyrolysis conditions were set to 5 min at a frequency of 5 Hz in the laboratory, and the ratio of plastics used was 1:1 (polyethylene terephthalate and polypropylene). The study is based on the observation that PET plastic melts at 260°C while PP melts at 160°C, and the goal is to determine the temperature at which these two types of plastic can fuse. The two types of plastic will be blended together in the AC-WC mixture as a combination of polyethylene terephthalate and polypropylene.
2.1 Difference between polyethylene terephthalate and polypropylene
A technique known as polymerization is used to create the type of macromolecule known as plastic. Thermoplastic and thermosetting plastics can be divided into two categories [20]. A plastic substance known as a thermoplastics melts at a specific temperature and may be reshaped into the desired shape. A material known as thermosetting, on the other hand, can only be melted once and then solidified again [11]. Thermoplastic is a type of plastic that enables recycling based on the characteristics of the two plastic groups mentioned above.
In the production and recycling of plastics, understanding the thermal characteristics of various types of plastic is crucial. Melting point (Tm), transition temperature (Tg), and decomposition temperature are crucial thermal parameters [21]. The temperature at which structural stretching of the plastic occurs, changing its state from hard to more flexible, is known as the transition temperature. The plastic expands in volume above the melting point, allowing the molecules to move more freely and increasing the plastic's flexibility. The temperature at which plastic starts to soften and turn into a liquid is known as the melting temperature. The liquefaction process is restricted by the decomposition temperature. The structure will disintegrate and the plastic will flow easily if the temperature is raised over the melting point. Decomposition happens when the thermal energy is greater than the molecule chains' binding energy. Decomposition of polymers often occurs at temperatures exceeding 1.5 times the transition temperature [22, 23]. Figure 2 and Table 1 display the various polyethylene therepthalate and polypropylene plastic varieties.
Figure 2. Polyethylene terepthalate and polypropylene plastic waste
Table 1. Differences between polyethylene terepthalate and polypropylene plastic waste
|
Difference |
Polypropylene Plastic |
Polyethylene Terepthalate Plastic |
|
Chemical |
(C3H6)x |
C10HsO4 |
|
Characteristic |
Soft and waxy feel, lighter in quality, and has a certain transparency. |
High chemical stability, good hygienic properties, and high heat resistance. |
|
Basic Material |
Polymer |
Polyester |
|
Melting Point |
160℃ |
260℃ |
|
Density |
0.855g/cm3 |
1.4g/cm3 |
2.2 Research scheme
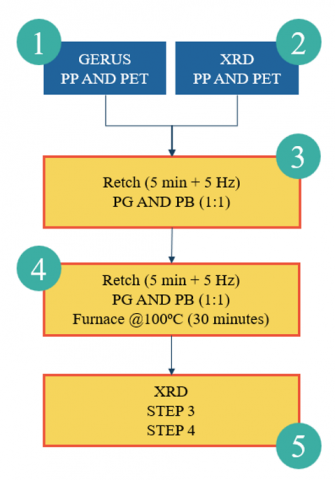
Figure 3 depicts the research plan for mixing two different plastics, polyethylene terepthalate (PET-PB) and polypropylene (PP-PG), using the XRD technique.
Figure 3. Research scheme for combining polyethylene terepthalate and polypropylene plastics
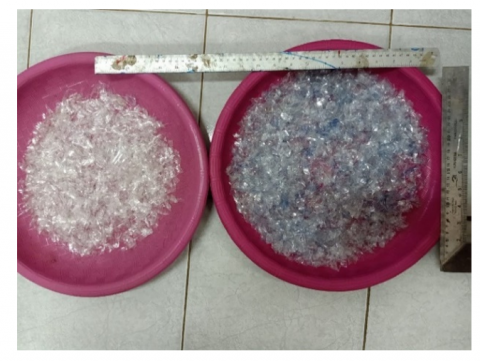
Figure 4. PET and PP plastic waste sample using in the research before grinding process
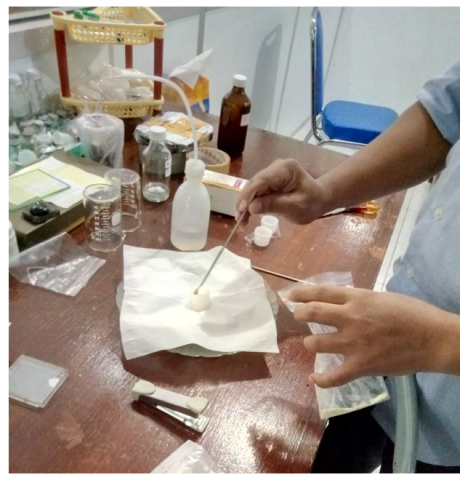
Figure 5. The grinding process carried out in the laboratory
The steps taken are:
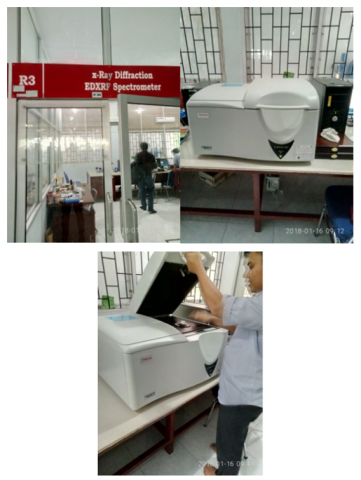
Grated plastic waste (which passes filter No. 4 and is retained in filter No. 50) is obtained from grated PET-type plastic bottles with a manual grater. The pyrolysis conditions was retch 5min+5Hz in laboratory and ratio of plastics used was 1 : 1 (polyethylene terephthalate and polypropylene). If it fails at a low frequency, it is repeated at a frequency of 10Hz within 10 minutes. Continuing step 3, we repeated the 30 minutes warm-up for 30 minutes and the heat retention for 1 hour. Cooling was carried out for 2 hours (samples did not come out of the furnace). The pyrolysis process was carried out by conducting experiments at a temperature of 100℃ for 30 minutes. This test was carried out to try to characterize the combined PET and PP plastic waste, whether it is possible to join or not, and review the crystallinity properties so that they can be used as catalysts in the pyrolysis hydrocracking process of plastics into additives in asphalt mixtures. Figure 6 shows XRD machine and parameters used-make and model, X-ray source, scan range, and step size.
Figure 6. XRD machine and parameters used-make and model, X-ray source, scan range, and step size
Diffraction pattern data, commonly referred to as XRD (X-Ray Diffraction) data, is often used to identify the material being tested. There are various XRD test kits or instruments that are currently widely used to characterize a material, such as Shimadzu, Phillips, Rigaku, and others, which of course have their own XRD techniques. Match is an application created to make it easier to identify the phase of diffraction data from powder samples. The basic principle of this program is to compare the diffraction pattern of your sample (obtained from the measurement results of the XRD instrument) with a database containing reference diffraction patterns to identify the phase present in the sample. XRD can be used to identify the sample phase, crystal structure, lattice parameters, density, and crystal volume of the sample.
2.3 X-Ray diffraction
According to Bragg's law, diffraction can only take place if Eq. (1) is met.
$n \lambda=2 d \sin \theta$ (1)
Information:
n-a positive integer, λ-the wave length of the X-Ray depends on the material used, d-the distance between the lattice planes, θ-the angle from the direction of the x-ray radiation.
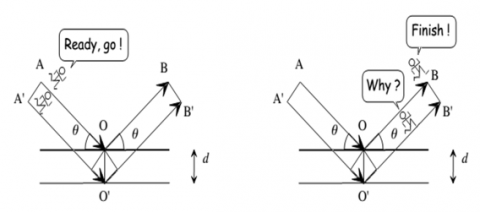
This law relates the wavelength of electromagnetic radiation to the diffraction angle and lattice distance in a crystalline sample. These diffracted X-rays are then detected, processed, and counted. By scanning the sample through a range of two angles, all possible directions of the diffraction lattice must be achieved due to the random orientation of the powdered material. Converting the diffraction peaks to d distances allows identification of minerals because each mineral has a unique set of d distances. Usually, this is achieved by comparing the d-spacing with a standard reference pattern. Illustrations of diffraction events can be seen and understood from Figure 7, Figure 8 and Figure 9.
It should be noticed that the above illustration's different line spacing suggests that constructive interference can explain the key aspects of Bragg's law. It will be simpler for us to comprehend Bragg's law if we can see an example of the various distance lines. Given that this section is on the opposite sides of the corner deviation, its length (shown in bold) must be equal to dsinθ. More specifically, the left and right sides of the wavelength difference are put together to create d.
Figure 7. Illustration of the origin of Bragg's law [24]
Figure 8. The difference between wave travel when propagating from A'O'B' and wave travel when propagating AOB [24]
Figure 9. Relationship between distance lines, d and θ [24]
Will draw back the difference line distance by bolding that part.
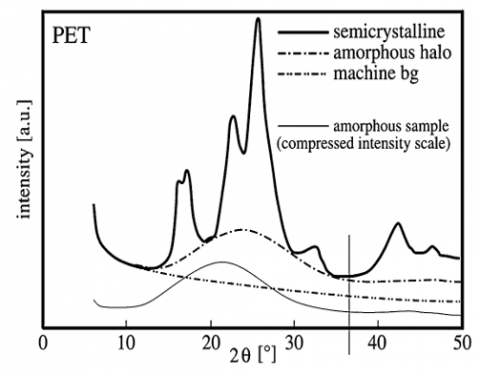
An X-ray generator and a recorder of the diffraction patterns produced by the interaction of the test sample and the X-rays are both employed in X-Ray Diffraction. The amorphous and crystalline states of polymers can be shown by X-ray diffraction, which can also reveal information on polymer structure. Crystalline regions may be haphazardly combined with amorphous regions in the polymer. Crystalline polymers show sharp peaks in their X-ray diffractograms, whereas amorphous polymers typically show broad peaks.
Additionally, X-ray scattering patterns can reveal details on the arrangement of chains in crystallites, an estimate of their size, and the proportion of crystalline to amorphous regions (degrees of crystallinity) in polymer samples [12-14]. Polymeric materials typically have both amorphous and crystalline components, making them semi-crystalline materials. As seen in Figure 10, both crystalline and amorphous components can exhibit distinct scattering intensities.
The premise that crystalline and amorphous regions are present in the same substance and give similar scattering strengths allows for the determination of the degree of crystallinity by X-ray diffraction. The degree of crystallinity (Xc) is determined using Eq. (2) [25].
$X c[\%]=\frac{\text { The area of the crystalline region }}{\text { Area }(\text { crystalline }+ \text { amorphous })} \quad \quad\times 100 \%$ (2)
Figure 10. Crystalline polymer diffractogram
2.4 Location and collection of research material
This study was carried out at Hasanuddin University's Faculty of Mathematics and Natural Sciences, XRD and XRF Rooms, Laboratory of Applied Science and Development. Materials consulted for this investigation include: Grated plastic waste (which passes filter No. 4 and is retained in filter No. 50) obtained from grated polyethylene terepthalate and polypropylene plastic bottles with a manual grater.
3.1 Polyethylene terephthalate and polypropylene plastic waste XRF test results
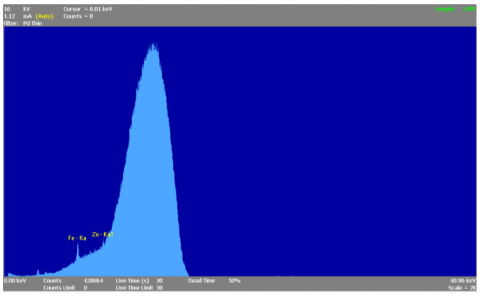
Figure 11. The results of the polyethylene terephthalate plastic waste XRF test
Figure 12. The results of the polypropylene plastic waste XRF test
XRF aims to determine the chemical composition of the constituent elements of a rock or material. An XRF device determines the chemical composition of a sample by measuring the secondary X-ray fluorescence emitted by the sample when excited by a primary X-ray source. The results of the XRF testing of polyethylene terephthalate plastic waste and polypropylene plastic waste are shown in Figure 11 and Figure 12, respectively, along with the relationship between phase angle and intensity. Figure 11 shows the results of the XRF test, which show the presence of Fe and Zn elements at an input current of 1.12mA, while Figure 12 shows the presence of Ag and Ca elements at an input current of 1.14mA. However, the percentage of these elements cannot be calculated because the energy produced is too low, which can be brought on by polyethylene terepthalate type plastic waste that may have been overly modified from the original compound, the amount of these elements is too small, and this polypropylene type plastic waste was. Consequently, a careful analysis is required. Employing the XRD (X-Ray Diffraction) technique is more complicated.
The results of the XRF test showed that the dominant elements read were Fe and Zn. Related to other elements that are not readable, the percentage is also not readable. This is caused by the X-rays emitted by the XRF tool being unable to penetrate the PET and PP plastic waste due to the relatively small energy from PET and PP plastic waste.
3.2 XRD test results for polyethylene terepthalate and polypropylene plastic waste heating transformation
XRD is used to determine the crystal structure of a solid sample. Figure 13 displays the outcomes of the XRD testing of crushed polyethylene terephthalate and polypropylene plastic waste based on the research plan depicted in Figure 3. The diffraction patterns created by polyethylene terephthalate and polypropylene plastic waste and a combination of these two types of plastic, both handled with and without heating, exhibit the same pattern, as can be observed. Additionally, it can be shown that polyethylene terephthalate plastic (plastic bottles) produces an intensity level of 5000 a. u., but polypropylene plastic waste (plastic cups) produces an intensity level of 8000 a. u. There were 8000 a. u. in the combined sample of PET and PP plastic waste that was heated at 100℃ and without heating.
Table 2 and Table 3 show the 2θ angles of polyethylene terephthalate and polypropylene plastic waste, combined polyethylene terephthalate and polypropylene plastic waste with and without heating. The average scherrer produced in polyethylene terephthalate and polypropylene plastic waste samples, combined polyethylene terephthalate and polypropylene plastic waste with and without heating is 9.23nm, 9.72nm, 8.74nm, respectively, and 8.58nm, as can be seen from Table 2 and Table 3.
Figure 13. XRD test results polyethylene terephthalate and polypropylene plastic waste
Table 2. XRD test results for polyethylene terephthalate and polypropylene plastic waste (1)
|
Polyethylene Terephthalate Plastic Waste |
Polypropylene Plastic Waste |
||||||
|
No |
2θ |
FWHM |
Scherrer [nm] |
No |
2θ |
FWHM |
Scherrer [nm] |
|
1 |
9.87 |
1.14 |
7.62 |
1 |
10.68 |
4.00 |
2.17 |
|
2 |
11.14 |
0.90 |
9.66 |
2 |
12.74 |
1.10 |
7.90 |
|
3 |
12.20 |
1.31 |
6.66 |
3 |
14.02 |
0.94 |
9.28 |
|
4 |
13.20 |
1.67 |
5.21 |
5 |
16.79 |
0.92 |
9.46 |
|
6 |
16.42 |
3.90 |
2.24 |
6 |
18.78 |
1.67 |
5.24 |
|
12 |
26.16 |
1.75 |
5.08 |
8 |
21.44 |
1.51 |
5.83 |
|
13 |
28.62 |
0.99 |
9.02 |
9 |
25.39 |
0.75 |
11.89 |
|
14 |
37.88 |
0.66 |
13.94 |
10 |
28.66 |
1.30 |
6.88 |
|
16 |
39.72 |
1.24 |
7.42 |
11 |
37.82 |
0.70 |
13.12 |
|
20 |
44.00 |
0.82 |
11.43 |
12 |
39.48 |
0.64 |
14.28 |
|
23 |
47.60 |
1.60 |
5.91 |
13 |
42.61 |
1.57 |
5.90 |
|
24 |
57.46 |
0.58 |
16.92 |
14 |
44.02 |
0.59 |
15.69 |
|
25 |
64.39 |
0.54 |
18.90 |
15 |
64.40 |
0.55 |
18.72 |
|
Average |
9.23 |
Average |
9.72 |
||||
Table 3. XRD test results for polyethylene terephthalate and polypropylene plastic waste (2)
|
Heating |
Without Heating |
||||||
|
No |
2θ |
FWHM |
Scherrer [nm] |
No |
2θ |
FWHM |
Scherrer [nm] |
|
1 |
12.86 |
0.99 |
8.80 |
1 |
12.88 |
1.20 |
7.24 |
|
2 |
14.19 |
0.94 |
9.26 |
2 |
14.17 |
1.06 |
8.25 |
|
4 |
16.91 |
1.30 |
6.70 |
4 |
16.84 |
1.74 |
5.03 |
|
7 |
21.62 |
1.87 |
4.72 |
7 |
21.55 |
2.06 |
4.27 |
|
8 |
25.76 |
1.75 |
5.08 |
8 |
25.84 |
1.83 |
4.85 |
|
9 |
28.44 |
1.38 |
6.45 |
9 |
28.62 |
1.18 |
7.57 |
|
10 |
37.85 |
0.69 |
13.30 |
10 |
37.85 |
0.65 |
13.96 |
|
11 |
41.74 |
1.50 |
6.17 |
11 |
39.19 |
1.45 |
6.32 |
|
12 |
42.96 |
2.18 |
4.26 |
12 |
42.68 |
1.82 |
5.09 |
|
13 |
44.02 |
0.79 |
11.75 |
13 |
44.03 |
0.71 |
13.06 |
|
14 |
64.44 |
0.52 |
19.68 |
14 |
64.44 |
0.54 |
18.76 |
|
Average |
8.74 |
Average |
8.58 |
||||
Various elements have been detected in PET and PP plastic waste or a combination of the two, PET-PP, but have not been able to work optimally on the hardness properties of the plastic waste. Plastic waste samples should be preheated to a high temperature to activate other elements that work optimally as mechanical characteristics of plastic waste, especially its hardness properties. If the measurement of hardness uses high temperatures, it is possible that other elements will become more active and play a role in increasing the hardness of plastic waste.
Information:
a. u–absorb unit (intensity is the number of X-rays that are diffracted by the lattice formed by the atoms that make up the crystal), deg–degree (The unit of 2θ is the angle between the incident ray and the reflected ray).
Information:
θ-the angle from the direction of the x-ray radiation, FWHM -Full Width at Half Maximum (rad), Scherrer-The Scherrer equation, in X-ray diffraction and crystallography, is a formula that relates the size of sub- micrometre crystallites in a solid to the broadening of a peak in a diffraction pattern.
In Table 3, it can be seen that the Scherrer value indicates the degree of fusion between PET and PP on heating. The Scherrer value is strongly influenced by the magnitude of the diffraction angle that occurs (2); the FWHM value is used to sort and eliminate the diffraction peaks, which are affected by lattice strain and crystallite size in broadening the diffraction peaks. The effect of lattice strain and crystallite size will cause the formation of a linear pattern with a positive gradient from an angle range of 2 at 0° to 100°. The lattice strain and crystallite size values are not absolute values but are relative values because, until now, it is not certain what the accuracy value is. Therefore, these values can only be used to be compared with each other (comparison).
This research combines PET and PP plastic waste at 100℃ which is heated for 30 minutes. The selection of the heating temperature and time is based on the assumptions of the results of the XRF tests that were carried out previously for each plastic waste material. This is shown by the Scherrer equation systematically showing increased values of nano crystalline size as d values decrease and 2θ values increase, since β. cos θ cannot be maintained as constant.
The diffraction pattern is expressed by the size of the angles formed as a result of the diffraction of light rays by crystals in the material. The angle value is expressed in 2, where represents the angle of incidence of light. While the value of 2θ of incidence with the diffraction angle detected by the detector. Sharp diffractogram peaks with high intensities indicate a crystalline solid.
3.3 Polyethylene terephthalate and polypropylene plastic waste modified in asphalt mixtures
One of the most significant and popular additions for enhancing the characteristics of asphalt is polymers. As a binder modifier, synthetic and virgin polymers have been employed in asphalt since 1843 to increase the material's resistance to permanent deformation brought on by temperature variations [26-28]. Due to their high cost, virgin polymers are only suitable for small-scale usage in enhancing asphalt binder characteristics. Many research projects have been developed to incorporate waste plastics into bitumen and examine the impact of these additives on the properties of the modified asphalt due to the current problem of reducing plastic waste and finding sustainable routes for its valorization and re-use.
An asphalt mixture's stability confirms how well it performs when loaded. The inclusion of recycled PO plastic has been shown to significantly increase the stiffness and hence the stability of the asphalt mixture, but only up to a specific amount before the stability starts to decline [29-31]. Recently, it has been suggested that waste plastic be included into warm mix asphalt (WMA) technologies rather than modifying asphalt binders due to the difficulties connected with doing so. Because WMA combinations are produced at lower temperatures 100-140℃ compared to HMA at>150℃, less energy, money, fuel, and harmful gases are required without sacrificing the mix's performance [32].
It can also be explained by the increase in performance that occurs in the test object due to the influence of the plastic waste used. This effect causes the mixture to become denser, but swelling occurs due to excessive plastic waste, so that the asphalt becomes brittle and loses its adhesive power. Therefore, it affects the flexibility and adhesion of asphalt and can cause the road to be easily damaged when receiving traffic loads.
The results of the study also show that the performance value of the asphalt mixture depends on the binder source and the aging time, as with a long aging time, the hardness and viscosity of the binder increase, thereby reducing penetration and increasing the softening point. In addition, changes in thermo-viscoelastic properties are characterized by increasing viscosity, decreasing binder penetration, and increasing the softening point of asphalt.
The findings demonstrated that these two forms of plastic, when heated and when not heated, had the different diffraction pattern but with same degrees of intensity. Therefore, by heating at 100℃ for 30 minutes polyethylene terephthalate and polypropylene type plastic can be fused. The findings of this study can help with the construction of national infrastructure using waste materials, particularly combined PET and PP type plastic waste, and natural resources like Buton asphalt. This is projected to promote the usage of environmentally friendly development.
From the results of this study, it was found that the increase in the performance of asphalt mixtures under normal circumstances due to the addition of plastic waste indicated that PET and PP plastic waste or a combination of the two could coalesce as polymeric materials and petroleum bitumen so as to increase the bonding strength of the binding materials.
The results of this study can support the development of national infrastructure based on the use of natural materials such as Buton asphalt and waste materials, especially PET and PP type plastic waste or a combination of the two, which is then expected to be able to increase the application of environmentally sound development.
|
n |
A positive integer |
|
λ |
The wave length of the X-Ray depends on the material used |
|
d |
The distance between the lattice planes |
|
θ |
The angle from the direction of the x-ray radiation |
|
Xc |
The degree of crystallinity |
|
a.u |
Absorb unit |
|
deg |
Degree |
|
Subscripts |
|
|
SNI |
Standar Nasional Indonesia (Indonesia National Standard) |
|
XRD |
X-Ray Diffraction |
|
XRF |
X-ray Fluorescence |
|
PET |
Polyethylene Terephthalate |
|
PP |
Polyprophylene |
|
Tm |
Melting point |
|
Tg |
Transition temperature |
|
WMA |
Warm mix asphalt |
[1] Indonesian solid waste association. (2013). In Indonesia.
[2] Tumpu, M. (2021). Compressive strength of asphalt concrete wearing course mixture containing waste plastic polypropylene. ARPN Journal of Engineering and Applied Sciences, 15(17): 1835-1839.
[3] Rangan, P.R., Tumpu, M. (2021). Marshall characteristics of ac-wc mixture with the addition of anti-flaking additives. ARPN Journal of Engineering and Applied Sciences, 16(3).
[4] Gusty, S., Tumpu, M., Parung, H., Marzuki, I. (2021). Marshall characteristics of porous asphalt containing low density polyethylene (LDPE) plastic waste. In IOP Conference Series: Earth and Environmental Science. IOP Publishing, 921(1): 012025. https://doi.org/10.1088/1755-1315/921/1/012025
[5] Billmeyer, F.W. (1984). Textbook of Polymer Science. John Wiley & Sons. New York.
[6] Budiyantoro, C. (2010). Thermoplastics in Industry. Media Engineering. Surakarta. In Indonesia.
[7] Jastrzebski, Z.D. (2004). The Nature and Properties of Engineering Materials. John Willey & Sons Inc. New York.
[8] Moghaddam, T.B., Soltani, M., Karim, M.R., Baaj, H. (2015). Optimization of asphalt and modifier contents for polyethylene terephthalate modified asphalt mixtures using response surface methodology. Measurement, 74: 159-169. https://doi.org/10.1016/j.measurement.2015.07.012
[9] Moghaddam, T.B., Karim, M.R., Soltani, M. (2013). Utilization of waste plastic bottles in asphalt mixture. Journal of Engineering Science and Technology, 8(3): 264-271.
[10] Suroso, T.W. (2009). The effect of adding ldpe (low density poly ethylene) plastic wet and dry methods to the performance of asphalt mixtures. Research Center for Roads and Bridges.
[11] United Nations Environment Programme. (2009). Converting waste plastics into a resource. Division of Technology, Industry and Economics International Environmental Technology Centre, Osaka/Shiga.
[12] Sojobi, A.O., Nwobodo, S.E., Aladegboye, O.J. (2016). Recycling of polyethylene terephthalate (PET) plastic bottle wastes in bituminous asphaltic concrete. Cogent Engineering, 3(1): 1133480. https://doi.org/10.1080/23311916.2015.1133480
[13] Soltani, M., Moghaddam, T.B., Karim, M.R., Baaj, H. (2015). Analysis of fatigue properties of unmodified and polyethylene terephthalate modified asphalt mixtures using response surface methodology. Engineering Failure Analysis, 58: 238-248. https://doi.org/10.1016/j.engfailanal.2015.09.005
[14] Rangan, P.R., Tumpu, M., Mansyur, M. (2023). Marshall characteristics of quicklime and portland composite cement (PCC) as fillers in asphalt concrete binder course (ac-bc) mixture. In Annales de Chimie-Science des Matériaux. Lavoisier, 47(1): 51-55. https://doi.org/10.18280/acsm.470107
[15] Prasad, K.V.R., Mahendra, S.P., Kumar, N.S. (2015). Use of pet (polyethylene terephthalate) waste in bituminous road construction-a critical review. International Journal of Emerging Technologies and Engineering, 2(4): 96-99.
[16] Ahmadinia, E., Zargar, M., Karim, M.R., Abdelaziz, M., Ahmadinia, E. (2012). Performance evaluation of utilization of waste polyethylene terephthalate (PET) in stone mastic asphalt. Construction and Building Materials, 36: 984-989. https://doi.org/10.1016/j.conbuildmat.2012.06.015
[17] Taherkhani, H., Collop, A.C. (2008). Determination of the elastic modulus and poisson's ratio of asphaltic mixtures using uniaxial creep recovery tests. In Airfield and Highway Pavements: Efficient Pavements Supporting Transportation's Future. pp. 159-170.
[18] Lailunnazar, L., Wijayanti, W., Sasongko, M.N. (2013). Effect of pyrolysis temperature on the quality of tar pyrolysis results from mahogany sawdust. Thesis. Department of Mechanical Engineering, University of Brawijaya. In Indonesia.
[19] Nugraha, M.F., Wahyudi, A., Gunardi, I. (2013). Production of fuel from liquid pyrolysis results of polypropylene plastic through a reforming process with NiO/γ-Al2O3 catalyst. Journal of Engineering Pomits. In Indonesia, 2(2): 299-302.
[20] Tumpu, M., Parung, H. (2021). Volumetric characteristics of HRS-WC mixed using petroleum bitumen grade 60/70 as binder. In IOP Conference Series: Earth and Environmental Science. IOP Publishing, 921(1): 012069. http://doi.org/10.1088/1755-1315/921/1/012069
[21] Tumpu, M., Mabui, D.S. (2021). Influence of number of collisions towards asphalt emulsion mixture stability using marshall method (SNI 06-2489-1991). In IOP Conference Series: Earth and Environmental Science. IOP Publishing, 921(1): 012017. https://doi.org/10.1088/1755-1315/921/1/012017
[22] Tumpu, M., Gusty, S., Tjaronge, M.W., Parung, H. (2021). Permeability measurement of hot mix cold laid containing asbuton as porous asphalt. In IOP Conference Series: Earth and Environmental Science. IOP Publishing, 921(1): 012065. https://doi.org/10.1088/1755-1315/921/1/012065
[23] Parung, H., Tumpu, M., Tjaronge, M.W., Amiruddin, A.A., Walenna, M.A. (2023). Crack pattern of lightweight concrete under compression and tensile test. Annales de Chimie. Science des Materiaux, 47(1): 35–41. https://doi.org/10.18280/acsm.470105
[24] Cullity, B.D. (1956). Elements of X-Ray Diffraction. Second Edition: Addision-Wesley Publishing Company Inc.
[25] Fultz, B., Howe, J.M. (2012). Transmission Electron Microscopy and Diffractometry of Materials. Springer Science & Business Media.
[26] Tumpu, M., Tjaronge, M.W., Djamaluddin, A.R. (2020). Prediction of long-term volumetric parameters of asphalt concrete binder course mixture using artificial ageing test. In IOP Conference Series: Earth and Environmental Science. IOP Publishing, 419(1): 012058. https://doi.org/10.1088/1755-1315/419/1/012058
[27] Latief, R.U., Anditiaman, N.M., Rahim, I.R., Arifuddin, R., Tumpu, M. (2023). Labor productivity study in construction projects viewed from influence factors. Civil Engineering Journal, 9(3): 583-595. https://doi.org/10.28991/CEJ-2023-09-03-07
[28] Tumpu, M., Tjaronge, M.W., Djamaluddin, A.R., Amiruddin, A.A., One, L. (2020). Effect of limestone and buton granular asphalt (BGA) on density of asphalt concrete wearing course (AC-WC) mixture. In IOP Conference Series: Earth and Environmental Science. IOP Publishing, 419(1): 012029. https://doi.org/10.1088/1755-1315/419/1/012029
[29] Pasra, M., Tjaronge, M.W., Caronge, M.A., Djamaluddin, A.R., Lapian, F.E.P., Tumpu, M. (2022). Influence of tensile load on bonding strength of asphalt concrete containing modified buton asphalt and polyethylene terephthalate waste: A case study of indonesian roads. International Journal of Engineering, 35(9): 1779-1786. https://doi.org/10.5829/ije.2022.35.09C.14
[30] Rangan, P.R., Tumpu, M. (2023). Utilization of igneous rock as coarse aggregate in asphalt concrete binder course mixture. In IOP Conference Series: Earth and Environmental Science. IOP Publishing, 1134(1): 012005. https://doi.org/10.1088/1755-1315/1134/1/012005
[31] Tumpu, M., Rangan, P.R. (2023). Compressive strength characteristic of concrete using mountain sand. In IOP Conference Series: Earth and Environmental Science. IOP Publishing, 1134(1): 012046. https://doi.org/10.1088/1755-1315/1134/1/012046
[32] Abdullah, N.O., Tumpu, M. (2022). Utilization of solid waste PT semen bosowa as zeolite for industrial waste water in south sulawesi. In IOP Conference Series: Earth and Environmental Science. IOP Publishing, 1117(1): 012048. https://doi.org/10.1088/1755-1315/1117/1/012048