Kode Srividya![]() | Seelam Pichi Reddy
| Seelam Pichi Reddy![]() | Kurra Hari Prasad
| Kurra Hari Prasad![]() | Naga Sai Rama Krishna Thati
| Naga Sai Rama Krishna Thati![]() | Kilari Snehita | Unnam Sai Pranay
| Kilari Snehita | Unnam Sai Pranay![]() | Naga Venkata Sairam Yellapragada*
| Naga Venkata Sairam Yellapragada*![]()
© 2023 IIETA. This article is published by IIETA and is licensed under the CC BY 4.0 license (http://creativecommons.org/licenses/by/4.0/).
OPEN ACCESS
This work focuses on selection of optimal process parameters for the preparation of Lanthanum Hexa-aluminate (LHA) nanoparticles using chemical precipitation and filtration process. Multi response optimization is performed using Taguchi-GRA combinatorial approach using the process parameters such as Temperature (A), Time (B) and Composition (C). The results showed that % composition has the largest effect on hardness, while the Calcination Temperature is the most important factor in ultimate compression strength. In GRA analysis, the combined effect of hardness and ultimate compression strength is considered and the optimum combination is identified (A1B2C2). The percentage of the contribution was most important factor affecting hardness performance (36.58%). Based on the GRA results a regression equation is generated and optimized using ACO technique followed by preparation and characterization of powders. For the powders, prepared FESEM/EDS analysis were done and observed that average grain size of the particle is 85nm.
Taguchi method, grey relational analysis, regression analysis, XRD, FESEM
The International Union of Applied and Pure Chemistry (IUPAC) describes the rare earth elements as 15 forms of lanthanide elements, as well as yttrium and scandium. These elements of rare earths have partially occupied 4f orbitals, making them special magnetic, luminous, and strong materials [1, 2]. As the demand for Rare Earth Elements (RRE) is growing day by day so as the advancements of technology in various industries like electronics (silicon chips, long-life rechargeable batteries), Manufacturing like gas turbines, in Medical field like X-ray tubes, Technology (lasers, optical glass), and Renewable energy are just a few examples (Hybrid automobiles, biofuel catalysts) [3].
Out of all Lanthanum Hexa Aluminate is a magnetoplumbite structure based on Mg2+ ions substituting for Al3+ ions to achieve neutrality of ions which is fully occupied by La3+, giving the powder (La2O3-Al2O3) superior structural and thermo chemical stability [4, 5]. Few researchers proposed Lanthanum Hexa Aluminate as an upcoming material for Thermal Barrier Coatings (TBCs) that replace Yittria Zirconate (YSZ), which has used in TBCs, exhibited poor sintering at a temperature of more than 1200 degrees Celsius [6, 7]. La3+ cations diffusion with oxygen ions is suppressed to the crystallographic C axis hindering the sintering with more compaction, which makes its strong toward thermal stability. However, the production of Lanthanum Hexa-Aluminate nanoparticles is quite costly with high-energy consumption and safety issues [8, 9].
In the past few years, a lot of research has been done on how to make nano powders using the High-velocity oxygen fuel spraying, Physical vapor deposition, Plasma spraying, Atmospheric plasma spraying and Chemical precipitation and Filtration [10, 11]. Among these methods, chemical precipitation and filtration appear to be the traditional and simple method used for large-scale applications to increase material efficiency and it is economical to use [12, 13]. However, for the production of powders and from an economic point of view choosing the right parameters is a bigdeal for many researchers all over the world. In order to achieve the design criteria Taguchi L9 Orthogonal array is used for the present study. As Taguchi-Grey Relational Analysis is a type of Design of Experiments that is used to find the best parameters for each process level. These techniques decrease the number of experimental tests while saving time [14]. Researchers used these Combinatorial approaches for heat exchanger heat enhancement problems [15], electrical discharge machining [16] and used the combinatorial approach for optimal parameters for laser cladding with Lanthanum powder and Fe313 [17, 18].
Though the Taguchi-GRA technique is widely used for a variety of engineering problems, it is limited to the optimal value being presented in the form of an orthogonal matrix. The best process conditions derived from experimental design will have some restrictions in a wide range of applications [19]. As a result, a regression equation is generated to analyze varying levels in the orthogonal array. Several analytical methods have been adopted by various researchers to find local minima and global maxima parameters for regression equation solution. Out of all present work ACO technique is applied to optimize the global optimal parameters.
Out of all Ant Colony Optimization (ACO) is a vague optimization method based on the behaviour of ants searching for food in areas where their internal search mechanism is superior. Artificial ants in ACO are random procedures for constructing potential solutions to a problem. Researchers attempted a number of experiments using artificial phenomenon information that shifted based on the ant's search history. Many important research results have been discovered since the first ACO algorithm, the Ant system, was proposed. One of ACO's most notable achievements has been the use of algorithms to solve dynamic problems, whose properties change as they are solved. The first such application concerned routing in circuit-switched networks. There is less effort being put into improving ACO based on operators, representation, and fitness. Because Particle Swarm Optimization (PSO) has premature convergence for multi-complex peak search problems and Genetic Algorithms have a poor rate of convergence with local minimum parameters when problems are complex, ACO is preferred among the other computational techniques [20-22]. This paper going to take step forward on the critical examination for selection process parameters to prepare LHA powders based on ACO has been carried out.
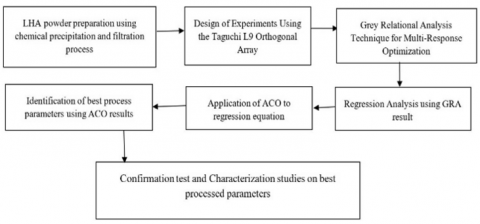
Methodology performed for the present work is depicted in Figure 1. In Section 2.1 materials and methods deals with the preparation of powders and relative procedures for selection of best parameters for powder preparation.
Figure 1. Research methodology performed for the preparation of LHA powders
2.1 Materials
Alumina powder, Lanthanum oxide, Aluminium Nitrate, Ammonium carbonate, and Citric acid are used in the current study. Lanthanum oxide was obtained from Mincometsal Pvt. Limited in Bengaluru, while high purity Alumina was obtained from Krish Met Tech Pvt. Limited in Chennai. Lanthanum oxide and Alumina with average particle sizes of 50µm are both considered in this study. National scientific products, Guntur, supplied the supporting chemicals such as aluminium nitrate, ammonium carbonate, and citric acid. Table 1 depicts the basic properties of materials used. LHA nanoparticles are synthesized using the stoichiometric reactions described by Yellapragada et al. [23] in their previous work.
2.2 Taguchi’s design of experiments (DOE)
Taguchi experimental design is a flexible way to figure out how different parameters affect output variables. The important part of the DOE is choosing the factors that affect the output readings. The present study of experimental design three factors at three levels are considered and depicted in the Table 2.
Table 1. Properties of materials
|
|
Density (g/cc) |
Size (µm) |
Melting point (℃) |
|
Alumina |
3.95 |
50 |
2072 |
|
Lanthanum oxide |
6.51 |
50 |
2315 |
|
Aluminium nitrate |
1.72 |
50 |
72.8 |
|
Ammonium carbonate |
1.5 |
50 |
58 |
Table 2. Lanthanum Hexa aluminate test levels and control factors
|
Controllable Factors |
Levels |
Units |
||
|
1 |
2 |
3 |
||
|
Composition percentage |
1:20 |
1:40 |
1:60 |
% |
|
Temperature |
750 |
900 |
1000 |
℃ |
|
Time |
1 |
2 |
3 |
Hrs |
With reference to L9 OA three levels are opted namely, temperature (A), time (B) and % of composition (C) [24]. Hardness and Ultimate Compressive Strength are the two output parameters considered for the present work (Table 3). The results of these tests are converted into signal-to-noise ratios (SNR) using Eq. (1) and Eq. (2) [25, 26].
“Higher-the-better”
$S / N_{S B}=-10 \log _{10}\left[\frac{1}{n} \sum_{i=1}^n\left(\frac{1}{y_i^2}\right)\right]$ (1)
“Smaller-the-Better”,
$S / N_{S B}=-10 \log _{10}\left[\frac{1}{n} \sum_{i=1}^n y_i^2\right]$ (2)
where, $n$ represents experimental runs (n=9) and $y$ represents output (y=2).
Table 3. Experimental design of L9 orthogonal array
|
Runs |
% of Composition |
Temperature |
Time |
Hardness (VHR) |
Ultimate compressive strength (N//mm2) |
|
1 |
1:20 |
750 |
1 |
151 |
12 |
|
2 |
1:20 |
900 |
2 |
164 |
5.5 |
|
3 |
1:20 |
1000 |
3 |
152 |
5.7 |
|
4 |
1:40 |
750 |
2 |
147 |
12 |
|
5 |
1:40 |
900 |
3 |
158 |
12 |
|
6 |
1:40 |
1000 |
1 |
142 |
12 |
|
7 |
1:60 |
750 |
3 |
145 |
12 |
|
8 |
1:60 |
900 |
1 |
159 |
12 |
|
9 |
1:60 |
1000 |
2 |
148 |
5.7 |
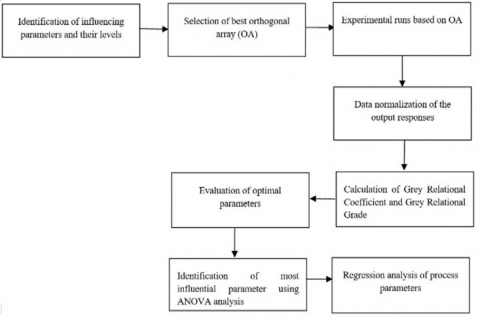
Figure 2. Procedure of grey relational analysis
2.3 Grey Relational Analysis (GRA)
Taguchi Technique is advantageous only when a single parameter effecting the system. In real life conditions, to optimize multiple parameters Taguchi technique is not beneficiary. To subdue this problem, combinatorial Taguchi-GRA technique is implemented. GRA analysis can also be used calculating rough data of machining, flank wear [27, 28]. The multi-response optimization of Lanthanum Hexa Aluminate powder is carried out using the GRA depicted in Figure 2. The ANOVA method describes the most important factor influencing the Lanthanum Hexa Aluminate strengthening effect.
Taguchi’s grey relational analysis procedure is applied to the two output responses namely, hardness and ultimate compressive strength. Figure 2 depicts the procedure for GRA analysis.
Step I: Calculate the signal-to-noise ratios.
Step II: Normalizing the data ratio for each controllable factors by Eq. (3) & Eq. (4) corresponding “Higher-the-Better” for Hardness and “Smaller-the-better” for Ultimate Compressive Strength: Higher the better,
$a_i(k)=\frac{a i(k)-\max a i(k)}{\max a i(k)-\min a i(k)}$ (3)
Smaller the better,
$a_i(k)=\frac{\max a i(k)-a i(k)}{\max a i(k)-\min a i(k)}$ (4)
where i=1, 2, …, 9 (runs) and k=number of responses, ai(k) is obtained value, max ai(k) is maximum value of ai(k) and min ai(k) is minimum value of ai(k).
Step III: Eq. (5) calculated the deviation coefficient for all process variables.
$\Delta o i=\left|x_o(k)-x_i(k)\right|$ (5)
where, $\Delta o i$ is the deviation sequence for the reference of $x_o(k)$ and the corresponding sequence $x_i(k)$.
Step IV: Grey relational coefficient is calculated for all process parameters using the following Eq. (6).
$\xi_i(k)=\frac{\Delta_{\min }+\Sigma \Delta_{\max }}{\Delta_{o i}(k)+\Sigma \Delta_{\max }}$ (6)
where, $\Sigma$ value is correspondingly 0.5.
Step V: The Grey Relational Grade is estimated by averaging the number of grey relational coefficient by following Eq. (7).
$\gamma_i=\frac{1}{n} \sum_{k=1}^n \xi_i(k)$ (7)
where, $\gamma_i$ value ranges from 0 to 1 and $\mathrm{n}$ is number of output responses.
2.4 Regression analysis
To develop the relationships between output variables, various techniques have been adapted by various researchers all over the world. Out of all multi regression technique is among them. To improve optimization using computational algorithms, linear regression is used to establish relationships between hardness and ultimate compressive strength parameters. The Linear regression looks like [29]:
$Z=a+b_1 Y_1+b_2 Y_2+\cdots+b_k Y_k$ (8)
where Z is the dependent variable to be estimated: Y1, Y2, ..., Yk are the known variables for which predictions are made, and a, b1, b2, ..., bk are the number of known least square values.
2.5 Ant Colony Optimization (ACO)
2.5.1 Formulation for ACO algorithm
In a methodical fashion, each ant employs a decision-making technique to progressively construct the solution, beginning at a node close to the original input. The data will be stored in each node so that the ants can read and select it in a probabilistic manner as they make their way from one to the next. A uniform distribution of pheromones is initially seeded across all zones in the search procedure [30, 31]. At the ith ant node, k follows a pheromone trail ρij to determine at random which node j will be chosen. Using Eq. (9) pheromone trail for each and every ant.
$p_{i j}^k(t)=\left\{\begin{array}{cc}\frac{\left[\tau_{i j}(t)\right]^\alpha\left[\eta_{i j}\right]^\beta}{\sum_{l \in J_k(i)}\left[\tau_{i l}(t)\right]^\alpha\left[\eta_{i l}\right]^\beta} & \text { if } j \in J_k(i) \\ 0 & \text { if } j \notin J_k(i)\end{array}\right.$ (9)
When ith node is considered Jk(i) will come under the neighborhood for k indicates the ant number. α indicates significance pheromone. The i, j are the adjacent nodes such that ant moves from i node to j.
2.5.2 Path retracing and pheromone updating
When ants move backwards to their source node, it eliminates loops while searching for a destination. It only scans. The longest loop can be eliminated in any order. When ant starts to return, the kth ant deposits Φρk of pheromones on areas it has covered. Eq. (10) depicts the Path updating. The ability to gradually lessen pheromone strength aids in the exploration of alternative routes for the entire process. To put it another way, it aids in the path selection process by decreasing the number of undesirable options. You can use it to boost your pheromone trail's value to unprecedented heights. When every ant of k is moved to next node pheromones tries to evaporate according to the following equation:
$\rho_{i j}=\rho_{i j}+\emptyset \rho^{\mathrm{k}}$ (10)
$\rho_{i j}=(1-e) \rho_{i j}+\sum_{K=1}^m \emptyset \rho_{x y}^k$ (11)
where ρ is the evaporation rate and $\Phi \rho_{x y}^k$ is the amount of pheromone.
To run the ACO algorithm, a MATLAB code is developed to predict the global optimal parameter.
3.1 Optimization using Taguchi
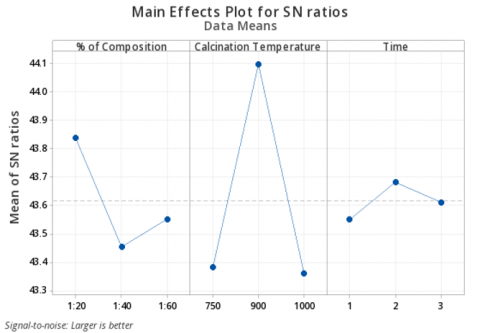
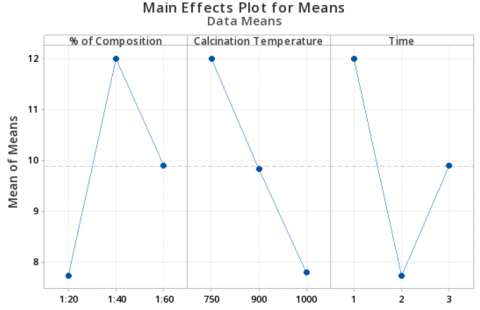
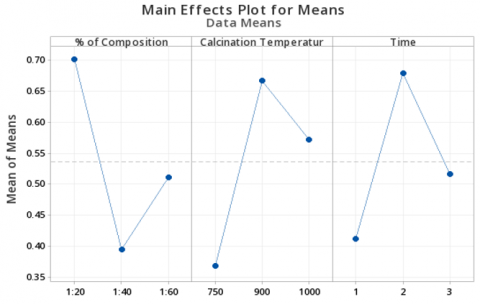
For the present study ultimate compressive strength is taken as smaller the better parameter and hardness is taken as larger the better parameter. So, the optimal parameters for the different parameters are as follows: For Hardness: A1 B2 C2-1:20% of composition, 900℃ Calcination Temperature, 2 hours of time whereas for Ultimate Compressive Strength: A2 B1 C1-1:40% of composition, 750℃ Calcination Temperature, 1 hours of time. Figure 3 depicts the Main effects plot for S/N ratio of hardness and Table 4 depicts the S/N ratio response table for hardness.
Table 4. S/N Ratio response table of hardness
|
Level |
% of Composition |
Temperature |
Time |
|
1 |
43.84 |
43.38 |
43.55 |
|
2 |
43.46 |
44.10 |
43.68 |
|
3 |
43.55 |
43.36 |
43.61 |
|
Delta |
0.38 |
0.74 |
0.13 |
|
Rank |
2 |
1 |
3 |
Table 5 shows the ANOVA analysis of hardness and ultimate compressive strength to obtain more percentage contributions for each parameter. Hardness Calcination Temperature has the largest percentage contribution to the parameter at 77.75%, followed by the percentage of composition at 17.46%.
The bold values in Table 6 denote the lowest S/N ratios. The combination of factors; % of Composition: A (Level 1 i.e., 1:20), Temperature: B (Level 3 i.e., 1000℃), Time: C (Level 2 i.e., 2 hours) gives minimum Ultimate Compressive Strength whereas Figure 4 shows the various wear residual plots that are analysed to determine the efficiency of the optimization process.
Figure 3. Main effects plot for S/N ratio of hardness
Figure 4. Main effects plot for S/N ratio of ultimate compressive strength
Table 5. ANOVA analysis of hardness
|
Source |
DFa |
SSb |
MSc |
F-Value |
P-Value |
Contribution (%) |
|
% of Composition |
2 |
0.23693 |
0.11846 |
6.13 |
0.140 |
17.47 |
|
Calcination Temp |
2 |
1.05429 |
0.52714 |
27.27 |
0.025 |
77.75 |
|
Time |
2 |
0.02607 |
0.01304 |
0.67 |
0.597 |
1.92 |
|
Error |
2 |
0.03866 |
0.01933 |
|
|
2.85 |
|
Total |
8 |
1.35594 |
|
|
|
100 |
|
S=0.1390, R2=97.15%, R2 adj=88.60% |
||||||
Table 6. S/N ratio response table of ultimate compressive strength
|
Level |
% of Composition |
Temperature |
Time |
|
1 |
17.17 |
21.58 |
21.58 |
|
2 |
21.58 |
19.32 |
17.17 |
|
3 |
19.43 |
17.27 |
19.43 |
|
Delta |
4.41 |
4.31 |
4.41 |
|
Rank |
1 |
2 |
3 |
Table 7 show the ANOVA analysis of ultimate compressive strength to obtain contributions for each parameter. Both % composition and time has equal percentage of contribution (33.84%) for Ultimate Compressive Strength.
3.2 Multi response optimization using GRA
Hardness and Ultimate Compressive Strength are two properties that exist together. As a result, they must be optimized concurrently. GRA was chosen for this purpose because it can reduce a multi-objective problem to a single-objective problem that can be optimized. Based on ANOVA results, there are different optimal parameters for each controllable factors, the multi-response optimization is needed. Elsen and Ramesh [32] and Nguyen et al. [33] validated that multi-response optimization is required to obtain local optimal parameters for the combined strengthening effect parameters of Hardness and Ultimate Compressive Strength.
3.2.1 Calculation of grey relational grade
Table 7 depicts the experimental responses of the L9 Orthogonal Array's uncontrollable factors. Because we require higher hardness and lower ultimate compressive strength, data normalisation is calculated using Eqs. (3) and (4). The deviation coefficient is calculated using the Eq. (5) based on the normalised data. After determining the corresponding deviation coefficient values, the Grey Relational Coefficient is calculated simultaneously using Eq. (6). Finally, the required Grey Relational Grade is obtained for all responses using Eq. (7), and the data formation is ranked to obtain the optimal powder parameter. Table 8 shows all of the Grey Relational Analysis data, from normalisation to Grey Relational Grade. Table 8's bold values indicate the run 2 which is having highest GRG.
3.2.2 ANOVA for grey relational grade
Table 9 depicts the GRG response table, The greater the GRG, the closer the quality of the product is to its ideal value. As a result, for optimal performance, a higher GRG is necessary. According to Agboola et al. [34], in ANOVA analysis, when the variation in the highest and lowest S/N ratios is small, it indicates that there is less effect on the response parameter. As a result, the design parameters level with the highest S/N ratio indicates the optimal LHA parameter.
Table 7. ANOVA analysis of ultimate compressive strength
|
Source |
DFa |
SSb |
MSc |
F-Value |
P-Value |
Contribution % |
|
% of Composition |
2 |
29.2326 |
14.6163 |
1366.71 |
0.001 |
33.84 |
|
Calcination Temp |
2 |
27.8953 |
13.9476 |
1304.18 |
0.001 |
32.29 |
|
Time |
2 |
29.2326 |
14.6163 |
1366.71 |
0.001 |
33.84 |
|
Error |
2 |
0.0214 |
0.0107 |
|
|
0.024 |
|
Total |
8 |
86.3819 |
|
|
|
100 |
|
S=0.1034, R2=99.98%, R2 adj=99.90% Adj SS - Adjacent Sum of square, Adj MS - Adjacent Mean squares |
||||||
Table 8. Grey relational analysis table for parameters
|
Runs |
Normalization |
Deviation Coefficient |
Grey Relational Coefficient |
Grey Relational Grade |
Rank |
|||
|
Hardness |
Ultimate Compressive Strength |
Hardness |
Ultimate Compressive Strength |
Hardness |
Ultimate Compressive Strength |
|||
|
1 |
0.409 |
0.000 |
0.591 |
1.000 |
0.458 |
0.333 |
0.396 |
6 |
|
2 |
1.000 |
1.000 |
0.000 |
0.000 |
1.000 |
1.000 |
1.000 |
1 |
|
3 |
0.455 |
0.969 |
0.545 |
0.031 |
0.478 |
0.942 |
0.710 |
2 |
|
4 |
0.227 |
0.000 |
0.773 |
1.000 |
0.393 |
0.333 |
0.363 |
7 |
|
5 |
0.727 |
0.000 |
0.273 |
1.000 |
0.647 |
0.333 |
0.490 |
5 |
|
6 |
0.000 |
0.000 |
1.000 |
1.000 |
0.333 |
0.333 |
0.333 |
9 |
|
7 |
0.136 |
0.000 |
0.864 |
1.000 |
0.367 |
0.333 |
0.350 |
8 |
|
8 |
0.773 |
0.000 |
0.227 |
1.000 |
0.688 |
0.333 |
0.510 |
4 |
|
9 |
0.273 |
0.969 |
0.727 |
0.031 |
0.407 |
0.942 |
0.675 |
3 |
Table 9. GRG response table
|
Level |
% of Composition |
Calcination Temperature |
Time |
|
1 |
0.7020 |
0.3697 |
0.4130 |
|
2 |
0.3953 |
0.6667 |
0.6793 |
|
3 |
0.5117 |
0.5727 |
0.5167 |
|
Delta |
0.3067 |
0.2970 |
0.2663 |
|
Rank |
1 |
3 |
2 |
Figure 5. Main effects of GRG on process parameters
Table 10 shows that the percentage of composition (36.58%) has the greatest influence on the performance of the powder's strengthening effect. For the powder parameters, the second most influential factor is Calcination Temperature (35.17%), followed by calcination time (27.51%).
According to Figure 5, the optimal condition for % of Composition (A), Calcination Temperature (B), and Time (C) is A1B2C2, with LHA parameters having higher hardness and lower ultimate compressive strength. Figure 5 depicts the various GRG plots that are analyzed in order to report the optimized parameters for determining the effectiveness of the LHA's strengthening effect.
3.2.3 Ant colony optimization for global optimization
The Taguchi and Grey Relationship Analysis were used to determine the conditions under which the optimum values could be found for the parameters that influence the amount of wear and the force of friction during dry sliding wear. Taguchi-GRA is helpful within the orthogonal array based on levels defined i.e., local maximization problems. But in real life problems we may or may not get the solution within the levels defined so to overcome this problem regression analysis has been on the combinatorial effect of Taguchi-GRA technique. A regression equation is generated using various sliding parameters followed by application of using Ant colony optimization technique to the regression equation developed.
Brociek et al. [29] and Zhang et al. [35] reported that Ant Colony Optimization (ACO) can be used in high-temperature applications such as heat and thermal transfer. However, very few studies on Lanthanum Hexa Aluminate in high-temperature applications in Thermal Barrier Coatings have been conducted (TBCs). Using regression analysis a gives the relation between variables that are effecting the process.
Objective function $=-0.176-0.00476$* % of composition $+0.000904 *$ Temperature $+0.0518 *$ Time (12)
Equation (12) is generated based on GRG results using Minitab 20 software followed by considering the equation as fitness function to optimize the global parameters. A MATLAB code is generated to run the ACO algorithm to solve this fitness function for 5000 ants. The optimal value obtained is 1:20 % of composition, 900 Calcination Temperature and 2 hour of heat time.
3.3 Confirmation tests and characterization studies of optimum parameters
3.3.1 The confirmation test
A confirmation test was performed to validate experimental results based on the discovery of optimal parameters influencing multiple responses. Eq. (13) is used to calculate the projected GRG. Table 9 shows that the expected and experimental results for the Taguchi-GRA Analysis and ACO method are nearly identical. As a result, the study was completed satisfactorily.
$\hat{z}=z_m+\sum_{i=1}^q\left(\bar{z}_l-z_m\right)$ (13)
where, $\hat{z}$ means predicted grey relation grade, $z_m$ means average value of GRG, $z_i$ GRG at optimum levels and q equals to number of factors.
Table 10. ANOVA for GRG values
|
Source |
DFa |
SSb |
MSc |
F-Value |
P-Value |
Contribution % |
|
% of Composition |
2 |
0.143805 |
0.071902 |
51.02 |
0.019 |
36.58 |
|
Calcination Temperature |
2 |
0.138254 |
0.069127 |
49.05 |
0.020 |
35.17 |
|
Time |
2 |
0.108141 |
0.054070 |
38.37 |
0.025 |
27.51 |
|
Error |
2 |
0.002819 |
0.001409 |
|
|
0.71 |
|
Total |
8 |
0.393018 |
|
|
|
100 |
|
S=0.1390, R2=97.15%, R2 adj=99.90% |
||||||
According to Table 10, the measured GRG values for the optimal combination level in the Taguchi-GRA Method are 0.522 and 0.539, respectively. The optimum experimental circumstances were examined and closely matched to projected values within a 3.15% margin of error. Similarly, the anticipated value in the ACO method is 0.621 and the experimental result is 0.590, with a margin of error of 4.19%. Table 11. shows the confirmation test readings. As both expected and experimental values are nearly identical, the Grey relational technique is useful for optimizing process parameters when multiple parameters are to be studied at the same time [36-38].
Table 11. Confirmation test readings
|
|
Best Parameters |
|
|
|
Expected |
Experimental |
Error % |
|
|
Using Taguchi-GRA Technique |
A1 B2 C2 0.539 |
A1 B2 C2 0.522 |
3.15 |
|
Using ACO technique |
A1 B2 C2 0.621 |
A1 B2 C2 0.590 |
4.19 |
3.3.2 Morphological studies
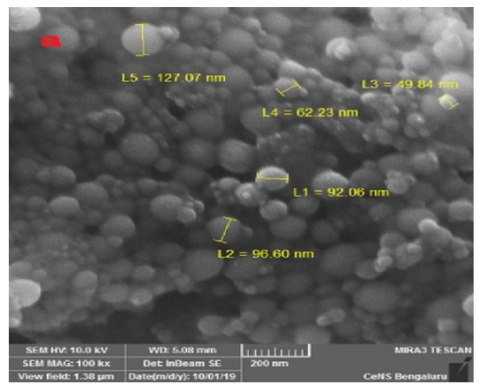
Figure 6 shows that the process used here is successful in producing nano-sized particles that are almost identical in size and form. According to FESEM examination, the particle sizes of spherical shaped LHA nanoparticles ranged from 49.84 to 127 nm, with a mean particle size of 85 nm.
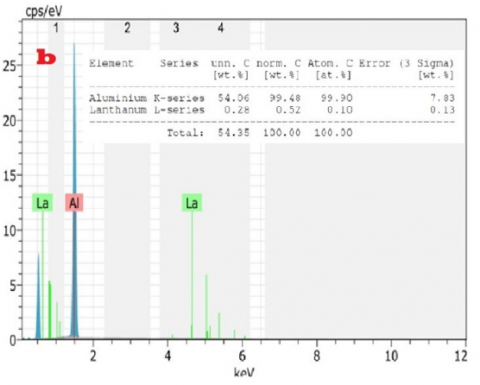
Figure 6(b) depicts the EDS examination of the manufactured powder, which revealed that the sample is largely composed of aluminium and lanthanum, revealing the process's primary constituent materials. These prepared powders can be used as reinforce materials in soft matrix like magnesium [39].
(a)
(b)
Figure 6. (a) FESEM (b) EDS analysis of prepared powders
Lanthanum Hexa Aluminate ranging from 20 to 60% at 20% volume LHA interval is produced using a chemical precipitation and filtration technique in three different composites. The results show that the increasing strengthening effect of LHA increases with higher temperatures.
•The process parameters with multi-response characteristics were effectively optimized using combinatorial Taguchi-GRA techniques. The A1 B2 C2 combination (i.e., A-% of Composition=1:20, B-Calcination Temperature=900℃, C-Calcination Time=2 hours) was discovered to have the optimal value of process parameters responsible for high hardness and low ultimate compressive strength for local optimum parameter.
•In GRA analysis, the combined effect of hardness and ultimate compression strength is considered and the optimum combination is identified (A1B2C2). The percent of the contribution of % composition (36.58%) was recognized to be the most important factor influencing performance to hardness.
•ANOVA (Analysis of Variance) found that percentage of Composition and Time of Calcination significantly contributed to performance of wear, among the other parameters compared were non-significant.
•Ant Colony Optimization (ACO) is performed for Global optimization of parameters. The A1 B2 C2 combination (i.e., A-% of Composition=1:20, B-Calcination Temperature=900℃, C - Calcination Time=2 hour).
•The FESEM pictures show that LHA nanoparticles had the same morphology with an average particle size of 85 nm.
•Since LHA is a new material with a lot of potential in high-temperature applications and thermal barrier coatings, making LHA at the nano level. Therefore, selection parameter studies will have exceptional significance at the industrial level.
[1] Jowitt, S.M., Werner, T.T., Weng, Z., Mudd, G.M. (2018). Recycling of the rare earth elements. Current Opinion in Green and Sustainable Chemistry, 13: 1-7. https://doi.org/10.1016/j.cogsc.2018.02.008
[2] Massari, S., Ruberti, M. (2013). Rare earth elements as critical raw materials: Focus on international markets and future strategies. Resources Policy, 38(1): 36-43. https://doi.org/10.1016/j.resourpol.2012.07.001
[3] Balaram, V. (2019). Rare earth elements: A review of applications, occurrence, exploration, analysis, recycling, and environmental impact. Geoscience Frontiers, 10(4): 1285-1303. https://doi.org/10.1016/j.gsf.2018.12.005
[4] Iyi, N., Inoue, Z., Takekawa, S., Kimura, S. (1984). The crystal structure of lanthanum hexaaluminate. Journal of Solid State Chemistry, 54(1): 70-77. https://doi.org/10.1016/0022-4596(84)90132-4
[5] Friedrich, C., Gadow, R., Schirmer, T. (2001). Lanthanum hexaaluminate—a new material for atmospheric plasma spraying of advanced thermal barrier coatings. Journal of Thermal Spray Technology, 10: 592-598. https://doi.org/10.1361/105996301770349105
[6] Sun, J., Wang, J., Dong, S., Hui, Y., Li, L., Deng, L., Jiang, J., Zhou, X., Cao, X. (2018). Effect of heat treatment on microstructure and property of plasma-sprayed lanthanum hexaaluminate coating. Journal of Alloys and Compounds, 739: 856-865. https://doi.org/10.1016/j.jallcom.2017.12.347
[7] Sekar, A., Muruganandhan, R. (2021). Effect of synthesis technique on developing lanthanum magnesium hexaaluminate powders as an alternative for thermal barrier coating. Ceramics International, 47(14): 19567-19574. https://doi.org/10.1016/j.ceramint.2021.03.294
[8] Rao, R.R., Mariappan, L. (2005). Combustion synthesis and characterisation of lanthanum hexa-aluminate. Advances in Applied Ceramics, 104(5): 268-271. https://doi.org/10.1179/174367605X62427
[9] Bohre, A., Hočevar, B., Grilc, M., Likozar, B. (2019). Selective catalytic decarboxylation of biomass-derived carboxylic acids to bio-based methacrylic acid over hexaaluminate catalysts. Applied Catalysis B: Environmental, 256: 117889. https://doi.org/10.1016/j.apcatb.2019.117889
[10] Gadow, R., Lischka, M. (2002). Lanthanum hexaaluminate—novel thermal barrier coatings for gas turbine applications—materials and process development. Surface and Coatings Technology, 151: 392-399. https://doi.org/10.1016/S0257-8972(01)01642-5
[11] Ram, Y.S., Tarasasanka, C., Prabakaran, J. (2021). Preparation and characterization of lanthanum hexa aluminate powders for high temperature applications. Materials Today: Proceedings, 39: 1472-1475. https://doi.org/10.1016/j.matpr.2020.05.368
[12] Chen, S., Hu, J., Han, S., Guo, Y., Belzile, N., Deng, T. (2020). A review on emerging composite materials for cesium adsorption and environmental remediation on the latest decade. Separation and Purification Technology, 251: 117340. https://doi.org/10.1016/j.seppur.2020.117340
[13] Lei, Z., Li, X., Huang, P., Hu, H., Li, Z., Zhang, Q. (2019). Mechanochemical activation of antigorite to provide active magnesium for precipitating cesium from the existences of potassium and sodium. Applied Clay Science, 168: 223-229. https://doi.org/10.1016/j.clay.2018.11.015
[14] Muthu Chozha Rajan, B., Senthil Kumar, A., Sornakumar, T., Senthamaraikannan, P., Sanjay, M.R. (2019). Multi response optimization of fabrication parameters of carbon fiber-reinforced aluminium laminates (CARAL): by Taguchi method and gray relational analysis. Polymer Composites, 40(S2): E1041-E1048. https://doi.org/10.1002/pc.24815
[15] Celik, N., Pusat, G., Turgut, E. (2018). Application of Taguchi method and grey relational analysis on a turbulated heat exchanger. International Journal of Thermal Sciences, 124: 85-97. https://doi.org/10.1016/j.ijthermalsci.2017.10.007
[16] Bagherian Azhiri, R., Teimouri, R., Ghasemi Baboly, M., Leseman, Z. (2014). Application of Taguchi, ANFIS and grey relational analysis for studying, modeling and optimization of wire EDM process while using gaseous media. The International Journal of Advanced Manufacturing Technology, 71: 279-295. https://doi.org/10.1007/s00170-013-5467-y
[17] Shanmugarajan, B., Shrivastava, R., Sathiya, P., Buvanashekaran, G. (2016). Optimisation of laser welding parameters for welding of P92 material using Taguchi based grey relational analysis. Defence Technology, 12(4): 343-350. https://doi.org/10.1016/j.dt.2016.04.001
[18] Yu, T., Yang, L., Zhao, Y., Sun, J., Li, B. (2018). Experimental research and multi-response multi-parameter optimization of laser cladding Fe313. Optics & Laser Technology, 108: 321-332. https://doi.org/10.1016/j.optlastec.2018.06.030
[19] Jani, S.P., Kumar, A.S., Khan, M.A., Jose, A.S. (2021). Design and optimization of unit production cost for AWJ process on machining hybrid natural fibre composite material. International Journal of Lightweight Materials and Manufacture, 4(4): 491-497. https://doi.org/10.1016/j.ijlmm.2021.07.002
[20] Ding, S., Su, C., Yu, J. (2011). An optimizing BP neural network algorithm based on genetic algorithm. Artificial Intelligence Review, 36: 153-162. https://doi.org/10.1007/s10462-011-9208-z
[21] Sebaey, T.A., Lopes, C.S., Blanco, N., Costa, J. (2011). Ant colony optimization for dispersed laminated composite panels under biaxial loading. Composite Structures, 94(1): 31-36. https://doi.org/10.1016/j.compstruct.2011.07.021
[22] Sankar, B.R., Umamaheswarrao, P. (2018). Multi objective optimization of CFRP composite drilling using ant colony algorithm. Materials Today: Proceedings, 5(2): 4855-4860. https://doi.org/10.1016/j.matpr.2017.12.061
[23] Yellapragada, N.V.S.R., Cherukuri, T.S., Jayaraman, P., Devarakonda, S.K. (2021). Estimation of lattice strain in lanthanum hexa aluminate nanoparticles using X-ray peak profile analysis. Revue des Composites et des Matériaux Avancés, 31(1): 13-19. https://doi.org/10.18280/rcma.310102
[24] Ram, Y.S., Sasanka, C.T., Prabakaran, J. (2021). Application of MADM methods for the synthesis of alumina/lanthanum hexa-aluminate powders by chemical precipitation and filtration method. In IOP Conference Series: Materials Science and Engineering, 1185(1): 012001 https://doi.org/10.1088/1757-899X/1185/1/012001
[25] Liu, J., Wu, M., Yang, Y., Yang, G., Yan, H., Jiang, K. (2018). Preparation and mechanical performance of graphene platelet reinforced titanium nanocomposites for high temperature applications. Journal of Alloys and Compounds, 765: 1111-1118. https://doi.org/10.1016/j.jallcom.2018.06.148
[26] Siddhartha, Patnaik, A., Bhatt, A.D. (2011). Mechanical and dry sliding wear characterization of epoxy–TiO2 particulate filled functionally graded composites materials using Taguchi design of experiment. Materials & Design, 32(2): 615-627. https://doi.org/10.1016/j.matdes.2010.08.011
[27] Mitra, A. (2011). The Taguchi method. Wiley Interdisciplinary Reviews: Computational Statistics, 3(5): 472-480. https://doi.org/10.1002/wics.169
[28] Sarıkaya, M., Yılmaz, V., Dilipak, H. (2016). Modeling and multi-response optimization of milling characteristics based on Taguchi and gray relational analysis. Proceedings of the Institution of Mechanical Engineers, Part B: Journal of Engineering Manufacture, 230(6): 1049-1065. https://doi.org/10.1177/0954405414565136
[29] Brociek, R., Chmielowska, A., Słota, D. (2020). Comparison of the probabilistic ant colony optimization algorithm and some iteration method in application for solving the inverse problem on model with the caputo type fractional derivative. Entropy, 22(5): 555. https://doi.org/10.3390/e22050555
[30] Gowthaman, K., Saiganesh, J., Rajamanikam, C.S. (2013). Determination of submerged arc welding process parameters using Taguchi method and regression analysis. In 2013 International Conference on Energy Efficient Technologies for Sustainability, Nagercoil, India, pp. 842-847. https://doi.org/10.1109/ICEETS.2013.6533495
[31] Seçkiner, S.U., Eroğlu, Y., Emrullah, M., Dereli, T. (2013). Ant colony optimization for continuous functions by using novel pheromone updating. Applied Mathematics and Computation, 219(9): 4163-4175. https://doi.org/10.1016/j.amc.2012.10.097
[32] Elsen, S.R., Ramesh, T. (2015). Optimization to develop multiple response hardness and compressive strength of zirconia reinforced alumina by using RSM and GRA. International Journal of Refractory Metals and Hard Materials, 52: 159-164. https://doi.org/10.1016/j.ijrmhm.2015.06.007
[33] Nguyen, T.T., Cao, L.H., Nguyen, T.A., Dang, X.P. (2020). Multi-response optimization of the roller burnishing process in terms of energy consumption and product quality. Journal of Cleaner Production, 245: 119328. https://doi.org/10.1016/j.jclepro.2019.119328
[34] Agboola, O.O., Ikubanni, P.P., Adeleke, A.A., Adediran, A.A., Adesina, O.S., Aliyu, S.J., Olabamiji, T.S. (2020). Optimization of heat treatment parameters of medium carbon steel quenched in different media using Taguchi method and grey relational analysis. Heliyon, 6(7): e04444. https://doi.org/10.1016/j.heliyon.2020.e04444
[35] Zhang, B., Qi, H., Ren, Y.T., Sun, S.C., Ruan, L.M. (2013). Application of homogenous continuous Ant Colony Optimization algorithm to inverse problem of one-dimensional coupled radiation and conduction heat transfer. International Journal of Heat and Mass Transfer, 66: 507-516. https://doi.org/10.1016/j.ijheatmasstransfer.2013.07.054
[36] Dorigo, M., Stützle, T. (2019). Ant colony optimization: Overview and recent advances. In: Gendreau, M., Potvin, JY. (eds) Handbook of Metaheuristics. International Series in Operations Research & Management Science, vol 272. Springer, Cham. https://doi.org/10.1007/978-3-319-91086-4_10
[37] Ashok kumar, U., Laxminarayana, P. (2018). Optimization of electrode tool wear in micro holes machining by die sinker EDM using Taguchi approach. Materials Today: Proceedings, 5(1): 1824-1831. https://doi.org/10.1016/j.matpr.2017.11.281
[38] Ynv, S.R., Tara Sasanka, C., Prabakaran, J. (2022). Optimization of dry-sliding wear parameters on lanthanum hexa aluminate reinforced magnesium AZ91E composites using grey relation analysis. In Nano Hybrids and Composites, 35: 55-73. https://doi.org/10.4028/p-08w7lk
[39] Yellapragada, N.V.S.R., Cherukuri, T.S., Jayaraman, P. (2022). Mechanical and tribological studies on AZ91E magnesium alloy reinforced with lanthanum hexa-aluminate nanoparticles. Arabian Journal for Science and Engineering, 47: 15989-16000. https://doi.org/10.1007/s13369-022-06780-y