Kribaa O. Keltoum* | Louiza Zenkhri | Ahmed Boutarfaia
© 2022 IIETA. This article is published by IIETA and is licensed under the CC BY 4.0 license (http://creativecommons.org/licenses/by/4.0/).
OPEN ACCESS
The main objective of this work is the synthesis, structural and morphological characterization of ceramics materials. Abbreviated PZT-PYN. Ferroelectric ceramics of general formulation Pb(ZrxTi1-x)O3 are massively used in many fields such as medicine or aeronautics because of their dielectric and electromechanical properties, although the electronic properties of doped PZT are much better compared to undoped PZT. Samples selected for this study were prepared bins solid way. The thermal treatment called calcination was applied to these compositions is carried around: 450℃, 550℃, 650℃, 750℃, and 900℃ for two hours with a Vitesse of 2℃ / min., then sintered at different temperatures: 1100℃, 1150℃, 1180℃, successively to optimize the sintering temperature where the product is better physical quality. Different techniques of characterization were used such as scanning electron microscopy (SEM), x-ray diffraction (XRD) analysis, and Energy-dispersive spectrometric, which showed that the response is optimal for the compositions included in the morphotropic phase boundary, achieves excellent properties.
materials, sintering, calcination, compositions, ceramics, X-rays diffraction
Lead zirconatetitanate is carefully designed because of its better properties, as well known [1, 2], and is widely used in the electronics industry because of its piezoelectric properties. Various means, such as transducers and integrated circuits for microelectronic applications use this type of ceramic [3]. This material has been the subject of extensive studies since the miscibility of lead titanate and zirconate was discovered in 1950 [4]. Lead zirconatetitanate (PZT) is known with perovskite structure (ABO3) in which A-site is busy by the Pb2+ ions and the B site by Zr4+ and/or Ti4+ions [5]. The addition of different dopants in the matrix (PZT) is the way to improve the different properties, to synthesize new ceramic materials for better applications. for these reasons, many researchers have studied the composition of PZT modified by substitution at sites A and B [6-8], use dopants to improve the electrical and mechanical properties of ceramic materials. The properties of the PZT samples are related to the nature of dopants, composition, and the method of synthesis [9]. Various methods are used to locate the compositions corresponding to the morphotropic phase boundary of PZT-type ceramics and its derivatives (addition of dopants), among which: X-ray diffraction analysis [10, 11]. The theoretical thermodynamic analysis [12, 13]. Measurements of dielectric and piezoelectric properties [14-16].
In the present work, PYN–PZ–PT ceramics have been prepared by using the solid-state reaction method. The structural, morphological, and spectroscopic properties have been investigated and well discussed.
2.1 Starting products
The starting products were basic oxides and were commercial powders: PbO (99% Biochem), ZrO2 (99% Biochem), TiO2 (99% Biochem), Y2O3 (99.6% Alfa Aesor), NiO (99.6% Stream chemical). Titanium Dioxide TiO2: is a white amorphous powder with a melting point of 2000℃. Rutile TiO2 has a quadratic structure and crystal lattice parameters a = 4.59 Å and c = 2.96 Å. Zirconium Oxide ZrO2: with good hardness, good resistance to thermal shock and corrosion, low thermal conductivity and a low coefficient of friction. The mesh is monoclinic with crystal lattice parameters a = 5.14 Å, b = 5.20 Å and c = 5.21 Å, ß = 80.45°. Its melting point is 2700℃. Lead monoxide PbO: is a yellow or red crystalline powder obtained by heating lead in the presence of air with an orthorhombic structure (a = 5.489 Å, b = 4.755 Å, c = 5.891 Å) or quadratic red solid (a = 3.9729 Å, c = 5.0192 Å), and which has a melting temperature of 888℃. There is a transition from red oxide to yellow at 587℃, has a molecular weight of 223.20 g/mol and a density of 9.53 g/ml. The compound is not very soluble in water, insoluble in alcohol. The compound is a weak oxidizing or reducing agent. Nickel oxide NiO: crystallizes in the NaCl type structure. It is obtained by the pyrolysis of divalent nickel compounds such as Ni(OH)2, Ni(NO3)2 or NiCO3. NiO is non-stoichiometric (the Ni/O ratio is slightly different from 1) a= 424 pm., mesh volume: V = 7.62 10-29 m3. Its melting temperature is approximately 2852℃ [17-22].
2.2 Development
The raw materials are oxid: PbO, ZrO2, and TiO2. An ideal powder can be described as being formed from small grains, mixing and grinding are essential steps in the manufacturing cycle, it is also during this operation that a uniform distribution of the precursors is obtained [23].
The powders are weighed according to the stoichiometric quantities provided by the reaction equation.
Pb [(Zr0.52, Ti0.48)1-x, x(Y1/2, Ni1/2)]O3 powders are mixed in an acetone medium for four hours using a magnetic stirrer to obtain a homogeneous mixture [24]. The mixture is then dried for two hours at 90℃ in an oven. The grinding is done in a glass mortar for six hours. The powder obtained then undergoes a first heat treatment called calcination. It can take place in different atmospheres [25].
The heat treatment is carried out from 450℃ to 900℃ for two hours in a programmable oven (Nabertherm) with a temperature rise slope of 2℃ / min.
Regrinding: After the heat treatment, the powder is reground introduces the grains’ size, to homogeneity and to hemease its reactivity.
The particle size of the powder is an essential parameter for the materials morphology study, the grains must be quite fine for practical reasons: to facilitate the homogeneous melting of all the material, to avoid a strong retention of air in the material and finally, to prevent the grains from sticking to each other, except on the surface. The average particle size in our ceramic materials is reduced after heat treatment (calcination) as shown in Table 1:
Table 1. The average particle size
|
The starting products |
D (0.5) µm |
|
TiO2 |
24.293 |
|
ZrO2 |
14.723 |
|
PbO |
37.533 |
|
PZT powder |
D (0.5) µm |
|
PZT calcined at 450℃ |
0.180 |
|
PZT calcined at 550℃ |
0.173 |
|
PZT calcined at 750℃ |
0.172 |
|
PZT calcined at 900℃ |
0.171 |
The powder is then subjected to a heat treatment at a high temperature (1100,1150 and 1180℃) to obtain the desired phases [26]. In order to obtain a denser product (At these temperatures, we have the highest density values, which leads to the most compact structure) with better physical quality.
Table 2. Matrix for each composition
|
Sample |
Matrix |
doping rate |
|
S1 |
Pb [(Zr0.52,Ti0.48)1-0.01,0.01(Y1/2, Ni1/2)]O3 |
1% |
|
S2 |
Pb[(Zr0.52,Ti0.48)1-0.03,0.03(Y1/2, Ni1/2)]O3 |
3% |
|
S3 |
Pb [(Zr0.52,Ti0.48)1-0.05,0.05(Y1/2, Ni1/2)]O3 |
5% |
|
S4 |
Pb [(Zr0.52,Ti0.48)1-0..07,0.07(Y1/2, Ni1/2)]O3 |
7% |
|
S5 |
Pb [(Zr0.52,Ti0.48)1-0.1,0.10(Y1/2, Ni1/2)]O3 |
10% |
The crystalline phases analysis of the powders was carried out on X-ray diffraction θ/2θ Siemens D 5000 diffractometer. The diffractograms were acquired with Kα radiation from copper on and counting times between 2 and 10 s. The samples analyzed are presented in the form of powders. The device used is from mark RIGAKU MINIFLEX 600 (Table 2).
FT-IR spectroscopy was carried out by Shimadzu FTIR-8400S. Sample preparation consisted of mixing 0.001g of PZT powder with 0.2g of potassium bromide (KBr), compressed to form a tablet and then placed on the specimen holder to be analyzed at a range of 400 to 4000 cm-1 at 4 cm-1 resolution.
Energy dispersive x-ray systems are often attachments to scanning electron microscopy instruments. Typically scanning electron microscopy provides the visual analysis and energy dispersive x-ray provides the elemental analysis for this characterization, samples were prepared in discs. For doing 0.45g of the material powder was pressed using a Specac hydraulic press with a load pressure of 2.5 tons.
3.1 X-ray diffraction (XRD)
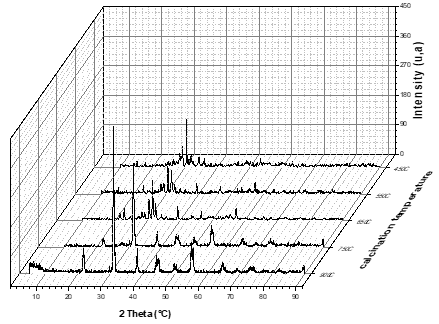
X-ray diffraction results for powderS3: Pb [(Zr0.52,Ti0.48)1-0.05,0.05(Y1/2, Ni1/2)]O3 calcined at different temperatures are shown in Figure 1.
Figure 1. X-ray diffraction diagram of the calcined powder (S3)
The existing phases obtained in the diffractograms of X-ray diffraction were followed by their characteristic peak of intensity in the A.S.T.M.
|
Pattern List |
||
|
450℃ |
||
|
Ref.Code |
Compound Name |
Chem. Formula |
|
98-006-2842 |
Litharge |
PbO |
|
98-000-9754 |
Minimu |
Pb3O4 |
|
98-016-4736 |
Zirconium Oxide |
ZrO2 |
|
98-004-0180 |
Massicot |
PbO |
|
550℃ |
||
|
Ref.Code |
Compound Name |
Chem. Formula |
|
98-002-9117 |
Macedonite |
PbTiO3 |
|
98-006-0135 |
Massicot |
PbO |
|
98-006-2845 |
Litharge |
PbO |
|
98-009-4566 |
Anatase, nanocrystal. |
TiO2 |
|
98-009-2091 |
Zirconia (nanocrystal) |
ZrO2 |
|
650℃ |
||
|
Ref.Code |
Compound Name |
Chem. Formula |
|
98-016-5498 |
Lead Titanate |
PbTiO3 |
|
98-008-7587 |
Lead Zirconate |
PbZrO3 |
|
98-006-0900 |
Baddeleyite |
ZrO2 |
|
98-007-7648 |
Lead(IV) Oxide |
PbO2 |
|
98-065-7748 |
Titanium Oxide |
TiO2 |
|
750℃ |
||
|
Ref.Code |
Compound Name |
Chem. Formula |
|
98-024-6571 |
Lead Zirconium Titanate |
PbTi0.48 Zr0.52O3 |
|
98-016-2044 |
Lead Titanate |
PbTiO3 |
|
98-006-2845 |
Litharge |
PbO |
|
98-004-0180 |
Massicot |
PbO |
|
98-009-3126 |
Zirconia |
ZrO2 |
|
98-009-7282 |
Minium |
Pb3O4 |
|
98-008-7587 |
Lead Zirconate |
PbZrO3 |
|
98-006-9331 |
Rutile |
TiO2 |
|
900℃ |
||
|
Ref.Code |
Compound Name |
Chem. Formula |
|
98-024-6570 |
Lead Zirconium Titanate |
PbTi0.48 Zr0.52 O3 |
The results obtained admit the formation of PbTiO3 begins from 550℃ and that of PbZrO3 from 650℃ while the appearance of the PZT solid solution from 750℃ with the persistence of the base oxides, whereas at a temperature of 900℃, the stabilization of PZT solid solution is noted without base oxides or intermediate products.
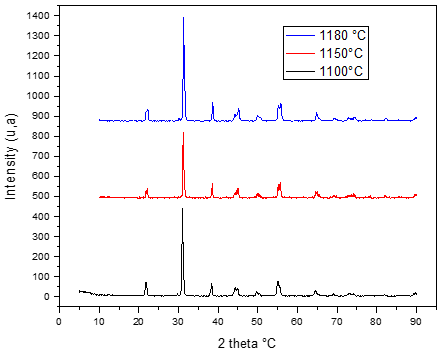
Figure 2. X-ray diffraction diagram of the sintered powder (S3)
From the diagrams in Figure 2, we derive the following information:
At T=1100℃
Ref.Code Compound Name Chem. Formula
98-009-7059 Lead Zirconium Titanate PbTi0.48 Zr0.52 O3
Relevant parameters of Lead Zirconium Titanium Oxid
Density (calculated)/ g/cm3:8,0045
Space group (No.): P 4 mm (99)
Lattice parameters: a/ Å: 4,043000 b/ Å 4,043000
c/ Å: 4,132000, alpha/°: 90 beta/°: 90 gamma/°: 90
V/ 106 pm3: 67,54105
At T=1150℃
Pattern List
Ref.Code Compound Name Chem. Formula
98-009-7060 Lead Zirconium Titanate PbTi0.48Zr0.52O3
98-007-5312 Zirconium Yttrium Zr0.84Y0.16O1.92
Relevant parameters of Lead Zirconium Titanium Oxide
Density (calculated)/ g/cm3: 8,0835
Space group (No.): P 4 mm (99)
Lattice parameters: a/ Å: 4,017000b/ Å: 4,017000 c/ Å: 4,142000, alpha/°: 90 beta/°: 90 gamma/°: 90V/ 106pm3: 66,83652
Formula sum: Zr0.84Y0.16 O1.92
Density (calculated)/ g/cm3: 5,9427
Space group (No.): P 42/n m c (137)
Lattice parameters: a/ Å: 3,635000b/ Å: 3,635000 c/ Å: 5,141000 alpha/ °: 90 beta/ °:90gamma/ °: 90V/ 106 pm3: 67,92919
At T=1180℃
Pattern List
Ref.Code Compound Name Chem. Formula
98-024-6569 Lead Zirconium Titanate PbTi0.48 Zr0.52 O3
Relevant parameters of Lead Zirconium Titanium Oxide
Density (calculated)/ g/cm3 8,0918
Space group (No.): P 4 mm (99)
Lattice parameters: a/ Å: 4,030(7 b/ Å: 4,030(7 c/ Å: 4,110(8) alpha/ °: 90 beta/ °: 9 gamma/ °: 90 V/ 106 pm3: 66,76814
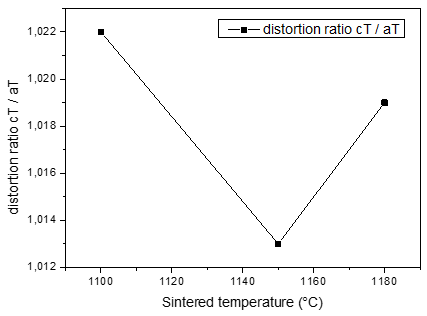
The structure of PZT-YN (Pb [(Zr0.52,Ti0.48)1-0.05,0.05(Y1/2, Ni1/2)]O3) studied is stable, this stability is due to the reduction of the distortion ratio CT/aT from the sintering temperature 1100℃ to the optimum temperature 1150℃ (Figure 3).
Figure 3. Evolution of the distortion ratio of the “S3” sample as a function of the sintering temperature
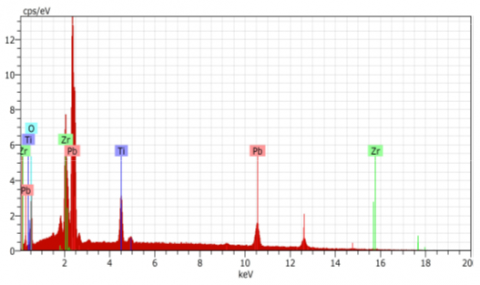
3.2 Energy dispersive spectrometric analysis (EDS)
This analysis allows the identification of the elements constituting our ceramic as well as the observation or not of secondary phases. The analysis results for the samples are shown in Figures 4 and 5.
Figure 4. EDS spectrum for composition S3 calcined at 900℃
Figure 5. EDS spectrum for composition S3 sinter at 1180℃
We can observe the peaks detecting main elements of "Pb, Zr, Ti, O" for the two samples with an excess of Pb. As regards the dopants, the device could not detect them. The cause may be the low rate. The absence of the peaks representing the impurities was also observed for the two samples. This observation is confirmed by the phase diagrams analyzed by X-rays and by the photographs taken by the scanning electron microscope.
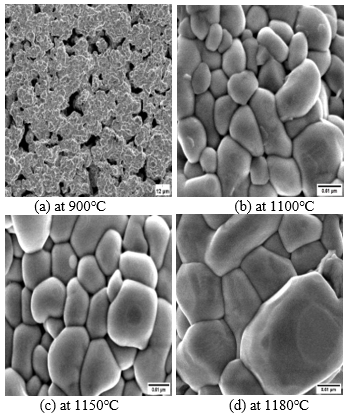
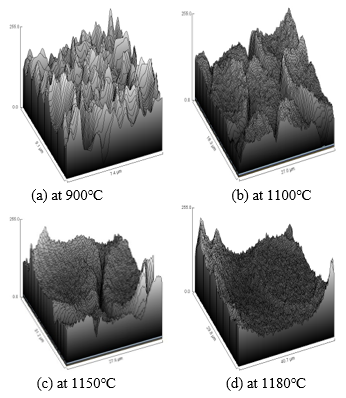
According to Figure 6, distribution of the grains is almost uniform on the whole of the surface of sample, the grain size increases with increasing heat treatment temperature to form more dense and non-porous solution at a temperature of 1150 and 1180℃ in Figure 6 (c and d), the increase of grain size is due to the decrease in oxygen vacancies and with increasing the dopants percentage in the PZT [27].
In the follow-up process:
In perspective, it will be interesting in the continuation of this research to carry out dielectric and piezoelectric measurements for the elaborated powders, according to their composition and calcination temperature to better improve their applications in the industrial and medical fields.
Figure 6. Scanning electron microscope photographs for S3 composition treated at different temperatures
Our work is devoted to the synthesis the solid solution of PZT- PYN by the solid route and their characterization from a structural point of view. The mechanism of formation of the solid solution of lead zirconate-titanate PZT, of the perovskite structure by a doped matrix, has been studied using several experimental techniques such as X-ray diffraction, energy dispersive spectrometric analysis, and Scanning electron microscopy.
The following essential points should be noted for the formation of the PZT solid solution:
The gradual decrease in the intensities of the characteristic peaks of the basic oxides PbO, TiO2, ZrO2.The gradual appearance of characteristic peaks of PbTiO3 from 550℃, of the characteristic peaks of PbZrO3 from 650℃, and Pb [(Zr0.52,Ti0.48)1-0.05,0.05(Y1/2, Ni1/2)]O3 from 750℃. Total formation of the solid solution (PZT-PYN) at 900℃.
The grain distribution is almost uniform over the entire surface of the sample, the average grain size increases significantly with increasing sintering temperature. To form a more dense and non-porous solution at a temperature of 1180℃. The structure of PZT-PYN studied is stable, this stability is due to the reduction of the distortion ratio CT/ aT from the sintering temperature 1100℃ to the optimum temperature 1150℃.
For all samples, it is noted that no parasite phase such as pyrochlore is observed on the SEM micrographs, X-rays and Energy Dispersive Spectrometric Analysis (EDS) confirm these results.
[1] Xu. Y. (1991). Ferroelectric Materials and Their Applications. Elsevier Science Publishers, North-Holland.
[2] Barlingay, C.K., Dey, S.K. (1996). Dopant compensation mechanism and leakage current in Pb (Zr0.52Ti0.48) O3 thin films. Thin Solid Films, 272(1): 112-115. https://doi.org/10.1016/0040-6090(95)06983-6
[3] Puustinen, J., Lappalainen, J., Lantto, V. (2008). Effect of microstructure and surface morphology evolution on optical properties of Nd-modified Pb (ZrxTi1−x) O3 thin films. Thin Solid Films, 516(18): 6458-6463. https://doi.org/10.1016/j.tsf.2008.02.046
[4] Panigrahi, S.C., Das, P.R., Padhee, R., Choudhary, R.N.P. (2018). Effect of Gd on dielectric and piezoelectric properties of lead zirconatetitanate ferroelectric ceramics. Ferroelectrics, 524(1): 14-29. http://doi.org/10.1080/00150193.2018.1432823
[5] Helbig, U. (2007). Size effect in low grain size neodymium doped PZT ceramics. Journal of the European Ceramic Society, 27(7): 2567-2576. http://doi.org/10.1016/j.jeurceramsoc.2006.09.018
[6] Jaffe, H. (1958). Piezoelectric Ceramics. American Ceramic Society, 41(11): 494-498. https://doi.org/10.1111/j.1151-2916.1958.tb12903.x
[7] Fu, S., Cheng, S., Wei, C.C. (2011). Effects of doping pairs on the preparation and dielectricity of PLZT ceramics. https://doi.org/10.1080/00150198608245011
[8] Rai, R., Sharma, S. (2004). Structural and dielectric properties of Sb-doped PLZT ceramics. Ceramic International, 30(7): 1295-1299. https://doi.org/10.1016/j.ceramint.2003.12.031
[9] Sakri, A., Boutarfaia, A. (2014). Investigation on the structural properties of a new prepared 0.2 PZS-0.8 PLZT ceramics. Advanced Materials Research, 856: 197-200. https://doi.org/10.4028/www.scientific.net/AMR.856.197
[10] Gur, P.A., Benguigui, L. (1974). X-ray study of the PZT solid solutions near the morphotropic phase transitions. Solid State Communications, 15(6): 1077-1079. https://doi.org/10.1016/0038-1098(74)90535-3
[11] Kribaa, O.K., Zenkhri, L., Boutarfaia, A. Benamour, L. Chahbaoui, N. (2022). Elaboration and Physicochemical characterization of a Biomaterial for Bone Substitution. Asian J. Research Chem., 15(1): 71-76. https://doi.org/10.52711/0974-4150.2022.00011
[12] Benguigui, L. (1972). Thermodynamic theory of the morphotropic phase transitions Tetragonal-Rhombohedral in the perovskite ferroelectrics. Solid-State Communications, 11(6): 825-828. https://doi.org/10.1016/0038-1098(72)90280-3
[13] Isupov, V.A. (1970). Dielectric polarization of PbTiO3-PbZrO3 solid solutions ceramics. Soviet. Phys. Solid. State, 2(5): 1084-1088.
[14] Yang, Z., Zhang, R., Yang, L., Chang, Y. (2007). Effects of Cr2O3 doping on the electrical properties and the temperature stabilities of PNW-PMN-PZT ceramics. Materials Research Bulletin, 42(12): 2156-2162. https://doi.org/10.1016/j.materresbull.2007.01.008
[15] Kingon, A.I., Terblanche, P.J., Clark, J.B. (1982). Effect of reactant dispersion on formation of PZT solid solution. Ceramics International, 8(3): 108-114. https://doi.org/10.1016/0272-8842(82)90027-X
[16] Hadjadj, S., Boutarfai, A., Zenkhri, L. (2019). Structural and dielectric study of a PLNZNT ceramic material doped with chromium. Annales de Chimie: Science des Materiaux, 43(2): 69-74. https://doi.org/10.18280/acsm.430201
[17] Tokurakawa, M. (2007). Diode-pumped 188 fs mode-locked Yb3+:Y2O3 ceramic laser. Applied Physics Letters, 90(7): 071101.
[18] Jaffe, B., Cook, W.R., Jaffe, H. (1971). Piezoelectric Ceramics. Academic Press, London and New York.
[19] Curie, P., Curie, J. (1880). Développement par compression de l'electricité polaire dans les cristaux hémidres à face inclinés, Tome 91, C. R. Acad. Sci. Paris, 294. https://doi.org/10.3406/BULMI.1880.1564
[20] John, W. (1994). Oxydes: Solid State Chimie Encyclopédie de la Chimie Inorganique Ed R. Bruce King.
[21] David, R. (1998). Handbook of Chemistry and Physics (87 ed.). Boca Raton, FL: CRC Press.
[22] Heslop, R.B. (1976). Inorganic Chemistry, A Guide to Advanced Study. Senior Lecturer in Chemistry, Elsevier Scientific Publishing Company, Amsterdam, 406.
[23] Haussonne, J.M. (2002). Céramique pour l’électronique et l’électrotechnique, presses polytechniques et Universitaires Romandes.
[24] Kribaa, O.M., Boutarfaia, A. (2013). The Study of Reaction Sequences for Formation of Solid Solution of Ceramic Material: Pb1-2XSmxNdx[(Zr0,55Ti0,45)1-0.02,0.01(Y2/3,Mo1/3),0.01 (Y2/3,Ni1/3)]O3 and the Study of These Structures. Journal of Minerals and Materials Characterization and Engineering, 1: 217-221. https://doi.org/10.4236/jmmce.2013.15034
[25] Weston, T.B., Webster, A.H., McNamara, V.M. (1967). Variation in properties with composition in lead zirconatetitanate ceramics. Canad. Ceram. Soc. J., 36(15): 15-20.
[26] Les Céramiques Industrielles, Etude réalisée par le CARMA, Centre d’animation régional en matériaux avancés, Applications industrielles et développements potentiels dans les Alpes-Maritimes. (1999). https://docplayer.fr/2975570-Les-ceramiques-industrielles.html.
[27] Ohtaka, O., Von Der Mühll, R., Ravez, J. (1995). Low-temperature sintering of Pb(Zr,Ti)O3 ceramics with the Aid of oxyfluoride Additive: X-Ray diffraction and dielectric studies. Journal of the American Ceramic Society, 78(3): 805-808. https://doi.org/10.1111/j.1151-2916.1995.tb08251.x