Nawzad J. Mahmood* | Ahmed A. Hussein | Aysha Sh. Hasan | Obed M. Ali
© 2022 IIETA. This article is published by IIETA and is licensed under the CC BY 4.0 license (http://creativecommons.org/licenses/by/4.0/).
OPEN ACCESS
Creep at high temperature leads to gradual deformation under constant loads. In this paper, a comparative study of the fatigue effect of stainless steel and low carbon steel was made, whereby each sample had a constant weight of 24 kg and the experiments on elongation were performed at temperatures 660℃, 700℃, and 740℃ at a constant time of 10 minutes for each experiment. It was found that the highest elongation rate found to be 0.76% for stainless steel metal at a temperature of 740℃. On the other hand, the amount of elongation for low-carbon steel metal at the same temperature found to be 1.9%. This difference in the amount of elongation observed due to the difference in the microstructure of the two metals. The hardness test showed that the maximum value for stainless steel specimens found to be 225 BHN at 660℃, while for low carbon steel specimens 106BHN at 660℃.
creep, stainless steel, low carbon steel, deformation, hardness
At high temperatures, failures due to creep, fatigue, and fracture are an assuming issue in the safety of modern production industries [1]. To perform the test at constant temperature is important to observe accurate account of the beginning of plastic deformation and the early stages of work hardening. On the other hand, the creep test is particularly suited to investigate the steady state of deformation, which allows the study of material response to a sudden change in deformation conditions, for example, a change in stress, in a simple and convenient way. It is the only test to study long-term plastic deformation at extremely low rates [2].
The failure of material due to creep distortion cannot be neglected, but it can be controlled by proper system design [3].
Several rate proceeding mechanisms for the creep deformation of materials, such as lattice diffusion, grain boundary diffusion, grain boundary sliding, grain boundary flow, and dislocation creep were tested over a range of stresses and temperatures [4].
Al-Warmizyari et al. [5] worked on the creep strength of the austenitic stainless steel throughout creep behaviour and damage accumulation in metal microstructure, and the results of the work were compared with the result data of non-serviced samples of the same metal type and dimensions.
Nassour et al. [6] investigated the creep behavior of austenitic stainless steel weld metals. AISI 316L stainless steel base plates were welded together using the submerged arc welding process. The tests were carried out on the welds at constant load, over a stress range of 100 MPa-400 MPa, and in the temperature range of 600℃-700℃.
Yamaguchi et al. [7] studied uniaxial tensile and creep properties at elevated temperature for analysis and creep failure stress. Stress strain curves and creep deformation properties were obtained for low-alloy steel, austenitic stainless steel, and nickel-based alloys that were used in lower head of reactors pressure vessels including control rods and stub tubes.
The aim of this work is to show the benefits and drawbacks of IC testing over uniaxial creep testing in order to determine its usefulness as a test method. Materials under high creep temperatures causes damage function due to cavity nucleation and cavity growth which leads to fatigue and creep combination for stainless steel.
Both stainless steel metal and low-carbon steel were selected for this study. The chemical compositions of both metals are illustrated in Tables 1 and 2, respectively.
1- The samples were cut based on ISO 527-2 standard. The dimensions of two types of samples were the same with thickness of 4 mm and 24 samples were used in the research. The cutting operation was done using mechanical shearer machine. All the dimensions are shown in Figure 1 [8].
2- The fatigue test device was manufactured locally, according to the specifications mentioned in Figure 3.
3- The specimens were clamped between the jaws of machine with a bolt and nut (M8*1) made from stainless steel to resist the applied heat from the electric heater. The sample was fixed well to the two jaws, whatever one of it’s side was fixed and the other was moveable.
This process is shown in Figure 2. The sample was placed inside an electric oven with a thermocouple to control the temperature as it rose to the required degree.
4- The selected weight of 24 [kg] was installed in its position on the machine. The machine parts and the applied load are shown in Figure 3.
Table 1. Chemical composition of stainless steel
|
Weight % |
||||||
|
C |
Mn |
Si |
P |
S |
Cr |
Fe (Rest) |
|
0.09 |
1.0 |
1.0 |
0.04 |
0.04 |
11.5 |
86.33 |
Table 2. Chemical composition of low-carbon steel
|
Weight % |
|||||
|
C |
Mn |
Si |
Ni |
Cu |
Fe (Rest) |
|
0.05 |
0.6 |
0.06 |
0.5 |
0.5 |
98.29 |
The following steps were used to arrange the specimens:
Figure 1. Final dimensions of stainless steel and low-carbon steel samples (all units in mm)
Figure 2. Heater with the fixed arm
Figure 3. Parts and loading weight in the system
5- The device was calibrated by zeroing the dial gauge to measure the elongation of specimens.
6- Specimens were heated at 660℃, 700℃, and 740℃, and the temperature was measured by infrared thermometer.
7- The test period time was measured with a time, whereby there was fixed time of 10 minutes for each test.
8- Operating system and the approximate temperature were determined according to the following formula:
Metal approximate creep temperature
Tapproximate=0.4Tm (1)
where, Tm is the absolute temperature of the metal [9].
The time-elongation curves obtained from the experiment are illustrated in Figures 4-9. The figure show that the stresses were sustained for short time creep periods at different temperatures with different degrees of plastic deformation. During a short period of time of 10 minutes per sample in the tests, the temperature was raised until the required temperature was reached for each sample.
Figure 4. Relationship between elongation and applied load for stainless steel at 660℃
Figure 5. Relationship between elongation and applied load for stainless steel at 700℃
Figure 6. Relationship between elongation and applied load for stainless steel at 740℃
Figure 7. Relationship between elongation and applied load for low carbon steel at 660℃
Figure 8. Relationship between elongation and applied load for low carbon steel at 700℃
Figure 9. Relationship between elongation and applied load for low carbon steel at 740℃
As for the creep tests of stainless steel (ASTM A276-03) samples, it was observed through the graph shown in Figure 4 that the elongation amounted to 0.76 mm at a load of 24 kg at a temperature of 660℃ and 700℃. This was also proven by recent study [10] which demonstrated that the maximum heat value was generated for the stainless steel specimens with the aforementioned mechanical properties.
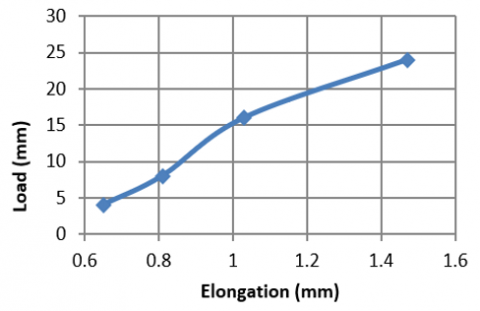
For the sample shown in Figure 5, the elongation amount was 1.32 mm for stainless steel at 700℃. As for Figure 6, when the temperature was raised to 740℃, the elongation amounted to 1.47 mm for stainless steel [11].
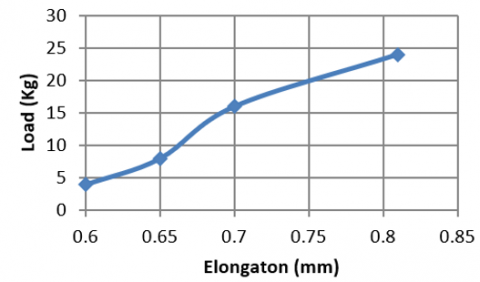
Figure 7 shows the graphic relationship between the applied weight and amount of elongation by fixing the time to 10 minutes for low-carbon steel for each test. When the temperature and weight were fixed at 660℃ and 24 kg (the maximum applied load), respectively, the elongation amounted to 0.81 mm, when compared with the sample in the graphic relationship shown in Figure 8, the elongation measured was 0.9 mm at a temperature of 700℃, which was also obtained in the graph of Figure 9, in which the rise in the temperature of sample to 740℃ resulted in the elongation amount of 1.9 mm. This was the maximum value obtained in the tests [12].
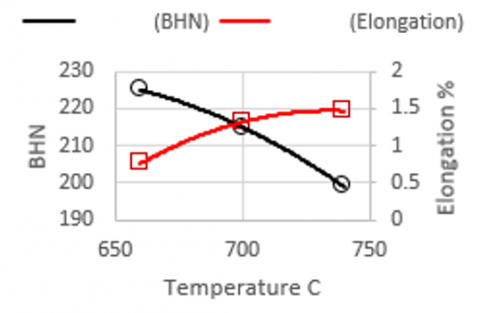
For the sample shown in Figure 10 the graphic relationship between temperature and elongation with Brinell hardness number for stainless steel specimen by fixing time 10 minutes.
Note from the figure the relation between hardness and elongation is inverse relationship, as the lower hardness value, due to the difference in the brittleness of the metal, where at temperature of 600℃, the elongation value (0.76) of the hardness reached maximum (225BHN), While for the elongation value (1.47) the hardness number obtained (199BHN), and that was proved by Brnic et al. [13].
Figure 10. Relationship between temperature and elongation and Brinell hardness (BHN) for stainless steel
For the sample shown in Figure 11 the graphic relationship between temperature and elongation with Brinell hardness number for low carbon steel specimen by fixing time 10 minutes, note from the figure the relation between hardness and elongation is inverse relationship As the lower the hardness value, due to the difference in the brittleness of the metal, where at temperature of 600℃, the elongation value (0.81) of the hardness reached maximum (106BHN), While for the elongation value (1.9) the hardness number obtained (87BHN), and that was proved by Wichienrak and Puajindanetr [14] and Ahmad et al. [15].
Figure 11. Relationship between temperature and elongation and Brinell hardness (BHN) for low carbon steel
By depending on heat equilibrium diagram [16], it was note that when specimens heated to (660-723) ℃ for low carbon steel, the (Ferrite + Perlite) phase was appear, the (alpha) ferrite is ductile phase therefore it has low hardness. Meanwhile, the (alpha + gama) phase appear at temperature 740oC, which is the ratio of the alpha phase dominates the gamma phase because it is close to the alpha zone, and, at this temperature the size of the particles is larger, therefore it is characterized by greater ductility and lower hardness. As for the martensitic stainless steel, the martensite phase (cementite + ferrite) which contains cementite needles, which are by nature hard and needle-shaped, and have a lower ductility due to the phase shift from (cementite + ferrite + perlite), due to the (austenite + ferrite) phase, which led to decrease in the hardness value with increase in the ductility [17]. From the obtained results, it was concluded that the temperature and load have a direct relationship in the two samples for short time creep test. Comparing the samples of low-carbon steel and stainless steel shows that the amount of elongation of each was close due to the fixation of time of 10 minutes for each test. This difference in elongation between the two samples due to the different chemical compositions and durability. The main difference between this research and the rest of the other research is that the short time period for shedding weight to show the amount of elongation is very short compared to the rest of the research, which needs long periods of time (more than 10 minutes).
Tests had been proved that the increasing the creep temperature caused increase in the elongation also, with constant time and load. This was intended that the relationship was proportion directly between these two parameters.
Respect to the applying constant load Any further increase caused increasing in the elongation with the variable creep temperatures. Regarding the hardness parameter, the increase in creep temperature caused decreasing Brinell Hardness values. In addition, the Brinell hardness value proportion inversely with the elongation values.
[1] Yang, X., Ling, X. (2017). Application of a composite model in the analysis of creep deformation at low and intermediate temperatures. Journal of Engineering Materials and Technology, 139(4): 041013-041013. https://doi.org/10.1115/1.4037312
[2] Sultan, J.N., Abbas, M.K., Ibrahim, M.A.K., Karash, E.T., Ali, A.M., Ibrhim, H.A. (2021). Corrosion behavior of thermal seamless carbon steel boiler pipes. Annales de Chimie - Science des Matériaux, 45(5): 399-405. https://doi.org/10.18280/acsm.450506
[3] Larsson, J. (2012). Evaluation of current methods for creep analysis and impression creep testing of power plant steels. Master Thesis. pp. 75-75. http://www.diva-portal.org/smash/get/diva2:605630/FULLTEXT01.pdf.
[4] Yang, F., Li, J.C. (2013). Impression test—A review. Materials Science and Engineering: R: Reports, 74(8): 233-253. https://doi.org/10.1016/j.mser.2013.06.002
[5] Al-Khazraji, A.N., Amin, S.A., Al-Warmizyari, H.A. (2017). The effects of long-term operation and high temperature on material properties of austenitic stainless steel type 321H. Al-Khwarizmi Engineering Journal, 13(2): 1-10. https://doi.org/10.22153/kej.2017.11.005
[6] Nassour, A., Bose, W.W., Spinelli, D. (2001). Creep properties of austenitic stainless-steel weld metals. Journal of Materials Engineering and Performance, 10(6): 693-698. https://doi.org/10.1361/105994901770344566
[7] Yamaguchi, Y., Katsuyama, J., Nemoto, Y., Kaji, Y., Yoshida, H., Li, Y. (2017). Development of failure evaluation method for BWR lower head in severe accident; high temperature creep test and creep damage model. Mechanical Engineering Journal, 4(6): 15-00694. https://doi.org/10.1299/mej.15-00694
[8] Cojocaru, V., Frunzaverde, D., Miclosina, C.O., Marginean, G. (2022). The influence of the process parameters on the mechanical properties of PLA specimens produced by fused filament fabrication—A review. Polymers, 14(5): 886-886. https://doi.org/10.3390/polym14050886
[9] Higgins, R. (1992). Engineering metallurgy: Applied physical metallurgy. Edward Arnold, pp. 560-560.
[10] Mahmod, N.J., Hasan, A.S., Hussein, A.A., Ali, O.M. (2018). Effect of spot-welding current-cycle for medium carbon steel and stainless steel on mechanical properties. International Journal of Engineering & Technology, 7(4.37): 214-218. https://doi.org/10.14419/ijet.v7i4.37.24104
[11] Maciejewski, K., Sun, Y., Gregory, O., Ghonem, H. (2012). Time-dependent deformation of low carbon steel at elevated temperatures. Materials Science and Engineering: A, 534: 147-156. https://doi.org/10.1016/j.msea.2011.11.053
[12] Hasan, A.S., Ali, O.M., Alsaffawi, A.M. (2018). Effect of welding current on weldments properties in MIG and TIG welding. International Journal of Engineering & Technology, 7(4.37): 192-197.
[13] Brnic, J., Turkalj, G., Canadija, M., Lanc, D., Krscanski, S., Brcic, M., Li, Q., Niu, J. (2016). Mechanical properties, short time creep, and fatigue of an austenitic steel. Materials, 9(4): 298-298. https://doi.org/10.3390/ma9040298
[14] Wichienrak, R., Puajindanetr, S. (2019). Factors affecting the mechanical properties variation after annealing of cold rolled steel sheet. In E3S Web of Conferences, 95: 04003-04003. https://doi.org/10.1051/e3sconf/20199504003
[15] Ahmad, S., Lv, L.F., Fu, L. M., Wang, H.R., Wang, W., Shan, A.D. (2019). Effect of annealing on microstructure and mechanical properties of ultrafine-grained low-carbon medium-manganese steel produced by heavy warm rolling. Acta Metallurgica Sinica (English Letters), 32(3): 361-371. https://doi.org/10.1007/s40195-018-0816-3
[16] Fu, J., Xia, C. (2021). Microstructure evolution and mechanical properties of x6crnimovnb11-2 stainless steel after heat treatment. Materials, 14(18): 5243-5243. https://doi.org/10.3390/ma14185243
[17] Jacob, G., Jacob, G. (2018). Prediction of solidification phases in Cr-Ni stainless steel alloys manufactured by laser based powder bed fusion process. US Department of Commerce, National Institute of Standards and Technology, pp. 32-32. https://doi.org/10.6028/NIST.AMS.100-14