Salima Boukour* | Fathe Bouteldja | Elamin Bensaifi
© 2022 IIETA. This article is published by IIETA and is licensed under the CC BY 4.0 license (http://creativecommons.org/licenses/by/4.0/).
OPEN ACCESS
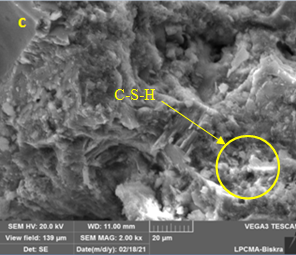
The granulated blast furnace slag exhibits pozzolanic reactivity when combined with appropriate activator and can be used in a wide range as cement replacement. The aim of this study is to investigate the effect on the mechanical and microstructure properties of incorporating admixture composed by granulated blast furnace slag (GBFS), calcined eggshell (CES), and brick waste (BW), as replacement of cement in the formulation of mortar. Ten different mixes of mortar prismatic specimens were tested with different replacement levels of raw materials (50, 75, and 100%). The results show that the increase in the proportion of raw materials decreases significantly drying shrinkage, dry unit weight and strengths of mixtures mortar compared to control mortar at early age. The decrease in strengths is less important in the long term due the development of pozzolanic reaction. Moreover, the water absorption and open porosity were increased for all cases. The microscopic analysis by Scanning Electron Microscopy (SEM) shows that the proportion of 15% of calcined eggshell powder in admixture, provides more Calcium Silicate Hydrate gel (C-S-H) in the internal cementitious matrix of the mortar, which explains the best mechanical strength provided by this mixture.
mortar, blast furnace slag, calcined eggshell, brick waste, mechanical strength, microstructure
Most of the environmental problems associated with cement production relate to the manufacture of clinker, and especially the high carbon dioxide (CO2) emissions and energy consumption [1]. However, in the face of growing environmental challenges, cement industries are now constrained to limit its environmental impact by finding an alternative binder to cement.
Various Algerian industries bear a major share of responsibility for the overall pollution of the country, including the petrochemical, chemical, metallurgical and mineral processing industries. In Algeria, the quantity of GBFS produced annually from manufacturing iron and steel is estimated at more than 500 000 tons [2]. For 1m3 of the molten metal about 200 to 300 kg of slag is produced [3], the major composition of GBFS is a mixture of four oxides: lime (CaO), silica (SiO2), alumina (Al2O3), magnesium (MgO) and other miscellaneous oxides, this composition is relatively identical to chemical composition of Portland cement [4].
The blending of GBFS as a raw material in the concrete, mortar and cement sectors to substitute a part of cement or fine aggregates is studied by many [5-10].
In Algeria, the use of GBFS is limited to the cement industry because of its low hydraulic capacity. Contrary to cement which hydrates by adding water, GBFS is recognized by its low hydraulicity index due to its low CaO/SiO2 ratio [7]. The GBFS cannot be used alone as hydraulic binder because it cannot lead to any phenomenon of setting or hardening of the mixture. It is necessary to activate GBFS to make it reactive to water. To activate hydration of this co-product, several methods are used to provide stable Calcium Silicate Hydrates (C-S-H). The activation of GBFS requires pH≥12 to dissolve the components of the slag to form a hydrated product [11]. The most common activators are calcium hydroxide, calcium sulfate, ordinary Portland cement, cement kiln dust, calcium carbide residue, lime, alkalis, sodium hydroxide, sodium carbonate, sodium sulfate and sodium silicate [12, 13]. Sodium silicate is considered the most effective and most studied activator in the literature for slag; it is often the activator that achieves the best mechanical performance [13, 14] compared to NaOH-activated and reference mortar [14]. However, the use of the Sodium silicate activator is associated with some disadvantages because the most of these activators do not exist naturally, and require energy consumption in the manufacturing processes [15], making them less economically efficient. In this context, the use of activator easy to handle and in the form of waste canreduce the cost production and environmental pollution. The calcium oxide present in lime (CaO) is the main factor responsible for the activation of GBFS [13]. The eggshell lime is rich with this compound (CaO) and can potentially replace limestone for calcic lime production [16, 17].
The lime obtained from calcined waste eggshell has been used in various applications: as filler in feed, fertilizer, paper, printing ink, pharmaceutical and cosmetic products, treatment of synthetic wastewater, starting materials of dielectrics and as bio-catalysts [18]. Many studies are focused on the use of eggshell waste in civil engineering applications. It has been reported that calcined eggshell is used as an alternative for a clayey soil stabilizing agent that replaces quicklime lime to improve soil properties [19]. Eggshell can be used as accelerator to reduce the cure time of the rigid road pavement in the peak of rainy seasons [20]. Also, eggshell is used as a filler material in Portland cement mortars and concretes [21].
Brick waste (BW) is considered an artificial pozzolan [22]; it is used to produce supplementary cementitious composites at later age. The potential pozzolanic reactivity of BW is effective when it is used in ultrafine powder form. Current research is focused on the usage of brick waste as coarse or fine aggregate in concretes and mortars. Unfortunately, little researches are conducted to investigate the possibility of replacing cement with brick-powder. Some recent studies [23, 24] show that there is an improvement in durability and compressive strength of concrete and mortars when substituting cement by filler brick waste.
From the foregoing, it is clear that the effect of incorporation of granulated blast furnace slag (GBFS), calcined eggshell (CES) and brick waste (BW) on mortar properties was not widely studied. The aim of this work is to study the combined effect of these raw materials as cement replacing material of hardened mortar. The CES is used at different proportions in order to determine the optimum percentage to activate GBFS. The brick waste is used for their capacity to improve mechanical strength of mortar at later age.
Laboratory tests were conducted on the prepared samples with different substitution including, mechanical strength at different ages 7, 28, 56, 90 and 180 days, dry unit weight, open porosity, capillary water absorption, dying shrinkage. Scanning Electron Microscopy (SEM) analysis was conducted to support and confirm the interpretation of their observed macroscopic behavior.
2.1 Materials
Natural siliceous sand, extracted from Oum Ali sandpit (Region of Tebessa, northern Algeria). It is used for all mixtures. This material has particle size according to standard sand, their size distributions are ranged from 0-2mm, with 60–90% of the fine aggregate passing through a 600-micron sieve; the main physical properties and granulometric curve of sand are presented in Figure 1 and Table 1.
Figure 1. Particle size distribution curves of sand
Table 1. Physical properties of natural sand
|
Apparent density(kg/m3) |
Absolute density(kg/m3) |
Sand equivalent (%) |
Fineness modulus |
|
|
|
|
ESV |
ES |
|
|
1664 |
2676 |
85 |
81 |
2.55 |
The cement used for all the mortar mixtures was a blended Portland cement (PC) type (CEM I 42.5R) (95% clinker with 5% gypsum), manufactured by Ain Touta Cement Company, which is located at the wilaya of Batna (Algeria), complying with the Algerian Standard NA433-2002. Specific gravity and Blaine specific surface area of ordinary Portland cements (CEM I) were 3.15 and 5000 cm2/g respectively.
The GBFS required in this study provided by the metallurgic unit of El Hadjar, in the north east of Algeria (Annaba). To increase their reactivity; the GBFS is dried inoven at 105℃ for 24 hours and milled by the Micro Deval machine to a fine powder for 12 hours. The crushed GBFS has a specific surface area about 4000 cm2/g. The GBFS is the same material used in the study of Bensaifi et al. [25].
Chicken waste eggshells used in this work were the white and brown color type. They were collected from local bakeries. The collected eggshells were thoroughly washed in tap water to remove any unwanted materials adhered on its surface. Next, the eggshells were dried in oven for 24 hours at 40℃ to remove the moisture and make pre-grinding easy.
The eggshell was calcined in a muffle furnace for 2h at 900℃ [25]. The purpose of the calcination is the transformation of the calcium carbonate (CaCO3) to calcium oxide CaO, as illustrated in Eq. (1):
CaCO3→CaO+CO2 (1)
It is noted that the best calcination temperature of eggshell to produce components about 98.56% of CaO is 900℃ [25].
Table 2. Chemical compositions of the PC, GBFS, CES and BW
|
Chemical composition |
PC (%) |
GBFS (%) |
CES (%) |
BW (%) |
|
SiO2 |
21.62 |
41.07 |
0.41 |
69.26 |
|
Al2O3 |
4.49 |
9.06 |
0.11 |
14.17 |
|
Fe2O3 |
5.37 |
3.31 | 0.02 | 6.30 |
|
CaO |
63.91 |
42.71 | 92.02 | 4.28 |
|
MgO |
1.66 |
2.25 |
1.21 |
2.25 |
|
SO3 |
1.92 |
0.28 |
0.12 |
0.02 |
|
Na2O |
0.08 |
0.25 |
0.19 |
0.28 |
|
K2O |
0.25 |
0.83 |
0.09 |
1.34 |
|
LoI |
0.81 |
0.32 |
5.22 |
1.96 |
Figure 2. Preparation of raw materials
Table 3. Mortar mixture proportions used (g)
|
Mortar Mixes |
Cement replacement (%) |
PC |
NS |
W |
GBFS |
CES |
BW |
|
F0 |
0% |
450 |
1350 |
225 |
0 |
0 |
0 |
|
F1 |
50% |
225 |
1350 |
225 |
157.5 |
56.25 |
11.25 |
|
F2 |
225 |
1350 |
225 |
180 |
33.75 |
11.25 |
|
|
F3 |
225 |
1350 |
225 |
202.5 |
11.25 |
11.25 |
|
|
F4 |
75% |
112.5 |
1350 |
225 |
236.25 |
84.37 |
16.87 |
|
F5 |
112.5 |
1350 |
225 |
270 |
50.62 |
16.87 |
|
|
F6 |
112.5 |
1350 |
225 |
303.75 |
16.87 |
16.87 |
|
|
F7 |
100% |
0 |
1350 |
225 |
315 |
112.5 |
22.5 |
|
F8 |
0 |
1350 |
225 |
360 |
67.5 |
22.5 |
|
|
F9 |
0 |
1350 |
225 |
405 |
22.5 |
22.5 |
After calcination, the eggshell was crushed in small pieces. Only eggshell powder with particles sizes lower than 80 μm was used in the preparation of mortars to allow better packing and to have the same fineness of Portland cement and granulated furnace blast slag. The specific surface of calcined eggshell powder was approximatively 3000cm2/g.
Commercial brick waste (BW) from brick factory located in Guelma’s department was used in this study. The brick waste was incorporated in mortars in the form of filler (fine powder). First, the material was crushed manually using a hammer to produce small aggregates. Then, it was dried in oven at 105℃ for 24h and grounded with Los Angeles machine until exhibited the required fineness sizes. Finally, the fine powder obtained was sieved to remove particles with diameters greater than 80 μm.
To ensure the same workability for all mixtures, a polycarboxylic-ether based superplasticizer (SP) admixture marketed under the name Medaplast SP40 with a specific gravity of 1.20 ± 0.01, solid content of 40% and a solution of pH= 8.2 (manufactured by Granitex Algeria), was used at different dosage by weight of Portland cement (the manufacturer's recommendation dosage is between 0.6 and 2.5% of the PC weight).
The chemical compositions and physical pictures of the all raw materials (RM) used in mixtures according to Bogue formulas are given by the Table 2 and Figure 2 respectively.
2.2 Mixtures proportions
The formulation method used to prepare the mortar mixtures was based on the normalized mortar composition (one part of Portland cement 450g, three parts of sand 1350g, and constant water-cement (W/C) ratio at 0.5).
In order to evaluate the effect of waste incorporation in the mortar mix on material properties, ten (10) mortars were prepared from the adopted mix design below. The mix without additions serves as reference mix for comparison with various series of mixes which were designed with different replacement level by weight of PC. The proportions of GBFS are 25, 50 and 100%, CES are 5, 15 and 25, and the BW content is constant at 5% by weight of cement. Materials proportions and quantities of mortar mixes tested are shown in Table 3.
The workability of various mixes, including the control mix has been checked by flow table. The content of supeplasticizer was adjusted in order to obtain plastic mixtures around 160 mm.
2.3 Tests procedures
Brief descriptions of the tests conducted are given in this section. The mechanical behaviors of mortars specimens 4×4×16 cm3 are evaluated using compressive and flexural tests. The testing period for the mechanical properties was conducted at 7, 28, 56, 90 and 180 days. All specimens were demolded after 24 h of casting and maintained in water tank (20±2℃) until testing ages. A total of 100 mortar specimens were cast (10 specimens for each mix).
In the case of flexural strength, hardened mortar prismatic samples were subjected to three points loading until failure. The nominal distance between the supports was 100 mm. According to EN 196-1, the flexural strength is measured using a hydraulic load testing equipment control with 150 KN capacities, at the rate of 2400 N/s.
After the failure of specimens in flexural tests, the two parts of each prism were subjected to compressive stress by using a hydraulic press with a capacity of 1500 KN at a loading rate of 2400 N/s. The tests were conducted using the principles and procedure outlined in the standard NF EN 196-1(2006). Each mechanical property value is the average value from tests performed on three specimens.
The change of the open porosity and the density of the different mortars are monitored on three prismatic specimens (40×40×160 mm). The accessible porosity was measured by hydrostatic weighing, according to standard NF EN18-459 (2010). It measures the percentage of voids connected with the surface within the matrix of the mortars. This parameter determined for a wide variety of mortar and concrete is considered as an indicator of sustainability from a microstructural point of view because it influences the transfer properties of concrete. These tests were carried out after immersing the samples in water at room temperature for 28 days.
The capillary water absorption test was conducted conforming to the European standard NF EN 480-5 (2006). First, specimens were previously oven dried at 70℃ until a constant weight was obtained. Then, the specimens were weighed one by one before starting the absorption test.
The side faces of prismatic samples were waterproofed using epoxy resin to avoid evaporative effect as well as to maintain uniaxial water flow during the test. The bottom and top surfaces were exposed to water and air respectively. The sample was placed on supports in a shallow tray. The specimens were soaked from their bottom in a 5 mm water level for a specific period. To compensate the water absorbed during the experiment, the level of water was maintained constantly. The timing device was started when the sample contacted water. The weights of samples were measured at a definite interval time 0.25, 0.5, 0.75, 1, 2, 3, 4, 6, 8, 10, 24, 48, 72, 96, 120, 144, 168 and 192 h (8 days). The relationship between the capillary suction depth and the square root of time is used to evaluate the sorptivity (S), as shown below Eq. (2) [26]:
$S\left(m / s^{1 / 2}\right)=\frac{I}{t^{1 / 2}}$ (2)
This parameter characterizes the tendency of a porous material to absorb and transmit water by capillarity for the first eighth (8) hours.
Drying shrinkage is a very important property of cementitious materials that affects their durability. It was due to the loss of capillary water of hardened mortar that causes contraction and formation of cracks in the concrete [27].
Testing was conducted in accordance with ASTM C 157 (2008) by using a mechanical strain gauge. The dial gauge was installed on top of the specimen to measure the change in the length which is expressed in (mm/m) with an accuracy up to 1/1000 mm. The samples were then left to dry under laboratory conditions (23℃) for the measurement. The shrinkage of three samples was measured every week until three months. The average value was calculated at any time using Eq. (3):
$\varepsilon=\frac{\Delta L(t)}{L}$ (3)
The microstructure analysis allows a deeper understanding of the influence of GBFS, CES and BW on the hydration process of different mortars. It was performed using prepared broken samples at 56 days of water curing in form of small pieces. The samples were coated with silver before introducing them into the analysis chamber. This metallization allows avoiding substantial charge accumulation on the surface of samples (thus improving image quality). The microstructures of specimens were studied using the Tescan Vega3 Microscope of the University of Biskra-Algeria. The Morphology and structure of different samples can be provided by magnifications at 20 μm.
3.1 Compressive strength
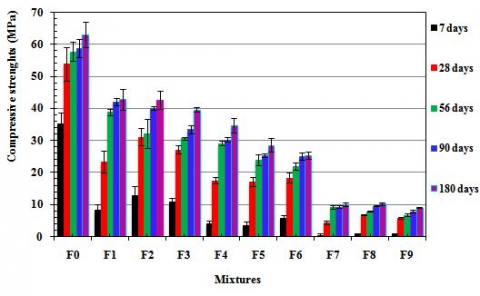
All specimens were tested in compression at different short, medium, and long-term curing time 7, 28, 56, 90 and 180 days) and the results are presented in Figure 3.
Figure 3. Compressive strength of mixes made with combined GBFS, CES and BW
This result shows that during the first 7 days, the strengths are low for all mixes, while after 28 days, the strength was increased significantly (>50%). However, during later ages (between 28 and 180 days) the pozzolanic reaction of raw materials (GBFS, CES and BW) will take place. It interacts with the calcium hydroxide to form an additional amount of calcium silicate hydrates (C–S–H) in blended cement pastes structure, which tend to increase significantly the compressive strength.
At early ages (7 and 28 days), the CES content replacement of 15% (F2 and F8) provides higher strength, compared to the other mixes (F1, F3, F7 and F9). However, 5% of CES content provides higher strength for F6 mix compared to F4 and F5 mixes.
At medium (56 days) and later ages (180 days), the compressive strength increases as a function of increasing of CES content for all mixes. The higher strength is obtained for F1, F4 and F7 mixes (50%, 75% and 100% of PC replacement). This can be explained by the interaction of eggshell CaO which helps to accelerate the cement hydration process by reacting with the C3S and form C-S-H, thus allowing to increase the strength [28, 29]. The integration of CaO into cementitious composites can thus be carried out as high activity particles which stimulate the pozzolanic reaction [30].
The results shows also that the increasing of GBFS content in all mixes tend to decrease the compressive strength. The quantity of CES is not enough to activate GBFS necessary for hydraulic and pozzolanic reactions of mixes. It seems that a low content of the eggshell activates only a part of the GBFS and form the cementitious compounds.
The results also show that the compressive strength decreases clearly at different curing ages by increasing rate replacement (25%, 50% and 100%) of raw materials (GBFS, CES and BW) for all curing times. The compressive strengths of all mixes are lower than the control mortar F0. This decrease in compressive strength for different mixes is more accentuated at 7 days because they are less rapidly developed in hardened cementitious compounds than control mortar. The hydrates of GBFS, CES and BW are created more slowly than cement, which has an impact on strength especially at early age. For example, the incorporation of 50% of PC and 50% of GBFS with different CES rates 5%, 15% and 25% (F1, F2 and F3) provides compressive strengths lower than the control mortar (F0) and the deviation on strength is about 76%, 63% and 68% respectively.
However, after 28 days, the compressive strength tends to approach each other especially for mortars with low content of raw materials (GBFS, CES and BW). It is observed that the replacement of 50% of PC in F1, F2 and F3 mixes provides about 167% of average deviation between 7 and 28 days on compressive strength and about 50% between 28 and 180 days. The average deviations of these three mixes are higher than those obtained for control mortar (53% between 7 and 28 days and 17% between 28 and 180 days). The improvement of compressive strength at alter age can be explained by the potential pozzolanic reactivity of BW-powder.
3.2 Flexural strength
The result of flexural strength of all mixes at deferent curing times is shown in Figure 4. Overall, the evolution of flexural strength follows almost the same tendencies previously observed for compressive strength. The result shows that the flexural strength is highly influenced by the amounts of raw materials in the mixes. The C-S-H gel has been produced and has therefore contributed to the strength development of specimens because the raw materials contain a high level of calcium.
For all combined cases, the flexural strength of control mortar F0 was higher than the other mixes, indicating the fast kinetics of cement hardening. It is observed that the maximum flexural strengths are provided by mixes with 50% replacement ratio compared to the other levels (75% and 100% replacement ratio). The minimum flexural strengths are obtained for 100% replacement ratio.
At 7 days, the flexural strength of all combined mixes is lower than conventional cement mortar F0. The deviation of F1, F2, F3, F4, F5, F6, F7, F8, and F9 mixes are about 19%, 5%, 30%, 73%, 80%, 79%, 78%, 87%, and 90% respectively. This result can be explained by the effect of the slow hydration at early age of mortars incorporating raw materials.
The same behaviour was noticed at 180 days, flexural strengths of all mortars with 50%, 75% and 100% replacement ratio combined with 25, 15 and 5% of CES were respectively about 12%, 13%, 14%, 19%, 23%, 23%, 55%, 49%, and 57% lower than the control mortar (F0). These findings are also in accordance with previous studies [31].
Hence, it is clearly evident that flexural strengths of mortars are considerably reduced versus the increase of raw materials content. The increase of CES content in RM binder increases also the flexural strength. For example, for 75% RM replacement at all curing ages, flexural strength of 25% of CES content (F4) is higher than that of 5% (F5) and 15% (F6). This behavior is also observed for 50% replacement Portland cement ratio at later ages (180 days) and for 100% replacement ratio at early ages (7 and 28 days). However, when cement is replaced at 50 and 100% of RM at later ages and early ages respectively, it was found that 15% of CES provides better flexural strength. Calcined eggshell used as activator binder play a central role in producing C-S-H gel.
Figure 4. Flexural strength of mixes made with combined GBFS, CES and BW
3.3 Dry unit weight
Bulk density is one of the significant parameters in the mix design process. The key factors affecting mortars density are related to the aggregate density, air content, water content, and cement [32].
The effect of hydraulic binder content (GBFS, CES and BW) on dry weight values of all mixes mortars at 28 days is presented in Figure 5.
Figure 5. Dry unit weight of mixes with combined GBFS, CES and BW
It can be seen that the density of control mortar F0 is slightly higher than all mixes incorporating RM. The dry unit weights of all specimens decreased as function of increasing of RM content. This is mainly due to the low density of raw materials compared to those of Portland cement (unit weight of GBFS is 3.07 g/cm3 while unit weight of PC is 3.23g/cm3). These results are in line with those obtained by Thakur et al. [8] during the early ages of curing hydration process and pozzolanic reaction led to a higher loss in average density. Concerning the inclusion of 15% CES as activator appears suitable for all mixes and it is possible to identify a minor increase in density compared to 5% and 25% CES content.
3.4 Open porosity
The results of open porosity of different mixtures are shown in Figure 6.
Figure 6. Effect of combined GBFS, CES and BW on open porosity
The data shows that the control mortar F0 has a lower porosity compared to other mortars containing RM. In addition, it notes that the open porosity increases with the increase in the rate substitution of Portland cement by raw materials (50%, 75% and 100%). The average porosity values for the first, second and third groups of mortars (50%, 75% and 100% replacement) are respectively about 17, 18%, and 19%; Similar results are obtained by Hadj-Sadok et al [9], the presence of slag seems to increase the porosity level of mortars at different ages (28, 90 and 360 days). The highest porosity was provided by F8 mix, which increases the open porosity about 25% compared to control mix F0. Previous studies [10] have shown that the use of GBFS lead to a low hydration rate of binders, which means that the specimens with low levels of PC lead to a micro-structure low densification due to insufficient hydrates development and consequently porosity increases.
For the first (F1, F2, and F3) and the second (F4, F5, and F6) group of mixtures (50% and 75% of replacement levels), it is clear that the use of 15% of CES (F2 and F5) is the optimum dosage for GBFS activation with an enhancement of 10% compared to 5% and 25% CES content. For the third group of mixtures (F7, F8, and F9), the optimum content of CES is 25%. In this case, the activation of GBFS requires a higher amount of CES to produce cementitious compounds. Further, the addition of CES caused pozzolanic reaction that results in improving pore structure of mortar leading to lower porosity at higher percentage replacement. The visual porosity aspects for all specimens with different amounts of GBFS, CES and BW are shown in Figure 7.
Figure 7. Visual aspect of different mixes
3.5 Capillary water absorption
The absorption kinetics is presented by the variations in the amount of water absorbed per unit area as a function of the square root of time. The capillary absorption curves for all samples are shown in Figure 8.
Figure 8. Kinetics of capillary water absorption of all mixes
For all mixes, water absorption capillarity increases over time and then stabilizes. The absorption curves contain two linear portions which show that there was a marked inflection point in the curve. This point corresponds to the instant of beginning effect of the gravity of absorbed water. The first absorption phase is mainly controlled by capillary pores [33, 34]. The physical limit occurs when the front of capillary rise reaches the top of specimens. Thereafter, the water continues to be transported by pores of the gel, which is mainly controlled by the diffusion mechanism [35].
It can be noted that from the first hour of testing, the capillary absorption kinetics of all mortars rapidly increased versus time. The water absorption curves are almost coincident for samples of different mixes. It can be seen clearly that control mix F0 absorbs less water compared to all mixes containing different levels of RM. The absorption rate and the sorptivity were around 4.5x10⁻³ m and 10-4 m/s1/2 respectively.
For the first group of mixes with 50% of Portland cement replacement (F1, F2, and F3), the absorption curves are similar. Capillary water absorption rates and the sorptivity are around 8.5x10⁻³ m and 1.5x10⁻⁵ m/s1/2 respectively for the three mixes (Figures 8 and 9). In this case, it is clear that the variation of CES content between 5% and 25% has no incidence on the kinetics of capillary water absorption.
For the second group of mixes with 75% of Portland cement replacement (F4, F5, and F6), the result shows that absorption rates are increased as a cause of decreasing CES content. The absorption rates of F4, F5, and F6 were around 6x10⁻³ m, 9.5x10⁻³ m and 15x10-3 m respectively. Moreover, it is reported that the sorptivity present similar trend as absorption rate with values around 1.3x10⁻⁵ m/s1/2, 1.6x10⁻⁵ m/s1/2 and 2.5x10⁻⁵ m/s1/2 respectively.
For the third group of mixes with 100% of Portland cement replacement (F7, F8, and F9), it is found that absorption rate increases then decreases slightly as function of decreasing of CES content. The absorption rates of F7, F8, and F9 were around 16x10-3 m, 25x10-3 m and 23x10-3 m respectively. The same behavior was observed for sorptivity with values around 2.2x10⁻⁵ m/s1/2, 3.5x10⁻⁵ m/s1/2 and 3x10⁻⁵ m/s1/2 respectively. The maximum water absorption value was found for F8 with 100% of PC replacement and 15% of CES content. This value was 25 times greater than the control mortar. In contrast, it is observed that mortar made with 75% of PC replacement and 25% of CES content (F4) provided lower water absorption compared to other mixes. The comparison between different groups mixes and control mortar shows that replacement of PC by raw materials (GBFS, CES and BW) increases the water absorption rate and the sorptivity.
Figure 9. Sorptivity of different mixes mortars
It is stated in the literature that the hydration of GBFS with water was slower than the hydration of cement binder which is the result of the reduced CaO content in GBFS compared to Portland cement. This may reduce the amount of C-S-H gel and consequently produce more permeable voids that allow excessive water particles that move freely within the open porosity as a result of less hydration process of cement [9]. Moreover, calcined eggshell is one of potential sources of CaO which can have both chemical and physical effects on the cement hydration process. Calcium carbonate is more successful by speeding up the formation of calcium silicate hydrated (C-S-H) gel by reacting with calcium silicate (C3S) [30]. Increased C-S-H gel formation can be a cause of pore reduction.
3.6 Drying shrinkage
The evolution of drying shrinkage of the mortar samples over curing time is presented in Figure 10. Overall, it can be seen that with rising curing time, the shrinkage increases for all mixes. This is caused by evaporation of water and cement hydration. The rate of shrinkage increase being the greatest during early ages.
Figure 10. Average drying shrinkage of all mixes
From the curves it is obvious that the values of shrinkage were decreased as function of increasing the substitution rate of Portland cement by raw materials (GBFS, CES and BW). The shrinkage of all mixes was lower than the control cement mortars. The same observation was found by (Li and Yao 2001), it was reported that ultra-fine GGBS-blended concrete showed reduction in drying shrinkage value compared to ordinary Portland cement concrete. The maximum values of shrinkage measured at 105 days are 900 µm/m, 682 µm/m, 747 µm/m, 866 µm/m, 428 µm/m, 530 µm/m, 595 µm/m, 235 µm/m, 276 µm/m, and 240 µm/m for mixtures F0, F1, F2, F3, F4, F5, F6, F7, F8, and F9 respectively. In generally, it can be observed that the increase in the cement replacement tend to increase the drying shrinkage. The evolution of shrinkage and mechanical strengths of mortars in this case follow the same tendency. This can be explained by the height reactivity of PC compared to RM, the mixtures containing more cement consume more water for hydration. Moreover, it can be seen that there is not relationship between drying shrinkage tendency and both water absorption and open porosity. The values were dispersed when compared to the RM content.
At 28 days, the recorded shrinkages for the first group of mixtures with 50% of Portland cement replacement (F1, F2, and F3) were around 28%, 11%, and 12% respectively lower than the control shrinkage of ordinary mortar (F0). At 105 days, the deviations were reduced to 24% and 4% for F1 and F3 respectively and increased to 17% for F2 compared to control mortar F0. Moreover, the drying shrinkage values of the second group of mixtures with 75% of Portland cement replacement (F4, F5 and F6) were even more minimized at 53%, 44% and 25% at 28 days respectively compared to control mortar. At 105 days, the deviations slightly decreased over time and they were 52% and 41% for F4 and F5 mixes respectively and increased at 33% for F6 mix. For the third group of mixtures with 100% Portland cement replacement (F7, F8 and F9), the deviation was 82%, 78%, and 77% at 28 days and the values decreased to 74%, 69%, and 73% at 105 days compared to control mortar. Generally, it can be observed that shrinkage was reduced as function of increases of percentage of replacement of Portland cement by raw materials. This can be explained by the low reactivity of GBFS compared to cement. The mixtures containing less cement consume less water for hydration which generates less capillary menisci responsible for shrinkage. The results obtained is consistent with previous findings by Akçaözoğlu et al. [36], they concluded that replacing cement with GBFS in mortars regardless of aggregate type PET or sand aggregates, the shrinkage was reduced. It is perceived that the amount of calcined eggshell to activate GBFS is another important factor affecting the drying shrinkage with enhancing the properties of the mortar. The results indicate that the shrinkage of F1, F4, and F7 mortars with 25% of CES amount in raw materials is lower than that of mixes for each group mixtures.
3.7 Scanning electron microscopy analysis
The effect of the partial and total replacement of Portland cement by different raw materials on hydration process and microstructure system of the mortars was analyzed. As can be seen from the SEM images demonstrated in Figures 11-14.
The works of Seungwon et al. [37-42] were used to perform the microstructural analysis.
In general, the micrographic images of control mix (F0) show a dense and homogeneous microstructure owing to the formation of a compact binder with less microscopic voids compared to other mixtures. The denser matrix of F0 is consistent with its higher value of compressive strength which results in a high level of Portland cement hydration. While in the case of mortars with raw materials, it is found that the calcium silicate hydrate (C-S-H) was dispersed throughout the matrix. The incorporation of GBFS, CES and BW affects the morphology of hydration materials and also changes the pore structure into a hardened compound matrix leading to the variation of the C-S-H composition.
It appears that the mortar with 50% Portland cement replacement (F1, F2 and F3) present a less dense texture than the control mix (F0). This could be due to the effect of the low content of Ca(OH)2. The content of Ca(OH)2 depends to the hydration of PC, GBFS and CES, which is higher in the first group of mixes (50% Portland cement replacement) compared to second and third mortars groups (75% and 100% Portland cement replacement). Despite a less Ca(OH)2, crystals were produced in all mixtures. The compressive strength decreases after 56 days by increasing raw materials content due to the fact that the C3S and C2S content in ordinary Portland cement have decreased. The hydrates present in the microstructure are essentially calcium silicates C-S-H. It can be seen that C–S–H gel of control mortar mainly exists in the shapes of needle or fiber and granulated and its structure is denser.
A few amounts of GBFS are still present in its anhydrous form in specimens F7 (Figure 12a), suggesting that the hydration of a part of binder is not yet completes at this stage. The hydration of the clinker in this quaternary formulation is faster than the hydration of the GBFS because more anhydrous slag grains are observed than anhydrous clinker grains.
Figure 11. SEM micrograph of reference mortar (F0) after 56 of curing time
F9
F8
F7
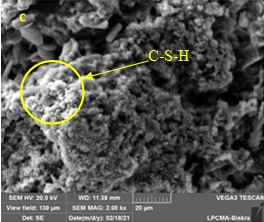
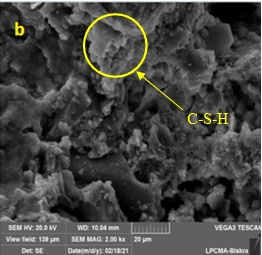
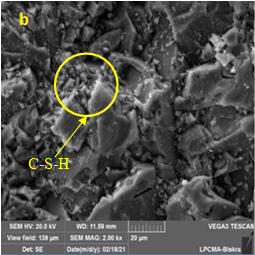
Figure 12. SEM micrographs of 100% cement replacement mortars incorporating a) 5% CES, b) 15% CES and c) 25% CES after 56 days of curing time
F6
F5
F4
Figure 13. SEM micrographs of 75% cement replacement mortars incorporating a) 5% CES, b) 15% CES and c) 25% CES after 56 days of curing time
By comparing the same GBFS level with the incorporation of different CES powder, changes in the morphology of the samples were investigated, for 100% of Portland cement replacement. It can be seen from photos Figure 12b that partial replacement with 15% of CES (F8) becomes more compact and homogeneous with a denser C-S-H and present a good relationship between the different constituents of the mortar. This finding is almost identical to microstructure of F7 with 25% of CES (Figure 12c). Furthermore, the microstructure of F9 exhibits that the structure is less dense with weak liaison and less C-S-H present when compared to F7 and F8, which is the reason of the lowest compressive strength obtained for F9. For the second group of mixes (75% of Portland cement replacement), it can be found that GBFS has less effect on sample structure. It can see from Figure 13b, for F5 mix, the presence of the C-S-Hgel is visible in a higher amount. However, there are voids between the links. It also found that there is a slight improvement in morphology of F6 mix presented in Figure 13a. It can clearly be observed that C-S-H with a dense structure between mixing components is developed and thus reaches complete GBFS and CES hydration.
The improvement of microstructure was usually observed in the case of mortar including 50% of replacement Portland cement (group 1). The best result was provided by F1 mix with 25% of CES content. This replacement level was beneficial to the development of more C-S-H gel formed in comparison to F2 and F3 mixes (Figure 14b and 14a). This observation was confirmed by the high mechanical compressive strength of F1 mix compared to other mixes.
F3
F2
F1
Figure 14. SEM micrographs of 50% cement replacement mortars incorporating a) 5% CES, b) 15% CES and c) 25% CES after 56 days of curing time
Based on the experimental results using granulated blast furnace slag (GBFS), calcined eggshell (CES) and brick waste (BW) as Portland cement replacement, the following conclusions can be done:
- The compressive and flexural strengths exhibited a tendency to decrease when the content of RM increased from 50 to 100%.
- The strength loss caused by increasing raw materials content is more evident at early age. However, the strength loss is less important in later age.
- The value of unit weight for all mixtures was close to each other. However, there was a slight decrease in the unit weight value when raw materials content increases.
- The drying shrinkage is reduced when Portland cement is partially replaced by raw materials. The drying shrinkage is associated with the amount of produced C-S-H gel.
- The incorporation of RM shows a higher water absorption value and porosity compared to control mortar.
- The SEM results showed that the mixes containing limited amounts of raw materials could promote the C-S-H gel nucleation and densification.
- Future studies need to be done to investigate the performance of mixes under the effect of chemical attacks.
The experimental work presented in this paper was carried out at the laboratory of civil Engineering and hydraulics, University 8 Mai 1945, Guelma, Algeria.
|
GBFS |
granulated blast furnace slag |
|
CES |
calcined eggshell |
|
BW |
brick waste |
|
CSH |
calcium Silicate Hydrate gel |
|
PC |
Portland cement |
|
RM |
raw material |
|
CO2 |
carbon dioxide |
|
CaO |
lime |
|
SiO2 |
silica |
|
Al2O3 |
alumina |
|
MgO |
magnesium |
|
NaOH |
sodium hydroxide |
|
CaCO3 |
calcium carbonate |
|
W/C |
water-cement ratio |
|
∆l |
the longitudinal contraction of the specimen (mm); |
|
I |
the volume of absorbed water |
|
S |
sorptivity |
|
t |
time |
|
Greek symbols |
|
|
ε |
the strain due to drying shrinkage (mm/m) |
[1] Subiyanto, E. (2020). The relationship of cement consumption and economic growth: an updated approach. European Research Studies Journal, XXIII(3): 280-295. https://doi.org/10.35808/ersj/1638
[2] Zemouli, S., Chelghoum, N. (2018). Utilisation du laitier granulé broyé des hauts fourneaux dans la stabilisation des sols. Synthèse: Revue des Sciences et de la Technologie, 36: 103-114. https://www.ajol.info/index.php.
[3] Barati, M., Esfahani, S., Utigard. T. (2011). Energy recovery from high temperature slags. Energy, 36(9): 5440-5449. https://doi.org/10.1016/j.energy.2011.07.007
[4] Turu’allo, G. (2015). Sustainable development of concrete using GGBS: Effect of curing temperatures on the strength development of concrete. Applied Mechanics and Materials, 776: 3-8. https://doi.org/10.4028/www.scientific.net/AMM.776.3
[5] Bhattiwala, Q.J., Dabhekar, K. (2016). Effect of cementitious waste material (GGBS) on concrete as a replacement in cement. International Journal of Science Technology and Engineering, 2(11): 77-82. https://www.ijste.org/articles/IJSTEV2I11013.pdf.
[6] Siddique, R. (2014). Utilization (recycling) of iron and steel industry by-product (GGBS) in concrete: strength and durability properties. Journal of Material Cycles and Waste Management, 16(3): 460-467. https://doi.org/10.1007/s10163-013-0206-x
[7] Bougara, A., Lynsdale, C.J., Ezziane, K. (2009). Activation of Algerian slag in mortars. Construction and Building Materials, 23(1): 542-547. https://doi.org/10.1016/j.conbuildmat.2007.10.012
[8] Thakur, I.C., Kisku, N., Singh, J.P., Kumar, S. (2016). Properties of concrete incorporated with GGBS. International Journal of Research in Engineering and Technology, 5(8): 275-281. https://doi.org/10.15623/IJRET.2016.0508046
[9] Hadj-Sadok, A., Kenai, S., Courard, L., Darimont, A. (2011). Microstructure and durability of mortars modified with medium active blast furnace slag. Construction and Building Materials, 25(2): 1018-1025. https://doi.org/10.1016/j.conbuildmat.2010.06.077
[10] Rathanasalam, V., Perumalsami, J., Jayakumar, K. (2020). Characteristics of blended geopolymer concrete using ultrafine ground granulated blast furnace slag and copper slag. Annales de Chimie - Science des Matériaux, 44(6): 433-439. https://doi.org/10.18280/acsm.440610
[11] Li, P., Tang, J., Bai, Y., Chen, X., Chen, J. (2019). Experimental study on the pH for activating ground granulated blast-furnace slag activity at different temperatures. Sådhanå, 44(10): 1-12. https://doi.org/10.1007/s12046-019-1204-z
[12] Tänzer, R., Buchwald, A., Stephan, D. (2015). Effect of slag chemistry on the hydration of alkali-activated blast-furnace slag. Materials and Structures, 48: 629-641. https://doi.org/10.1617/s11527-014-0461-x
[13] Behnood, A. (2018). Soil and clay stabilization with calcium-and non-calcium-based additives: A state-of-the-art review of challenges, approaches and techniques. Transportation Geotechnics, 17: 14-32. https://doi.org/10.1016/J.TRGEO.2018.08.002
[14] Aydın, S., Baradan, B. (2014). Effect of activator type and content on properties of alkali-activated slag mortars. Composites Part B: Engineering, 57: 166-172. https://doi.org/10.1016/j.compositesb.2013.10.001
[15] Gu, K., Jin, F., Al-Tabbaa, A., Shi, B. (2014). Activation of ground granulated blast furnace slag by using calcined dolomite. Construction and Building Materials, 68: 252-258. https://doi.org/10.1016/j.conbuildmat.2014.06.044
[16] Consoli, N.C., Caicedo, A.M.L., Saldanha, R.B., Filho, H.C.S., Acosta, C.J.M. (2020). Eggshell Produced Limes: Innovative Materials for Soil Stabilization. Journal of Materials in Civil Engineering, 32(11): 1-7. https://doi.org/10.1061/(ASCE)MT.1943-5533.0003418
[17] Saldanha, R.B., Rocha, C.G., Caicedo, A.M.L., Consoli, N.C. (2021). Technical and environmental performance of eggshell lime for soil stabilization. Construction and Building Materials, 298: 1-12. https://doi.org/10.1016/j.conbuildmat.2021.123648
[18] Angboriboon, N.T., Unanuruksapong, R.K., Irivat, A.S. (2012). Preparation and properties of calcium oxide from eggshells via calcinations. Materials Science-Poland, 30: 313-322. https://doi.org/10.2478/s13536-012-0055-7
[19] Munirwan, R.P., Jaya, R.P., Munirwansyah, M., Ruslan, R. (2019). Performance of eggshell powder addition to clay soil for stabilization. International Journal of Recent Technology and Engineering, 8(3s3): 532-535. https://doi.org/10.35940/ijrte.C1094.1183S319
[20] Okonkwo, U.N., Odiong, I.C., Akpabio, E.E. (2012). The effects of eggshell ash on strength properties of cement-stabilized lateritic. International Journal of Sustainable Construction Engineering Technology, 3(1): 18-25. https://publisher.uthm.edu.my/ojs/index.php/IJSCET/article/view/41.
[21] Shiferaw, N., Habte, L., Thenepalli, T., Ahn, J.W. (2019). Effect of eggshell powder on the hydration of cement paste. Materials, 12(25): 1-12. https://doi.org/10.3390/ma12152483
[22] Vieira, T., Alves, A., de Brito, J., Correia, J.R., Silva, R.V. (2016). Durability-related performance of concrete containing fine recycled aggregates from crushed bricks and sanitary ware. Materials & Design, 90: 767-776. https://doi.org/10.1016/j.matdes.2015.11.023
[23] Kartini, K., Rohaidah, M.N., Zuraini, Z.A. (2012). Performance of ground clay bricks as partial cement replacement in grade 30 concrete. International Journal of Civil, Environmental, Structural, Construction and Architectural Engineering, 6(8): 569-72. https://doi.org/10.5281/zenodo.1057583
[24] Ge, Z., Wang, Y., Sun, R., Wu, X., Guan, Y. (2015). Influence of ground waste clay brick on properties of fresh and hardened concrete. Construction and Building Materials, 98: 128-136. https://doi.org/10.1016/j.conbuildmat.2015.08.100
[25] Bensaifi, E., Bouteldja, F., Nouaouria, M.S., Breul, P. (2019). Influence of crushed granulated blast furnace slag and calcined eggshell waste on mechanical properties of a compacted marl. Transportation Geotechnics, 20: 1-9. https://doi.org/10.1016/j.trgeo.2019.100244
[26] Hall, C. (1989). Water sorptivity of mortars and concretes: A review. Magazine of Concrete Research, 41(147): 51-61. https://doi.org/10.1680/macr.1989.41.147.51
[27] Celik, M.Y., Kacmaz, A.U. (2016). The investigation of static and dynamic capillary by water absorption in porous building stones under normal and salty water conditions. Environmental Earth Sciences, 75(4): 1-19. https://doi.org/10.1007/s12665-015-5132-x
[28] Cao, M., Ming, X., He, K., Li, L., Shen, S. (2019). Effect of macro, micro and nano-calcium carbonate on properties of cementitious composites-a review. Materials, 12(5): 1-20. https://doi.org/10.3390/ma12050781
[29] Wang, X.Y. (2018). Analysis of hydration and strength optimization of cement fly ash-limestone ternary blended concrete. Construction and Building Materials, 166: 130-140. https://doi.org/10.1016/j.conbuildmat.2018.01.058
[30] Jaber, H.A., Mahdi, R.S., Hassan, A.K. (2019). Influence of eggshell powder on the Portland cement mortar properties. Materials Today: Proceedings, 20(part4): 1-6. https://doi.org/10.1016/j.matpr.2019.09.153
[31] Zhu, J., Zhong, Q., Chen, G., Li, D. (2012). Effect of particle size of blast furnace slag on properties of Portland cement. Procedia Engineering, 27: 231-236. https://doi.org/10.1016/j.proeng.2011.12.448
[32] Siddique, R., Cachim, P. (2018). Waste and Supplementary Cementitious Materials in Concrete: Properties, and Applications. Woodhead Publishing Series in Civil and Structural Engineering, UK. https://doi.org/10.1016/C2016-0-04037-8
[33] Martys, N.S., Ferraris, C.F. (1997). Capillary transport in mortars and concrete. Cement and Concrete Research, 27(5): 747-760. https://doi.org/10.1016/S0008-8846(97)00052-5
[34] Bentz, D.P., Ehlen, M.A., Ferraris, C.F., Garboczi, E.J. (2001). Sorptivity based service life predictions for concrete pavements. In Proc., the 7th Int. Conf on Concrete Pavements, Orlando, Florida.
[35] Yang, L., Gao, D., Zhang, Y., Tang, J., Li, Y. (2019). Relationship between sorptivity and capillary coefficient for water absorption of cement-based materials: Theory analysis and experiment. Royal Sociey Open Science, 6: 1-12. https://doi.org/10.1098/rsos.190112
[36] Akçaözoğlu, S., Atiş, C.D., Akçaözoğlu, K. (2010). An investigation on the use of shredded waste PET bottles as aggregate in lightweight concrete. Waste Management, 30(2): 285-290. https://doi.org/10.1016/j.wasman.2009.09.033
[37] Seungwon, K., Yongjae, K., Muhammad, U., Cheolwoo, P., Asad, H. (2021). Durability of slag waste incorporated steel fiber-reinforced concrete in marine environment. Journal of Building Engineering, 33: 101641. https://doi.org/10.1016/j.jobe.2020.101641
[38] Ganesh, P., Ramachandra Murthy, A. (2019). Tensile behaviour and durability aspects of sustainable ultra-high performance concrete incorporated with GGBS as cementitious material. Construction and Building Materials, 197: 667-680. https://doi.org/10.1016/j.conbuildmat.2018.11.240
[39] Gu, K., Jin, F., Al-Tabbaa, A., Shi, B., Tang, C. (2016). Evaluation of sulfate resistance of calcined dolomite activated ground granulated blast furnace slag. Journal of Materials in Civil Engineering, 28(2): 04015135. https://doi.org/10.1061/(ASCE)MT.1943-5533.0001392
[40] Dadsetan, S., Bai, J. (2017). Mechanical and microstructural properties of self-compacting concrete blended with metakaolin, ground granulated blast-furnace slag and fly ash. Construction and Building Materials, 146: 658-667. https://doi.org/10.1016/j.conbuildmat.2017.04.158
[41] Sharma, R., Khan, R.A. (2018). Influence of copper slag and metakaolin on the durability of self compacting concrete. Journal of Cleaner Production, 171: 1171-1186. https://doi.org/10.1016/j.jclepro.2017.10.029
[42] Gu, L., Bennett, T., Visintin, P. (2019). Sulphuric acid exposure of conventional concrete and alkali-activated concrete: Assessment of test methodologies. Construction and Building Materials, 197: 681-692. https://doi.org/10.1016/j.conbuildmat.2018.11.166