Idir Ben Saidj* | Mohammed Nedjar | Smain Hocine | Ferhat Belabbas
© 2022 IIETA. This article is published by IIETA and is licensed under the CC BY 4.0 license (http://creativecommons.org/licenses/by/4.0/).
OPEN ACCESS
Polymers have always played a big role in the insulation of electrical machines and have been the focus of several studies when they are subjected to different stresses. The humidity and temperature are the main constraints that degrade the insulating performance of the materials when they act together causing hydrothermal aging of the polymers. This study deals with the influence of hydrothermal aging on the breakdown voltage of polyesterimide which is known as one of the most important factors which define the electrical insulation performance of the polymer. The breakdown test was executed under AC and DC voltage. A statistical analysis of breakdown data was carried out using the two-parameter Weibull distribution. According to the findings, the breakdown voltage changes with aging time. Its rise is due to a polymer crosslinking by thermal action, causing a reduction of the mean-free path of charge carriers decreasing their mobility. The decline is attributed to the material plasticization after water penetration into the polymer matrix at the beginning of aging, which is a physical effect. Eventually, the chemical effect reflects the hydrolysis reaction, which destroys the hydrogenous links of the polymer. The breakdown voltage under the DC ramp is higher than that obtained under the AC ramp. The DC breakdown voltage depends on the polarity of the applied electrical field. The polymer degradation is characterized by a change in color and the crumbling of samples.
polyesterimide, hydrothermal aging, breakdown voltage, Weibull statistics, degradation
Nowadays, polymers are widely used in electrical devices such as electrical cables, motors, generators, etc., because of their excellent electrical and mechanical properties [1]. They perform a crucial function as solid insulating materials.
Insulating materials such as polyesterimide, polyamideimide, and polyimide are commonly used to insulate electrical machine windings. They are chosen because of many factors, including the working environment, applied voltage, rotation speed, and operating temperature.
Polyesterimide is a polymer that is widely utilized in electrical equipment. It has higher abrasion resistance, and excellent insulating characteristics [2].
However, these materials are subjected to various stresses (electrical, thermal, mechanical, and environmental), leading to the degradation in time of these polymers and thence to failures. The degradation of the polymer properties is named "aging phenomenon."
The principal stresses that can affect the performances of these insulators by an irreversible deterioration are temperature and humidity, which can act separately, leading to thermal aging by heat, hydrolytic aging by moisture, or in combination resulting in hydrothermal aging. These different types of aging are significant tests in the evaluation of electrical insulation systems.
Many authors have studied the thermal aging of polyesterimide. A decrease in the dielectric strength of polyesterimide with aging time has been mentioned by Brandes et al. [3] after exposing the material to different temperatures (155-220℃). A change in thickness and viscosity of polymer has been reported. The thermal index is 188℃. Araki and Taguchi [4] have explored the deterioration of twisted pair samples of polyesterimide aged at 230℃. The findings demonstrate no substantial change in dielectric strength during the early stages of aging. However, it increases and then decreases rapidly as aging progresses. This phenomenon is linked to material crosslinking due to thermal aging. The degradation is followed by a reduction in the dielectric layer thickness.
The thermal lifetime of polyesterimide has been studied by Nedjar [5]. The results show the evolution of breakdown versus thermal constraint. Its rise is related to polymer crosslinking, and its decline is attributed to the reduction of viscosity. The graph of thermal endurance is a straight line. The activation energy has been calculated, and the temperature index is 182℃.
Hydrolytic aging of polyesterimide is rarely studied, and the presence of moisture is accepted as hastening polymer degradation. It was reported that water could have three kinds of effects [6]. The first is physical: plasticization of the material showing a weakening of the molecular bonds. The second is chemical: hydrolysis of ester and amide bonds. The third is photochemical: generation of hydroxyl radicals. The hydrolytic degradation of polyester urethane elastomers is due to the acid-catalyzed hydrolysis of the ester group [7]. Samples of polyesterimide have been exposed to hydrolytic aging for 3000 hours under 90% relative humidity (RH) at 30℃ temperature [8]. The investigation reports that the breakdown voltage varies with hydrolytic exposure time. The difference between the breakdown voltage under AC and DC ramp and between the DC polarities has been reported. It was claimed that the water content of XLPE and TR-XLPE grows with aging time, and a drop of AC breakdown voltage with increasing water absorption was observed [9]. The penetration of water in the XLPE cable slices causes the generation of water trees [10].
Several authors have investigated hydrothermal aging of insulating solids. Researchers reported results on hydrothermal aging of polyesters and polyamides [11]. Other authors studied the degradation of polyvinyl chloride subjected to the combined action of temperature and humidity [12, 13]. Brun et al. [14] reported a decrease in modulus of elasticity and glass transition temperature of epoxy and silica composite material. The dielectric strength of wet materials can diminish by a factor of 5 to 10 compared to dried ones. Roggendorf et al. [15] measured dielectric loss factor, permittivity, and dielectric strength during hydrothermal aging. The water absorption in the polymer was evaluated.
Breakdown voltage is considered the most important dielectric property to define the insulating performance of the polyesterimide. The humidity and the temperature are the main stresses which can affect aggressively the material when they act together leading to hydrothermal aging of the polymer. This work aims to study the influence of hydrothermal aging on the breakdown voltage of polyesterimide. The results obtained show that the factor which affects the rise of breakdown voltage the most is the thermal effect, while its decrease is due to water absorption. The results demonstrate also that AC breakdown voltage is lower than DC one. It has also been noted that polarity affects the breakdown voltage under the DC ramp.
2.1 Samples preparation
The samples were prepared following IEC 60851-5 [16]. A copper wire coil insulated with a 41 µm polyesterimide layer of class H (180℃) of grad 2 supplied by "TREFICUIVRE" company (Algerian manufacturer) was used. Eight turns of twists of 125 mm were made using a wire length of 400 mm having a diameter of 1.06 mm. Twists were made with a coil lathe with a force of 13.5 N. The specimens were inspected under a microscope before the tests to avoid micro-fissures that can serve as partial discharge sites.
2.2 Hydrothermal aging
Several samples were made as described earlier, and they were immersed in two open water containers. The two containers were placed in two different ventilated air ovens set at 90℃ and 100℃, respectively. The water was renewed every 24 hours. Aging was executed for 8500 h at 90℃ and 7500h at 100℃. After each aging time, a population of 50 specimens was taken. The samples were transferred to desiccators containing newly regenerated silicone gel, conditioned for 24 h to remove moisture, and then subjected to electrical breakdown.
2.3 Dielectric breakdown test
The dielectric breakdown test was performed in air, and at room temperature, with a high voltage generator under alternative voltage, 50 Hz (AC), and direct voltage (DC) of positive and negative polarity. One conductor is connected to the AC or DC terminal of the generator, and the other conductor is connected to the ground terminal of the generator. The voltage is uniformly increased at a rate of 0.5 kV/s according to IEC 60851-5 [16].
3.1 Statistical model of Weibull
The model largely used in statistical studies of dielectric strength of solid dielectrics is the Weibull model [17, 18]. This type of distribution will be used in the following study. The cumulative probability P (V), currently employed to analyze dielectric strength data, is the two-parameter Weibull distribution, provided by the following relation [18-20]:
$P(V)=1-\exp \left[-\left(\frac{V}{\alpha}\right)^{\beta}\right]$ (1)
where:
Eq. (1) may be transformed to the following form:
$\log \left(\ln \left(\frac{1}{1-P(V)}\right)\right)=\beta \log (V)-\beta \log (\alpha)$ (2)
Eq. (2) is an equation of a straight line:
$Y=a X+b$ (3)
By identification between (2) and (3), we find:
$X=\log (V)$ (4)
$Y=\log \left(\ln \left(\frac{1}{1-P(V)}\right)\right)$ (5)
The experimental data plot must be a straight line of the coordinate system above, where P is the cumulative breakdown probability.
We note that for $\mathrm{Y}=0, \mathrm{~V}=\alpha=\mathrm{V}_{\mathrm{b}}$.
$P\left(V_{b}\right)=1-e^{-1}=63.2 \%$ (6)
$\mathrm{V}_{\mathrm{b}}$ is the nominal breakdown voltage.
In this study, the two-parameter Weibull distribution was used to plot the measured values of breakdown voltage. The data were arranged in ascending order, starting with the smallest and working up to the greatest. For any value Vi, the cumulative breakdown probability is determined using the following relationship [17, 21, 22]:
$P_{i}=\frac{i}{N+1} 100 \%$ (7)
where:
In this work, N was fixed equal to 50.
3.2 Maximum likelihood method
The maximum likelihood method estimation is a well-known method to treat data of dielectric breakdown.
The two parameters of a Weibull distribution were found by using a likelihood function L [23]:
$L(\alpha, \beta)=\prod_{i=1}^{N} \frac{\beta}{\alpha}\left(\frac{V_{i}}{\alpha}\right)^{\beta-1} \exp \left[-\left(\frac{V_{i}}{\alpha}\right)^{\beta}\right]$ (8)
To find the maximum likelihood estimation for the parameters $\alpha$ and $\beta$ in Eq. (8), we must solve the system of equations as follows:
$\frac{\partial \log (L(\alpha, \beta))}{\partial \alpha}=0$, (9)
$\frac{\partial \log (L(\alpha, \beta))}{\partial \beta}=0$ (10)
The unknowns of the equation system are $\alpha$ and $\beta$ .
4.1 Statistical analysis
Statistical analysis of the breakdown values $V_{b}$ was made using the Weibull model with two parameters and for different voltage forms (AC, DC positive, DC negative). We use the likelihood technique to estimate the scale and shape parameters α and β and get the best linear fit of Weibull plots presented with their equations in Table 1.
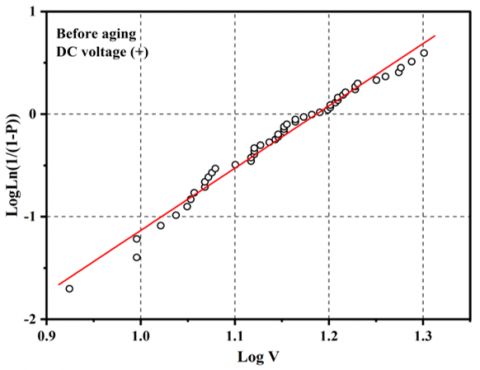
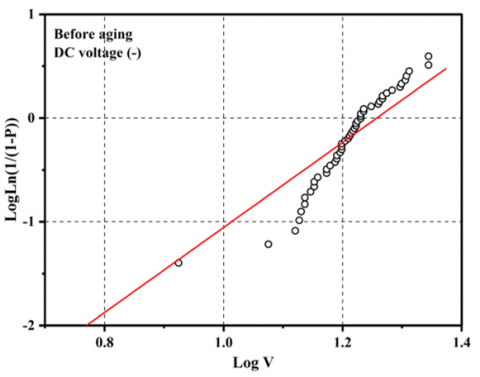
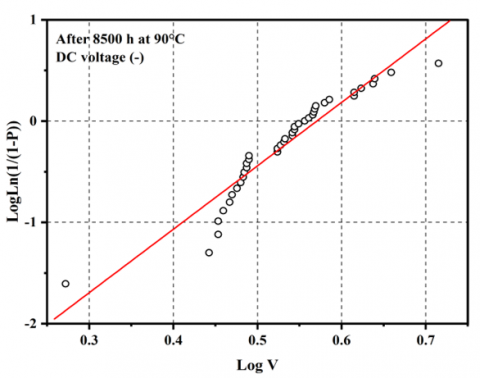
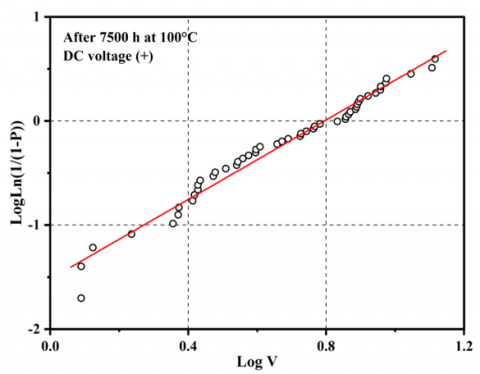
Figure 1 (a-c), Figure 2 (a-c), and Figure 3 (a-c) show some examples of Weibull graphs of breakdown voltage under AC and DC electric field, before aging, after 8500h at 90℃, and after 7500 h at 100℃, respectively.
Figure 1 (a-c) shows the Weibull diagram of LogLn(1/(1-p)) as a function of Log V of each 50 values of the breakdown voltage of polyesterimide under AC (50 Hz), DC(+), and DC (–) voltage before aging.
Figure 2 (a-c) presents LogLn (1/(1-p)) as a function of Log V of every 50 values of the breakdown voltage of specimens under AC (50 Hz), DC(+), and DC (–) voltage after 8500 h of aging at 90℃.
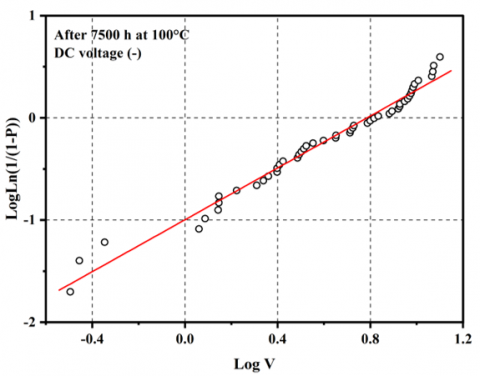
Figure 3 (a-c) indicates LogLn (1/(1-p)) as a function of Log V of every 50 values of the breakdown voltage of polyesterimide under AC (50 Hz), DC(+), and DC (–) voltage after 7500 h of aging at 100℃.
Table 1 summarizes the statistical analysis results. The values of Weibull parameters or breakdown voltage, shape parameters, and the equation of each Weibull graph, according to each aging state of the sample and voltage form to which it was subjected are indicated in Table 1. The parameters differ from one distribution to the next. The shape parameters values are similar to those previously published [24].
(a)
(b)
(c)
Figure 1. Weibull diagram of the breakdown voltage before aging under (a) AC voltage, (b) DC voltage of positive polarity, and (c) DC voltage of negative polarity
(a)
(b)
(c)
Figure 2. Weibull diagram of the breakdown voltage after 8500 h of aging at 90℃ under (a) AC voltage, (b) DC voltage of positive polarity, and (c) DC voltage of negative polarity
(a)
(b)
(c)
Figure 3. Weibull diagram of the breakdown voltage after 7500 h of aging at 100℃ under (a) AC voltage, (b) DC voltage of positive polarity, and (c) DC voltage of negative polarity
Table 1. Values of nominal breakdown voltage, shape parameter, and equation of Weibull plot
|
Aging state |
Voltage form |
Nominal breakdown voltage (kV) |
Shape parameter $\boldsymbol{\beta}$ |
Equation of Weibull graph |
|
Before aging |
AC 50 Hz |
10.199 |
5.814 |
Y = 5.814X – 5.864 |
|
DC (+) |
15.370 |
6.071 |
Y = 6.071X – 7.205 |
|
|
DC (–) |
18.071 |
4.039 |
Y = 4.039X – 5.086 |
|
|
After 8500 h at 90℃ |
AC 50 Hz |
2.542 |
3.856 |
Y = 3.856X – 1.563 |
|
DC (+) |
3.855 |
4.763 |
Y = 4.763X – 2.792 |
|
|
DC (–) |
3.715 |
6.263 |
Y = 6.263X – 3.573 |
|
|
After 7500 h at 100℃ |
AC 50 Hz |
4.745 |
2.129 |
Y = 2.129X – 1.440 |
|
DC (+) |
6.233 |
1.910 |
Y = 1.910X – 1.518 |
|
|
DC (–) |
6.103 |
1.269 |
Y = 1.269X – 0.997 |
(a)
(b)
(c)
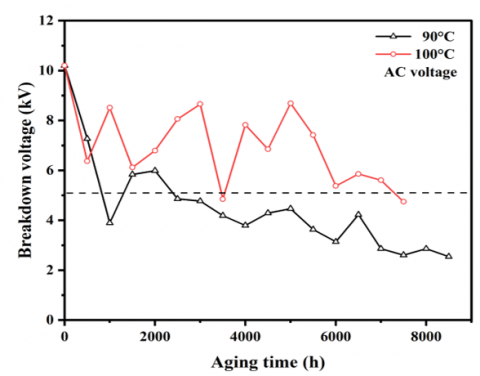
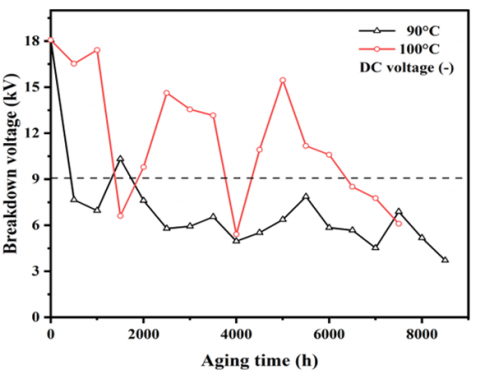
Figure 4. Variation of the breakdown voltage versus the aging time at 90℃ and 100℃ under (a) AC voltage, (b) DC voltage of positive polarity, and (c) DC voltage of negative polarity. The dotted line corresponds to a 50% decrease in breakdown voltage
(a)
(b)
(c)
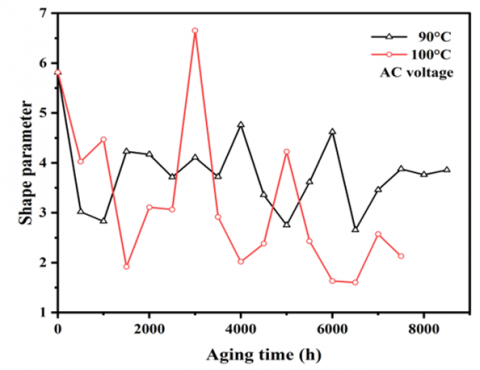
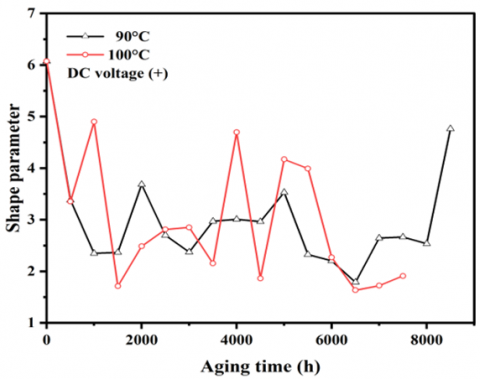
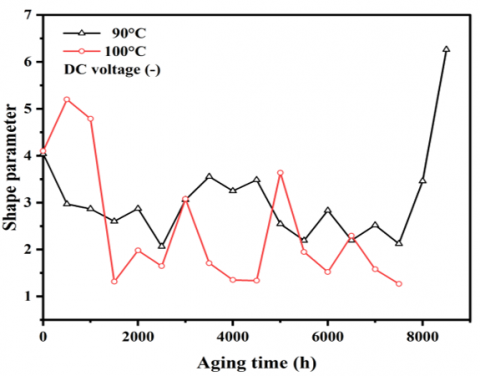
Figure 5. Variation of the shape parameter versus the aging time at 90℃ and 100℃ under (a) AC voltage, (b) DC voltage of positive polarity, and (c) DC voltage negative polarity
4.2 Variation of breakdown voltage versus aging time
The evolution of breakdown voltage as a function of aging time (t) at 90℃ and 100℃ under AC (50 Hz) and DC ramp of positive and negative polarity are presented in Figure 4 (a-c).
4.2.1 Breakdown voltage under AC (50 Hz) ramp
The variation of breakdown voltage versus aging time under AC (50 Hz) ramp (Vac) is presented in Figure 4 (a).
At 90℃, breakdown voltage decreases abruptly at the beginning of aging from 10.199 kV to 3.89 kV, then increases to 5.987 kV after 2000 h. Beyond this time, Vac decreases slowly until 3.139 kV and grows up to 4.223 kV. Then it decreases to reach the lowest level at 2.542 kV after 8500 h of aging. The maximum variation is 75%.
At 100℃, Vac first decreases from 10.199 kV to 6.366 kV, then raises to 8.513 kV and decreases to 6.115 kV at 1500 h. After this time, Vac follows the following sequence: Vac increases to reach 8.657 kV, decreases suddenly to 4.85 kV, rises to 7.823 kV after 3500 h, decreases to 6.85 kV, and finally increases to 8.687 kV after 5000 h. Beyond this time, Vac falls to 4.745 kV after an aging time of 7500 h. The maximum variation is 53.47%.
4.2.2 Breakdown voltage under DC ramp of positive polarity
Figure 4 (b) shows the variation of breakdown voltage as a function of aging time under DC ramp of positive polarity (Vdc+).
At 90℃, in the beginning, breakdown voltage decreases rapidly from 15.37 kV to 6.54 kV and then increases to 9.313 kV after 1500h. Beyond this, Vdc+ drops to 4.858 kV and rises to 7.004 kV, then lowers to 4.535 kV and grows to 6.8 kV after 6000 h. It then decreases to reach the minimum at 3.212 kV and increases to 6.483 kV at 7500 h. Finally, Vdc+ decreases to 3.855 kV after 8500 h. The maximum variation is 74.91%.
At 100℃, Vdc+ decreases slightly from 15.37 kV to 14.109 kV and increases to 16.353 kV and then decreases suddenly to 9.162 kV after 1500 h. After this, it overgrows to reach a maximum of 17.823 kV at 2500 h. After this peak, Vdc+ lowers abruptly to 8.338 kV and rises quickly and reaches two heights of 16.998 kV and 16.248 k V correspon-ding to 4000 h and 5000 h, respectively. After this time, Vdc+ diminishes rapidly until 6.233 kV after 7500 h. The maximum variation is 59.44%.
4.2.3 Breakdown voltage under DC ramp of negative polarity
The evolution of breakdown voltage as a function of aging time under DC ramp of negative polarity (Vdc–) is shown in Figure 4 (c).
At 90℃, during thousand hours of aging, Vdc– decreases abruptly from 18.071 kV to 6.955 kV, then increases to 10.322 kV after 1500 h. Beyond this time, it diminishes until 4.955 kV corresponding to t= 4000 h. After this time, it rises to 7.868 kV, then lowers to 3.715 kV after 8500 h of aging. The maximum variation is 79.44%.
At 100℃, Vdc– decreases slightly from 18.071 kV to 17.418 kV after 1000 h. Beyond this, it drops suddenly to 6.611 kV and then increases to 14.621 kV after 2500 h. After this, it decreases rapidly to reach a minimum of 5.406 kV at 4000 h and grows again to 15.463 kV after 5000 h. After this time, Vdc– diminishes quickly until 6.103 kV after 7500 h. The maximum variation is 66.22%.
4.3 Evolution of shape parameter versus aging time
Figure 5 (a-c) demonstrates the dependence of shape parameter β on the aging time at 90℃ and 100℃ under AC and DC ramps of positive and negative polarity.
4.3.1 Shape parameter under AC (50 Hz) ramp
The evolution of shape parameter versus aging time under AC (50 Hz) ramp (βac) is shown in Figure 5 (a).
At 90℃, the shape parameter βac decreases abruptly from 5.814 to 2.829, then increases to 4.227 and stabilizes around this value until 3500 h. After this time, βac rises to 4.76 and then lowers to 2.751 after 5000 h. Beyond this, it grows to 4.622, then diminishes to 2.656 and rises again to 3.856 after 8500 h. The maximum variation is 33.67%.
At 100℃, the shape parameter decreases rapidly from 5.814 to 1.915 and then grows to reach a maximum of 6.652 for t= 3000 h. After this peak, βac decreases abruptly to 2.017, then increases to 4.225 and diminishes again to 1.601 after 6500 h. Beyond this, it rises to 2.571 and decreases to 2.129 after an aging time of 7500 h. The maximum variation is 63.38%.
4.3.2 Shape parameter under DC ramp of positive polarity
The evolution of the shape parameter as a function of aging time under DC ramp of positive polarity (βdc+) is presented in Figure 5 (b).
At 90℃, βdc+ decreases rapidly from 6.071 to 2.366 and then increases to 3.684 for t= 2000 h. Beyond this, it decreases to 2.374 and grows slowly up to 3.529 after 5000 h. After this time, βdc+ diminishes until 1.787, then rises again to 2.643 and stays fixed around this value, and then it increases abruptly to 4.763 after 8500 h of aging. The maximum variation is 21.54%.
At 100℃, the shape parameter decreases from 6.071 to 3.351 and increases to 4.9 after 1000 h. After this, βdc+ decreases abruptly to 1.711 and rises slowly to 2.851 at 3000 h. Beyond this, it decreases to 2.152 and grows again to 4.696 to come back to 1.862 and then increases to 4.169 after 5000 h. Beyond this time, βdc+ drops to 1.91 after 7500 h. The maximum variation is 68.53%.
4.3.3 Shape parameter under DC ramp of negative polarity
Figure 5 (c) illustrates the changing of shape parameter versus aging time under DC ramp of negative polarity (βdc–).
At 90℃, the shape parameter decreases from 4.039 to 2.601, increases slightly to 2.873, and lowers to 2.066 for t=2500 h. Beyond this, βdc– grows slowly up to 3.483 and then diminishes until 2.546 after 5000 h. After this time, it remains practically stable around an average of 2.373 until 7500 h. It increases and reaches a maximum of 6.263 after an aging time of 8500 h. The maximum variation is 55.06%.
At 100℃, βdc–increases from 4.039 to 5.199 and decreases rapidly to 1.314 after 1500 h. After this, it grows to 3.076, then decreases to 1.336 and rises to 3.638, corresponding to t= 5000 h. Beyond this time, βdc– diminishes until 1.52 after 6000 h, then increases to 2.296 and decreases to 1.269 after 7500 h of aging. The maximum variation is 68.58%.
The results show the Weibull diagrams of the breakdown voltage, the variation of the breakdown voltage, and the shape parameter of polyesterimide versus the hydrothermal aging time under AC and DC electric fields, at two different temperatures of 90℃ and 100℃. These results are interpreted as follows:
1. The Weibull graphs of voltage breakdown lead to a large dispersion of experimental points in the low probabilities. These results are in line with what is found in the literature.
2. The breakdown voltage changes with aging time. Its rise is linked to the polymer rearrangement and crosslinking by the thermal action, causing a reduction of the mean-free path of charge carriers and decreasing their mobility. A decrease in breakdown voltage is due to the material plasticization by the water absorption, reducing the molecular bonds and increasing the free volume.
3. The magnitude of breakdown voltage under the AC ramp is less under the DC ramp. The phenomenon is partly due to the difference in dissipated energy between the two types of electric field and in part due to the fatigue caused by AC constraint. This phenomenon has been reported by Crine [25]. Gockenbach and Schillet [26] claimed that the DC breakdown voltage of XLPE cable is greater than that observed in an AC electric field.
4. Obviously, the breakdown voltage under the DC ramp depends on the polarity [27, 28]. This phenomenon is explained by the amplitude and space charge distribution among the electrodes varying with the polarity of the applied voltage [29].
5. Under AC and DC rump conditions, the breakdown voltage at 100℃ oscillates from the beginning until 5000 h. Beyond this time, it decreases to less than 50% of its original value. This irreversible diminution is related to the rise of water amount within the polymer, which can partly facilitate the initiation of water trees, leading to reduced breakdown voltage, and partly the hydrolysis reaction of polyesterimide because of the presence of the hydrolyzable ester and imide groups. Abderrazzaq [30] reported that water trees could be initiated and developed within polyester resin by simultaneous action of moisture and alternating electric field. Douar et al. [31] have explained that moisture absorption is the main reason for the breakdown voltage decreasing for polyamides, and their hydrolysis is caused by excessive moisture absorption because of the presence of amide groups which attracts water molecules.
6. The reduction of breakdown voltage at 90°C under 50% is earlier compared to 100℃. It is around 2000 h, and 7000 h for 90℃, and 100℃, respectively. The structure of the absorbed water at 90℃ stays in its original state and accelerates the material conductivity. In contrast, at 100℃, the absorbed water is divided into small entities because of the scission of hydrogenous links.
7. The curves giving the shape parameter as a function of aging time have an irregular evolution with the presence of several peaks. These variations reflect the random distribution of defects within the dielectric during aging. The rearrangements in the molecular structure of material explain the increase in the shape parameter. In contrast, its decrease is allotted to the rise in the defect size and the kind of defect. Coppard et al. [32] established that the shape parameter is linked to the size diffusion of the defects in polyethylene. Also, Katsuta et al. [33] revealed that the shape parameter depends on the kind and size of defects in XLPE cable.
8. The shape parameter at 100℃ presents several minimum values compared to 90℃. This phenomenon can be explained by the size augmentation of the defects caused by the thermal action. Fabiani and Simoni [34] reported that thermal aging could significantly produce the size enlargement of micro-cracks and voids in the material.
9. The shape parameter at 90℃ varies until 5500 h. After this time, it decreases irreversibly, which can be attributed to the diminution of defects caused by the rearrangement and crystallization of the polymer structure.
10. The polymer degradation is characterized by a change in color of the material from yellow to brown and then to black. In advanced aging times, we even noticed the crumbling of test specimens.
This paper mainly investigates the effect of hydrothermal aging on the breakdown voltage of polyesterimide which varies with aging time. Water absorption accelerates the degradation. The rise of breakdown voltage is ascribed to crosslinking and rearrangement of the polymer by thermal action. In contrast, its decrease is attributed to the physical effect of water at the beginning of aging, characterized by the plasticization of the material and eventually chemical effect reflecting the hydrolysis reaction, which destroys hydrogenous links inducing a significant reduction in breakdown voltage. The DC breakdown voltage was higher than that under the AC ramp. This difference was linked to the different dissipated energies in the two types of electric fields and the fatigue caused by the AC voltage. The breakdown voltage under the DC ramp depends on the polarity. The difference in space charges created under the two polarities is attributed to this phenomenon.
The shape parameter varies with the aging time. Its growth is related to the molecular structure arrangements. In contrast, its fall is owing to an increase in the size of defects. Temperature affects the shape parameter and the thermal action produces the size enlargement of the defects inside the material.
Polyesterimide degradation is accompanied by a change in color of the polymer and the appearance of cracks induced by the scission reaction of imide and ester bonds.
We thank Mr Bentaha Djillali, PDG of Entreprise Nationale d’ELectro-industies (ENEL), Azazga, Tizi-Ouzou, Algeria for sponsoring this project.
[1] Haque, S.K., Ardila-Rey, J.A., Umar, Y., Mas’ud, A.A., Muhammad-Sukki, F., Jume, B.H., Rahman, H., Bani, N.A. (2021). Application and suitability of polymeric materials as insulators in electrical equipment. Energies, 14(10): 2758. https://doi.org/10.3390/en14102758
[2] Lian, Z., Niu, H., Li, S. (2019). Detection of ageing effect in polyesterimide by terahertz time-domain spectroscopy. IEEE Transactions on Terahertz Science and Technology, 9(6): 651-658. https://doi.org/10.1109/TTHZ.2019.2941125
[3] Brandes, H., Hillmer, T., Frost, N., Mesrobian, A. (2006). Class H insulation system for rotating equipment. Conference Record of the 2006 IEEE International Symposium on Electrical Insulation, pp. 346-349. https://doi.org/10.1109/ELINSL.2006.1665329
[4] Araki, C., Taguchi, T. (1993). Thermal degradation of polyester-imide magnet wire. Proceedings of IEEE Conference on Electrical Insulation and Dielectric Phenomena-(CEIDP'93), pp. 526-531. https://doi.org/10.1109/CEIDP.1993.378919
[5] Nedjar, M. (2011). Investigation in thermal endurance of polyesterimide used in electrical machines. Journal of Applied Polymer Science, 121(5): 2886-2892. https://doi.org/10.1002/app.33904
[6] Yang, X.F., Tallman, D.E., Croll, S.G, Bierwagen, G.P. (2002). Morphological changes in polyurethane coatings on exposure to water. Polymer Degradation and Stability, 77(3): 391-396. https://doi.org/10.1016/S0141-3910(02)00084-8
[7] Xie, F., Zhang, T., Bryant, P., Kurusingal, V., Colwell, J.M., Laycock, B. (2019). Degradation and stabilization of polyurethane elastomers. Progress in Polymer Science, 90: 211-268. https://doi.org/10.1016/j.progpolymsci.2018.12.003
[8] Nedjar, M., Mecheri, Y., Lamure, A., Aufray, M., Drouet, C. (2010). Effect of moisture on breakdown voltage of polyesterimide used in electrical machines. 2010 Annual Report Conference on Electrical Insulation and Dielectic Phenomena, pp. 1-4. https://doi.org/10.1109/CEIDP.2010.5724018
[9] Nikolajevic, S.V., Kostoski, D.D. (1998). Accelerated aging of cross-linked polyethylene (XLPE and TR XLPE) cable insulations in wet conditions. 1998 Annual Report Conference on Electrical Insulation and Dielectric Phenomena (Cat. No. 98CH36257), 2: 694-697. https://doi.org/10.1109/CEIDP.1998.732992
[10] Chauvet, C., Laurent, C., Mayoux, C. (1989). Influence of wet ageing on the electrical breakdown strength of XLPE cable slices. Conference on Electrical Insulation and Dielectric Phenomena, pp. 230-234. https://doi.org/10.1109/CEIDP.1989.69551
[11] Abeysinghe, H.P., Edwards, W., Pritchard, G., Swampillai, G.J. (1982). Degradation of crosslinked resins in water and electrolyte solutions. Polymer, 23(12): 1785-1790. https://doi.org/10.1016/0032-3861(82)90123-9
[12] Djidjelli, H., Kaci, M., Sadoun, T., Benachour, D., Farenc, J., Martinez‐Vega, J.J. (2001). Effect of hydrothermic ageing on dielectric and mechanical properties of rigid poly (vinyl chloride). Macromolecular Materials and Engineering, 286(7): 407-411. https://doi.org/10.1002/1439-2054(20010701)286:7<407::AID-MAME407>3.0.CO;2-F
[13] Djidjelli, H., Kaci, M., Boukerrou, A., Benachour, D., Martinez‐Vega, J.J. (2003). Hydrothermic aging of plasticized poly (vinyl chloride): Its effect on the dielectric, thermal, and mechanical properties. Journal of Applied Polymer Science, 89(13): 3447-3457. https://doi.org/10.1002/app.12554
[14] Brun, E., Rain, P., Teissedre, G., Guillermin, C., Rowe, S. (2007). Hygrothermal aging of a filled epoxy resin. 2007 IEEE International Conference on Solid Dielectrics, pp. 239-242. https://doi.org/10.1109/ICSD.2007.4290796
[15] Roggendorf, C., Kessler, M., Schulte, S., Schnettler, A. (2010). Accelerated test procedures for hydrothermal aging. 2010 IEEE International Symposium on Electrical Insulation, pp. 1-5. https://doi.org/10.1109/ELINSL.2010.5549754
[16] IEC 60851-5 Edition 4.1. (2011). Winding wires - Test methods - Part 5: Electrical properties.
[17] Yang, K., Liu, Y., Yan, Z., Tian, Y., Liu, Y., Jing, Z., Li, J., Li, S. (2020). Enhanced morphology-dependent tensile property and breakdown strength of impact polypropylene copolymer for cable insulation. Materials, 13(18): 3935. https://doi.org/10.3390/ma13183935
[18] Chang, F. (2006). Electrical properties of flexible polypropylene based cable insulation materials. Journal of Materials Science, 41(7): 2037-2043. https://doi.org/10.1007/s10853-006-4504-8
[19] Englund, V., Huuva, R., Gubanski, S.M., Hjertberg, T. (2009). High efficiency voltage stabilizers for XLPE cable insulation. Polymer Degradation and Stability, 94(5): 823-833. https://doi.org/10.1016/j.polymdegradstab.2009.01.020
[20] Wu, K., Wang, Y., Cheng, Y., Dissado, L.A., Liu, X. (2010). Statistical behavior of electrical breakdown in insulating polymers. Journal of Applied Physics, 107(6): 064107. https://doi.org/10.1063/1.3342468
[21] Ugur, M., Kuntman, A., Ersoy, A. (2003). Study on the ageing process for polyester resin using improved Weibull statistics. Electrical Engineering, 85(5): 283-288. https://doi.org/10.1007/s00202-003-0175-5
[22] Tuncer, E., James, D.R., Sauers, I., Ellis, A.R., Pace, M.O. (2006). On dielectric breakdown statistics. Journal of Physics D: Applied Physics, 39(19): 4257. https://doi.org/10.1088/0022-3727/39/19/020
[23] Cohen, A.C. (1965). likelihood estimation in the Weibull distribution based on complete and on censored samples. Technometrics, 7(4): 579-588. https://doi.org/10.1080/00401706.1965.10490300
[24] Ramu, T.S., Wertheimer, M.R. (1986). Dielectric properties of plasma-polymerized hexamethyldisiloxane films: 2 dielectric breakdown. IEEE Transactions on Electrical Insulation, EI-21(4): 557-563. https://doi.org/10.1109/TEI.1986.348958
[25] Crine, J.P. (2008). AC and DC electrical aging of polyethylene. 2008 Annual Report Conference on Electrical Insulation and Dielectric Phenomena, pp. 60-62. https://doi.org/10.1109/CEIDP.2008.4772797
[26] Gockenbach, E., Schiller, G. (1996). The influence of the material conditions on the breakdown behaviour of XLPE-samples at voltages of different shapes. Conference Record of the 1996 IEEE International Symposium on Electrical Insulation, 2: 608-611. https://doi.org/10.1109/ELINSL.1996.549419
[27] Crine, J.P. (2005). On the interpretation of some electrical aging and relaxation phenomena in solid dielectrics. IEEE Transactions on Dielectrics and Electrical Insulation, 12(6): 1089-1107. https://doi.org/10.1109/TDEI.2005.1561789
[28] Crine, J.P. (2007). A molecular model for the electrical aging of XLPE. 2007 Annual Report-Conference on Electrical Insulation and Dielectric Phenomena, pp. 608-610. https://doi.org/10.1109/CEIDP.2007.4451572
[29] Laifaoui, A., Herzine, M.S., Zebboudj, Y., Reboul, J.M., Nedjar, M. (2014). Breakdown strength measurements on cylindrical polyvinyl chloride sheaths under AC and DC voltages. IEEE Transactions on Dielectrics and Electrical Insulation, 21(5): 2267-2273. https://doi.org/10.1109/TDEI.2014.004190
[30] Abderrazzaq, M.H. (2005). Development of water tree structure in polyester resin. IEEE Transactions on Dielectrics and Electrical Insulation, 12(1): 158-165. https://doi.org/10.1109/TDEI.2005.1394026
[31] Douar, M.A., Béroual, A., Souche, X. (2014). Comparative study of AC breakdown voltage for various polymers: Influence of electrodes shape, thermal and hydrothermal ageing. 2014 ICHVE International Conference on High Voltage Engineering and Application, pp. 1-4. https://doi.org/10.1109/ICHVE.2014.7035502
[32] Coppard, R.W., Bowman, J., Dissado, L.A., Rowland, S.M., Rakowski, R.T. (1990). The effect of aluminium inclusions on the dielectric breakdown of polyethylene. Journal of Physics D: Applied Physics, 23(12): 1554. https://doi.org/10.1088/0022-3727/23/12/011
[33] Katsuta, G., Toya, A., Katakai, S., Kanaoka, M., Sekii, Y. (1991). Influence of defects on insulating properties of XLPE cable. [1991] Proceedings of the 3rd International Conference on Properties and Applications of Dielectric Materials, pp. 485-489. https://doi.org/10.1109/ICPADM.1991.172103
[34] Fabiani, D., Simoni, L. (2005). Discussion on application of the Weibull distribution to electrical breakdown of insulating materials. IEEE Transactions on Dielectrics and Electrical Insulation, 12(1): 11-16. https://doi.org/10.1109/TDEI.2005.1394010