Assia Aidoud* | Messaouda Bencheikh | Nacera Khaldi | Ilyess Mouhamed Ahmed Herga
© 2021 IIETA. This article is published by IIETA and is licensed under the CC BY 4.0 license (http://creativecommons.org/licenses/by/4.0/).
OPEN ACCESS
The South of Algeria is known for these immense sand dunes, which cover part of its territory (Sahara). The main objective of this study is the recovery of sands dune and wood waste (sawdust). The latter, which constitutes a potential source of several environmental and economic problems. The objective of this present work is to characterize the physico-mechanical properties at a young age of a dune sand-based mortar lightened by wood waste and to examine the suitability of using it for various applications in the construction of buildings. The improvement of the characteristics of these sands, which essentially formed of sand untapped to date and with the sole aim of enhancing this national sand wealth. The formulation of the mixtures is based on the substitution of dune sand by sawdust, at different weight contents 0, 10, 20 and 30%. The quantity of cement is fixed at 450 g. The results obtained show firstly that the introduction of sawdust improves the characteristics of the mixture (grain size tends to be spread out, reduction in densities), and secondly the physico-mechanical characteristics, especially at 30% substitution (reduction absorption by total immersion of 20.50%, porosity of 28.32%, wet density of 1.73% and dry density of 14.94% and increase in tensile strength of 61.43% and in compression of 63.87%). The effect of sawdust on the relationships between the properties of mortars was clearly noted either for the relationships between early strengths or between compressive and tensile strengths.
sawdust, mortar, absorption, porosity, resistance
The evolution of the current world forces us to rethink construction methods. Indeed, today, the construction sector consumes a significant amount of energy. It is responsible for about a quarter of carbon dioxide emissions, not to mention the depletion of non-renewable resources. This sector must therefore innovate to limit its impact on the environment while guaranteeing user comfort [1]. Several investigations have been attempted with the aim of using overabundant sand from the dunes in the construction sector, particularly in Algeria and Africa, which have been the subject of research [2].
The universal need to protect the environment and manage natural resources well requires establishing new laws and adapting new concepts. The recovery of natural materials and the recycling of waste are an effective means in the face of the economic and ecological constraints of recent years [3]. Faced with the context of environmental protection and like all industrial and household waste, waste from wood processing industries will have to be recovered and valued [4]. Many products already exist on the market, but knowledge in this field is still limited and studies must be carried out in order to better understand certain mechanisms and improve the properties of these materials [5].
The materials used for the preparation of the mixtures and the making of the various mortars are of local origin, whose preliminary characteristics are presented in Table 1. A witness sand mortar and three mortars composed in a manner substituted dune sand (DS) with different percentages of sawdust (0, 10, 20 and 30%) respectively. With a stabilization treatment of sawdust before mixing the mortar pastes. This treatment consists of soaking the wood residues in water for 24 hours before use, for each composition Table 2 were the subject of this comparative study at young age (7, 14, 21 and 28 days). The tests concerned the determination of some physico-mechanical properties of early-age mortars (porosity, absorption, wet and dry densities, compressive strength, tensile strength). All the tests were carried out on prismatic specimens (4 x 4 x 16) cm3. Keep in water after stripping until the days of the test.
The compression and tensile tests (by three-point bending) were carried out respectively by a press of 2000 kN capacity with speeds of 0.5 MPa/s and by a digital universal mechanical strength testing machine of 50 kN of capacity, load and controlled displacement. The measurements of the physical properties were carried out by a hydrostatic balance precision of 0.01 g.
Table 1. Physical characteristics of materials
|
Properties |
Unit |
Sand dune |
sawdust |
Cement |
|
Finess modulus |
(%) |
1.83 |
Very difficult to achieve because of its shape |
- |
|
Sand equivalent (visual) |
(%) |
96.68 |
47 |
- |
|
Sand equivalent (piston) |
(%) |
88.86 |
90.9 |
- |
|
Apparent density |
(g/cm3) |
1.425 |
0.087 |
1.12 |
|
Absolute density |
(g/cm3) |
2.629 |
0,156 |
3.16 |
|
SSB |
(cm2/g) |
- |
- |
3630 |
Table 2. Composition of the mortars studied
|
Sawdust content (%) |
MS0% |
MS10% |
MS20% |
MS30% |
|
dune sand (g) |
1350 |
1215 |
1080 |
945 |
|
Ciment (g) |
450 |
450 |
450 |
450 |
|
Water (g) |
270 |
225 |
225 |
225 |
|
Sawdust (g) |
0 |
7.085 |
14.17 |
21.26 |
|
W/C |
0.6 |
0.5 |
0.5 |
0.5 |
The different results of the physical properties are grouped together in Table 3 and illustrated by figures ‘Figure 1’, ‘Figure 2’, ‘Figure 3 and Figure 4’.
Table 3. Effect of sawdust on the physical properties of mortar at a young age
|
Properties |
Time |
7 days |
14 days |
21 days |
28 days |
|
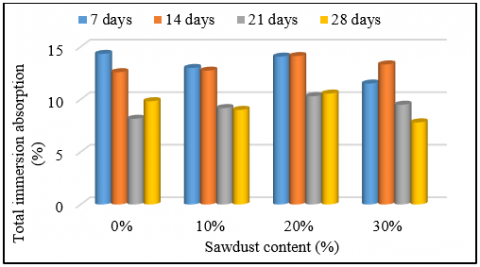
Total immersion absorption (%) |
MS0% |
14,328±1,188 |
12,586±0,267 |
8,153±0,075 |
9,825±0,170 |
|
MS10% |
12,986±0,174 |
12,733±0,406 |
9,17±0,085 |
8,999±0,662 |
|
|
MS20% |
14,069±0,113 |
14,121±0,189 |
10,3±0,243 |
10,549±0,047 |
|
|
MS30% |
11,507±0,836 |
13,324±1,306 |
9,489±1,699 |
7,811±1,273 |
|
|
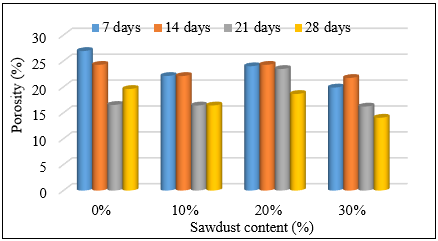
Porosity (%) |
MS0% |
26,932±1,807 |
24,266±0,486 |
16,528±0,194 |
19,603±0,269 |
|
MS10% |
22,114±0,620 |
22,107±0,496 |
16,413±0,185 |
16,421±0,772 |
|
|
MS20% |
23,991±0,095 |
24,265±0,087 |
23,461±7,341 |
18,644±0,130 |
|
|
MS30% |
19,883±0,739 |
21,736 ± 1,018 |
16,209±2,102 |
14,052±1,753 |
|
|
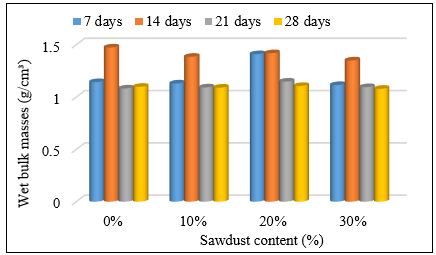
Wet bulk masses (g/cm3) |
MS0% |
1,143±0,562 |
1,474 ± 0,490 |
1,082 ± 0,511 |
1,098 ± 0,518 |
|
MS10% |
1,13 ± 0,531 |
1,385 ± 0,366 |
1,092 ± 0,515 |
1,09 ± 0,515 |
|
|
MS20% |
1,41 ± 0,538 |
1,419 ± 0,392 |
1,148 ± 0,440 |
1,106 ± 0,522 |
|
|
MS30% |
1,115 ± 0,542 |
1,35 ± 0,315 |
1,095 ± 0,482 |
1,079 ± 0,485 |
|
|
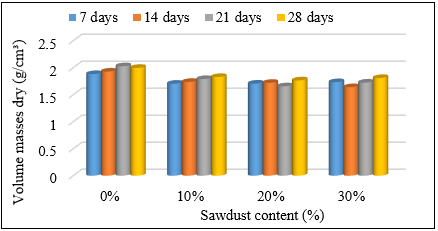
Volume masses dry (g/cm3) |
MS0% |
1,882 ± 0,825 |
1,928 ± 0,003 |
2,027 ± 0,957 |
1,996 ± 0,944 |
|
MS10% |
1,703 ± 0,806 |
1,737 ± 0,039 |
1,79 ± 0,839 |
1,828 ± 0,870 |
|
|
MS20% |
1,705 ± 0,815 |
1,719 ± 0,018 |
1,655 ± 1,031 |
1,765 ± 0,831 |
|
|
MS30% |
1,732 ± 0,700 |
1,64 ± 0,090 |
1,724 ± 0,999 |
1,809 ± 0,965 |
Figure 1. Evolution of immersion absorption as a function of sawdust content at (7,14,21,28) days.
Figure 2. Evolution of porosity as a function of the sawdust content at (7,14,21,28) days
Figure 3. Evolution of the wet densities as a function of the sawdust content at (7,14,21,28) days
Figure 4. Evolution of dry densities as a function of the sawdust content at (7,14,21,28) days
3.1 Total immersion absorption and porosity
From “Figure 1” MS10% showed less absorption than MS0% at 7 and 28 days and moderately greater than MS0% at days 14 and 21, this decrease in absorption is due firstly to the presence of sawdust with their sizes larger than that of dune sand and secondly to the phenomenon of cement hydration and the composition of ettringites. On the other hand, the absorption of MS20% is always higher compared to other mortars except at 7 days it marked a slightly less absorption than that of MS0% at this age. Tend says that MS30% had the lowest absorption of other mortars at 7 and 28 days and greater than that of MS0% at 14 and 21 days.
From "Figure 2" MS10% and MS30% showed less porosity than MS0% on days 7-28. While MS20% scored less porosity than MS0% at 7 and 28 days to equal it at 14 days and score the greatest porosity at 21 days.
3.2 Wet and dry density
From 'Figure 3' The wet density of MS20% is always higher than those of other mortars except at 14 days it marked a wet density less than that of MS0% and greater than those of MS10% and MS30%. MS10% and MS30% mortars consistently scored less wet densities than MS0% and slightly higher than the latter at 21 days.
From "Figure 4" The dry densities of the three mortars (MS10%, MS20%, MS30%) marked consistently lower values than those of MS0%.
The various results of the mechanical properties are grouped together in Table 4 and illustrated by figures ‘Figure 5 and 6’.
Table 4. Effect of sawdust on the mechanical properties of mortar at young age
|
Properties |
Time |
7 days |
14 days |
21 days |
28 days |
|
Compressive strength (MPa) |
MS0% |
18,782 ± 6,286 |
31,697 ± 5,594 |
25,085±4,559 |
18,033 ± 2,148 |
|
MS10% |
19,203 ± 2,687 |
23,328 ± 2,267 |
21,96±2,655 |
19,485±1.643 |
|
|
MS20% |
20,258 ± 2,106 |
24,072 ± 3,496 |
22,527±2,284 |
20,717±0.961 |
|
|
MS30% |
24,278 ± 5,709 |
17.065 ± 2.279 |
24,143±1,259 |
29,55±1.907 |
|
|
Tensile strength (MPa) |
MS0% |
4,917 ± 1,350 |
6,883 ± 0,536 |
4,901 ± 0,319 |
3,145 ± 0,176 |
|
MS10% |
5,516 ± 0,616 |
5,48 ± 0,236 |
3,545 ± 0,614 |
4,274 ± 0,434 |
|
|
MS20% |
5,518 ± 0,125 |
5,963 ± 0,107 |
3,6 ± 0,860 |
4,877 ± 0,131 |
|
|
MS30% |
7,341 ± 1,166 |
6,007 ± 0,841 |
4,427 ± 0,794 |
5,077 ± 0,669 |
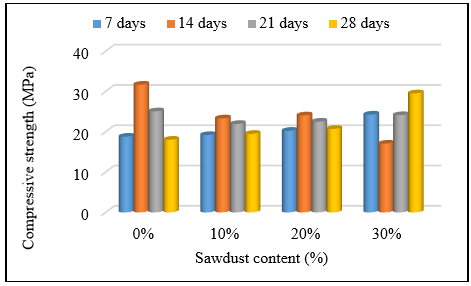
Figure 5. Effect of adding sawdust on compressive strength at (7,14,21 and 28) days
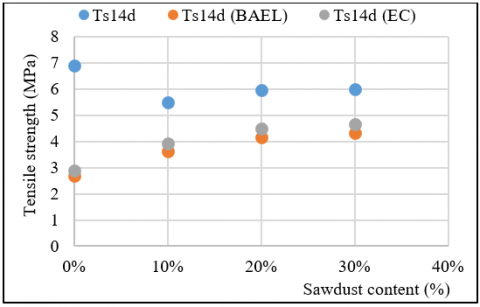
Figure 6. Effect of adding sawdust on tensile strength at (7,14,21 and 28) days
4.1 Résistance à la Compression et à la Traction
According to 'Figure 5' The pace of the evolution of the compressive strength of mortars (MS10%, MS20%) as a function of time is the same with values slightly higher than those of MS0% to 7 and 28 days, and generally less than 14 and 21 days. On the other hand, that of MS30% is inversely to that of MS0% with a remarkable difference at 7 days and very remarkable at 14 and 28 days to mark almost the same resistance at 21 days. The values of the compressive strengths without sawdust or with sawdust show higher values compared to those found by Kameni Kamga [6] because the latter used reverie sand and another method of treating sawdust. On the other hand, my resistance values without less than that of the study by Ndong Engoned [7] that can be explained by its method of treatment by smoothing.
According to 'Figure 6' The pace of the evolution of the tensile strength of the three mortars (MS10%, MS20%, MS30%) as a function of time is the same with values greater than those of MS0% at 7 and 28 days and less than 14 and 21 days.
The relationships between early age strengths (compressive and tensile) and characteristic 28 days strengths can be influenced by the substitution of sand by sawdust. It has been observed through the results of these properties that they can present different values. In this part of the work, we explore the effect of sawdust content on these relationships at different ages, for compressive strengths and even for tensile strengths. These relationships between resistances are also situated in relation to those given by the regulations in force (BAEL [8], EC2 [9]).
For the relationships between the compressive strengths at a young age and the characteristic strengths at 28 days, the following formulas Eq (1) were used; Eq (2) and Eq (3):
From « BAEL [8] »
$\mathrm{f}_{\mathrm{Cj}}=\frac{\mathrm{j}}{4,76+0,83 \mathrm{j}} \mathrm{f}_{\mathrm{C}_{28}}$ (1)
For fc28 ≤ 40 MPa
From « EC2 [9] »
$\mathrm{f}_{\mathrm{cm}}(\mathrm{t})=\beta_{\mathrm{cc}}(\mathrm{t}) \mathrm{f}_{\mathrm{cm}}$ (2)
With $\quad \beta_{\mathrm{cc}}(\mathrm{t})=\exp \left[\mathrm{s}\left[1-\left(\frac{28}{\mathrm{t}}\right)^{1 / 2}\right]\right]$ (3)
Or
"s": is a coefficient which takes different values depending on the class of the cement, in which it is taken equal to 0.25 for our case (Cement CEM 42.5 N).
"fcm": Average compressive strength at 28 days.
And in the same way for the relations between tensile strengths at young age and characteristic strengths at 28 days.
For the relationships between compressive strengths and tensile strengths Eq (4) and Eq (5).
From « BAEL [8] »
$\mathrm{f}_{\mathrm{tj}}=0,6+0,06 \mathrm{f}_{\mathrm{Cj}}$ (4)
From « EC2 [9] »
$\mathrm{f}_{\mathrm{ti}}=0,30(\mathrm{fcj})^{2 / 3}$ (5)
5.1 Relationships between compressive strengths at young age and characteristic strengths at 28 days
The results are grouped together in the Table 5 below and shown diagrammatically in the Figures 7-9, which follow.
Table 5. Compressive strengths at (7, 14 and 21) days as a function of sawdust content
|
Sawdust content |
0% |
10% |
20% |
30% |
|
Cs7d |
18,782 |
19,203 |
20,258 |
24,278 |
|
Cs7d (BAEL) |
11,902 |
11,452 |
12,223 |
16,779 |
|
Cs7d (EC) |
14,764 |
14,176 |
15,111 |
20,744 |
|
Cs14d |
31,697 |
23,328 |
24,072 |
17.065 |
|
Cs14d (BAEL) |
15,413 |
14,830 |
15,775 |
21,655 |
|
Cs14d (EC) |
16,599 |
15,972 |
16,990 |
23,323 |
|
Cs21d |
23,418 |
19,352 |
15,527 |
24,143 |
|
Cs21d (BAEL) |
17,066 |
16,420 |
17,467 |
23,978 |
|
Cs21d (EC) |
17,895 |
16,822 |
17,895 |
24,565 |
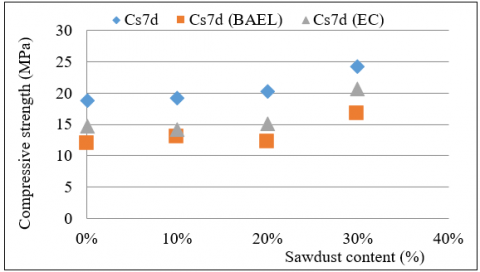
The values of the compressive strength at 7 days are higher than those of BAEL [8] and EC2 [9] for the different sawdust contents.
The values of the compressive strength at 14 days are higher than those of BAEL [8] and EC2 [9] except for the sawdust content of 30%.
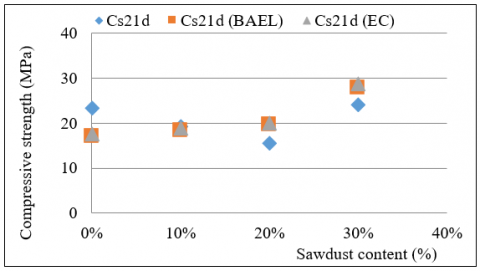
The values of the compressive strength at 21 days are lower than those of BAEL [8] and EC2 [9] for the sawdust contents of 20% and 30% and higher for the other two contents 0% and 10%, but the most remarkable which is closer for the latter.
Figure 7. The relationships between the 7-day compressive strengths and the characteristic 28-day strengths as a function of the sawdust content
Figure 8. The relationships between the 14-day compressive strengths and the 28-day characteristic strengths as a function of the sawdust content
Figure 9. The relations between the compressive strengths at 21 days and the characteristic strengths at 28 days as a function of the sawdust content
5.2 Relationships between early tensile strengths and characteristic 28-day strengths
The results are grouped together in the Table 6 below and shown diagrammatically in the Figures 10-12 which follow.
Table 6. Tensile strengths at (7, 14 and 14) days as a function of sawdust content
|
Sawdust content |
0% |
10% |
20% |
30% |
|
Ts7d |
4,917 |
5,516 |
5,518 |
7,341 |
|
Ts7d (BAEL) |
2,076 |
2,821 |
3,219 |
3,351 |
|
Ts7d (EC) |
2,575 |
3,499 |
3,993 |
4,157 |
|
Ts14d |
6,883 |
5,48 |
5,963 |
6,007 |
|
Ts14d (BAEL) |
2,673 |
3,633 |
4,145 |
4,315 |
|
Ts14d (EC) |
2,895 |
3,934 |
4,489 |
4,673 |
|
Ts21d |
4,901 |
3,545 |
3,6 |
4,427 |
|
Ts21d (BAEL) |
2,975 |
4,043 |
4,614 |
4,803 |
|
Ts21d (EC) |
3,049 |
4,144 |
4,728 |
4,922 |
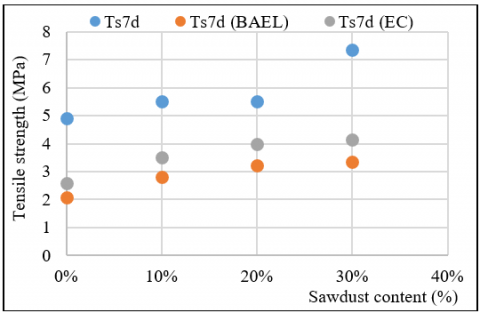
Figure 10. The relationship between the tensile strengths at 7 days and the characteristic strengths at 28 days as a function of the sawdust content
Figure 11. The relationship between the tensile strengths at 14 days and the characteristic strengths at 28 days as a function of the sawdust content
The values of the tensile strength at 7 days are higher than those of BAEL [8] and EC2 [9] for the different sawdust contents.
The values of the tensile strength at 14 days are higher than those of BAEL [8] and EC2 [9] for the different sawdust contents especially at 0%.
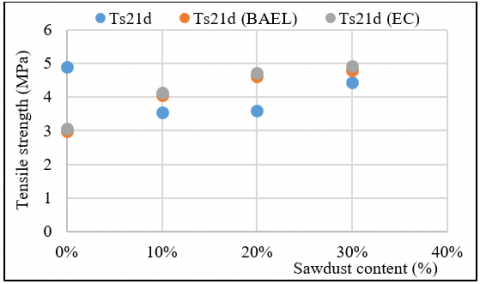
Figure 12. The relationship between the tensile strengths at 21 days and the characteristic strengths at 28 days as a function of the sawdust content
The values of the tensile strength at 21 days are lower than those of BAEL [8] and EC2 [9] for the sawdust contents of 10%, 20% and 30% and higher for the content 0%.
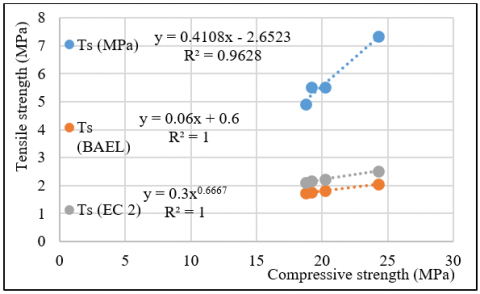
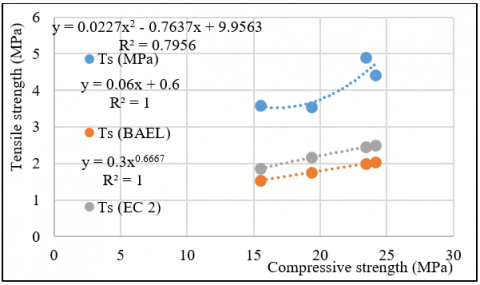
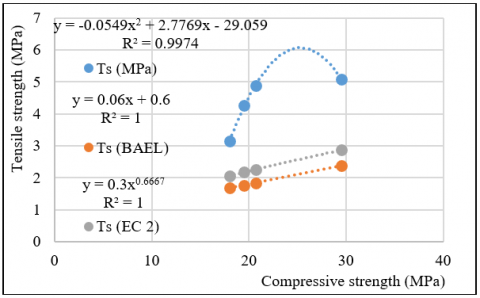
5.3 The relationships between compressive strengths and tensile strengths
The results are grouped together in the Table 7 below and shown diagrammatically in the Figures 13-16 which follow.
The curves for the experimental results are trend lines. And the curves of the results calculated by the formulas of BAEL and EC2 are curves following these formulas.
Table 7. Compressive and tensile strengths as a function of sawdust content at (7, 14, 21 and 28) days
|
Age |
Sawdust content |
0% |
10% |
20% |
30% |
|
7 jours |
Cs (MPa) |
18,782 |
19,203 |
20,258 |
24,278 |
|
Ts (MPa) |
4,917 |
5,516 |
5,518 |
7,341 |
|
|
Ts (BAEL) |
1,727 |
1,752 |
1,815 |
2,057 |
|
|
Ts (EC 2) |
2,120 |
2,151 |
2,229 |
2,515 |
|
|
14 jours |
Cs (MPa) |
31,697 |
23,328 |
24,072 |
17,065 |
|
Ts (MPa) |
6,883 |
5,480 |
5,963 |
6,007 |
|
|
Ts (BAEL) |
2,502 |
2.000 |
2,044 |
2,041 |
|
|
Ts (EC 2) |
3,005 |
2,449 |
2,501 |
2,497 |
|
|
21 jours |
Cs (MPa) |
23,418 |
19,352 |
15,527 |
24,143 |
|
Ts (MPa) |
4,901 |
3,545 |
3,600 |
4,427 |
|
|
Ts (BAEL) |
2,005 |
1,761 |
1,532 |
2,049 |
|
|
Ts (EC 2) |
2,456 |
2,162 |
1,867 |
2,506 |
|
|
28 jours |
Cs (MPa) |
18,033 |
19,485 |
20,717 |
29,55 |
|
Ts (MPa) |
3,145 |
4,274 |
4,877 |
5,077 |
|
|
Ts (BAEL) |
1,682 |
1,769 |
1,843 |
2,373 |
|
|
Ts (EC 2) |
2,063 |
2,172 |
2,263 |
2,867 |
Figure 13. Relationship between compressive strengths and 7-day tensile strengths
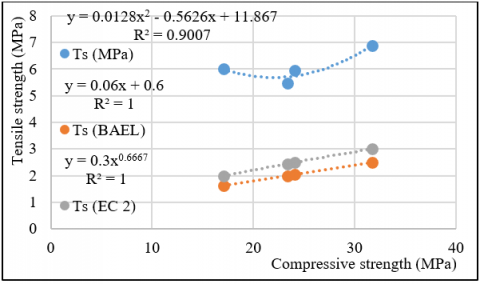
Figure 14. Relationship between compressive strengths and tensile strengths at 14 days
The preceding curves show the Ts-Cs relationships for MSs with different sawdust content (0%, 10%, 20%, 30%) at 7, 14, 21 and 28 days. We notice that the differences between the regulatory curves and the experimental curves of the MS are very important with very acceptable regression qualities Ts-Cs (R2 = 0.9628, R2 = 0.7956, R2 = 0.9007 and R2 = 0.9974) respectfully at (7, 14, 21 and 28) days. These relationships always give overestimated values compared to those of the regulations.
It can be seen that the Rt-Rc relationships are influenced by the sawdust content at different ages.
Figure 15. Relations between compressive strengths and tensile strengths at 21 days
Figure 16. Relationship between compressive strengths and tensile strengths at 28 days
The absorption by total immersion has a maximum decrease of the order of 19.69% compared to MS0% for (MS30%) at 7 days, and a gradual increase at 14 and 21 days especially for MS20% of the order (12.20% and 26.33%) compares to MS0% and respectively to age. Most notable, at 28 days, was the decrease in total immersion absorption of MS30% of around 20.50% compared to that of (MS0%).
At 7, 14 and 28 days the maximum decrease in porosity was for (MS30%) respectively of the order of (26.17%, 10.43%, 28.32%) compared to (MS0%). On the other hand at 21 days (MS20%) marked an unfavorable increase.
The largest decreases in Wet Density were for (MS30%) on the order of (2.45%, 8.41%, 1.73%) at (7, 14, 28 days) respectively compared to that of (MS0%).
At 7 days the decreases in Dry Density were almost identical to reach 14.94% as the maximum values at 14 days for (MS30%) compared to that of (MS0%). However, the (MS20%) marked the maximum values (18.35%, 11.57%) respectively at (21 and 28 days) compared to that of (MS0%).
The tensile strength of (MS30%) increased by almost 50% compared to that of (MS0%) at 7 days, and that of (MS20%) decreased by an order of (13.37%, 27.67%) respectively at (14 and 21 days) compared to that of (MS0%), in order to increase for the three mortars (61.43%) for (MS30%) compared to that of MS0%.
At 7 days the compressive strength increased in proportion to the sawdust content with an average factor of (1.09), to decrease at 14 days by almost half (46.16%) for (MS30%) of the strength of MS0 %. At the end it increased by around (63.87%) at 28 days compared to that of the MS0%.
The relationships between the strengths either in tension and in compression at the young age and the characteristic strengths at 28 days are influenced at any age either by values higher or lower than those of the regulations.
The relationships between compressive strengths and tensile strengths are influenced by the sawdust content at different ages.
The correlations between the compressive strengths and the tensile strengths which appear in the regulatory documents (BAEL, EC2) valid for common mortars and concretes are no longer so in our case. Other parameters such as composition and sawdust content as well as age, which have been studied in this work, must be considered in these relationships.
The authors thank the LGCH research laboratory at the University 8 May 1945 (Guelma) and the pedagogical laboratory of the civil and hydraulic engineering department (Guelma) for their technical support during the experimental work.
|
DS |
dune sand |
|
SSB |
specific surface of Blaine, cm2.g-1 |
|
W/C |
Water Cement Ratio |
|
MS |
Mortar with different % sawdust |
|
f |
Resistance |
|
s |
Coefficient which takes different values depending on the class of the cement |
|
t |
Time (age), days |
|
CEM |
Portland cement type |
|
Cs |
Compressive strength, MPa |
|
Ts |
Tensile strength, MPa |
|
Greek symbols |
|
|
$\beta$ |
Coefficient which takes different values depending on the time (age) |
|
Subscripts |
|
|
cj |
Compressive at ‘j’ days |
|
c28 |
Compressive at ‘28’ days |
|
tj |
Tensile at ‘j’ days |
|
cm |
Medium compressive |
[1] Akkaoui, A. (2014). Wood aggregate concrete: Experimental and theoretical study of thermo-hydro-mechanical properties using multi-scale approaches. PhD, University Paris-Est, 231. https://pastel.archives-ouvertes.fr/tel-01162671.
[2] Balhachemi, S., Berrafa, F. (2017). Reclamation of dune sand (Naama sand) Durability and mechanical behavior, Master thesis in civil engineering, Belhadj Bouchaib University Center in Ain T’émouchen. http://pmb-int.univ-temouchent.edu.dz/opac_css/doc_num.php?explnum_id=1082.
[3] Tsihoarana, H.R., Mamiharijaona, R. (2017). Composite based on pozzolan and sawdust. American Journal of Innovative Research and Applied Sciences, 5(6): 454-460.
[4] Raheliarivelo, T. (2004). Contribution to the study of the manufacture of composite materials based on sawdust and Portland cement. Advanced Study Thesis in Materials Science, University of Antananarivo.
[5] Cheumani, Y.A.M. (2009). Study of the microstructure of wood/cement composites by proton NMR relaxometry. Doctoral dissertation, Thesis from the University of Bordeaux 1 (France), 171.
[6] Kameni Kamga, D. (2010). Contribution to the valuation of tropical lignocellulosic by-products in the composition of concrete and mortars (case of parkia biglobosa), Master's thesis, International Institute of Water and Environmental Engineering, University of Ouagadougou.
[7] Ndong Engoned, JG. (2015). Development of cementitious materials based on wood by-products - Shaping by extrusion and vibrocompacting. PhD, Unéversity D’artois.
[8] BAEL 91 rules (DTU P 18-702) (revised February 99, 2000) Technical rules for the design and calculation of reinforced concrete structures and structures using the limit states method Fascicle 62, title 1 of the CCTG - Works section 1: reinforced concrete 1. http://www.sodibet.com/telechargement/BAEL%2091%20R%2099.pdf.
[9] Eurocode 2 (ENV 1992-1-2): Design of concrete structures, Part 1-2: General rules - calculation of fire behavior. February 2001. http://www-lmdc.insa-toulouse.fr/pres/mastergc/telechargement/pedagogie/EC2_M2P_COAB_Multon_2012.pdf.