Xiaohua Jin | Jiyu Zheng*
© 2021 IIETA. This article is published by IIETA and is licensed under the CC BY 4.0 license (http://creativecommons.org/licenses/by/4.0/).
OPEN ACCESS
Loading rate is an important impactor of the mechanical properties, as well as the deformation and failure mode of coal and rock. Using an RMT-301 rock mechanics tester and a Soft Island acoustic emitter, uniaxial compression and acoustic emission (AE) tests were carried out on coal samples under different loading rates. The results show that uniaxial compressive stress-strain curves of the rock samples each consist of four segments: compaction, elasticity, yield, and failure. As the loading rate increased from 0.01mm/s to 0.02mm/s, the peak strength rose, the post-peak deformability dropped, the brittle failure features of anthracite became more obvious, more AE events took place, and AE frequency increased. Energy analysis shows that, the faster the loading rate, the larger the AE count, the faster the energy accumulation, but the fewer the total energy accumulation.
anthracite, loading rate, deformation and failure, acoustic emission (AE)
The instability failure of coal and rock is accompanied by acoustic emission (AE). The evolution law of cracks and the dynamics of coal and rock damage can be understood by AE features. In general, the macroscopic instability failure of coal and rock lags the precursor phase of AE. The analysis of the law in the precursor phase helps to predict dynamic disasters of the mine, including rock bust, roof fall, and gas outburst. During coal mining, the damage and acoustic features of coal depend on the advance rate. The acceleration of workface advancement will cause more serious destruction of the coal wall.
On loading rate and AE, Spasova et al. [1] used AE detection to study the softening and solidification features of rocks. Chmel and Shcherbakov [2] examined the compression and impact failure characteristics of granite, using AE method. Ma et al. [3] explored the mechanical properties and AE parameter features of coal samples under uniaxial and triaxial loading. Jiang et al. [4] tested the damage evolution and AE parameter features of salt rock under different loading rates, pointing out that the faster the loading rate, the higher the AE frequency, and the more obvious the brittle failure features of salt rock. Under uniaxial compression, Huang and Liu [5] analyzed the AE features of coal-rock combinations at different loading rates, and drew the following conclusions: With the increase of loading rate, the deformation of coal-rock combinations increased in elastic stage, plastic stage, and failure stage, the peak strength continued to rise, the stress-strain curve became less smooth, and the brittleness grew to a certain extent.
Ranjith et al. [6] carried out an AE analysis on the influence of water content and strain rate on the strength of concrete. Through stress-controlled loading, Filimonov et al. [7] conducted AE monitoring experiments on salt rock under uniaxial loading at different loading rates, and investigated the influence of loading rate on the characteristic parameters of AE, namely, AE rate, and cumulative ringing counts of AE. Sagar and Rao [8] monitored the AE of reinforced concrete beams under different loading rates, and examined the amplitude distribution features of AE events at different loading rates. Zhang et al. [9] numerically simulated the influence of strain rate on the number, size and spatial distribution of AE events in pre-factured rock-like materials. Gagar et al. [10] studied the effect of strain rate on the AE rate of crack propagation. Backers et al. [11] probed into the AE features of sandstone fracture propagation under different loading rates.
To disclose the influence of rock sample size on AE features under different loading rates, Zhang and Yang [12] relied on numerical simulation to test the uniaxial compression effects on samples of different aspect ratios under different loading rates. In the real world, the AE features and damage evolution of coal vary with buried depths [13]. With the continuous improvement of instruments, recent years has witnessed a growth in triaxial experiments on large coal samples. Zhang et al. [14] explored the multifractal features of the AE of coal samples under loading and unloading conditions, and analyzed the damage process of coal samples by AE theory and fractal theory. Liu et al. [15] discussed the mechanical properties and damage evolution of slag concrete, with the aid of AE monitoring technique. Wang et al. [16] adopted automatic speech recognition to detect the AE features of coal destruction, and achieved good experimental results.
The excavation of coal and rock causes the stress to concentrate in the local area near the excavation site, and induces deformation and failure of coal and rock. The stress changes with the progress of mining, which is demonstrated by the lab test results on how loading rate affects coal loading. Therefore, our research aims to acquire the law similar to engineering practice through lab research, and guide the support operation of coal mining, thereby preventing collapses.
2.1 Instruments
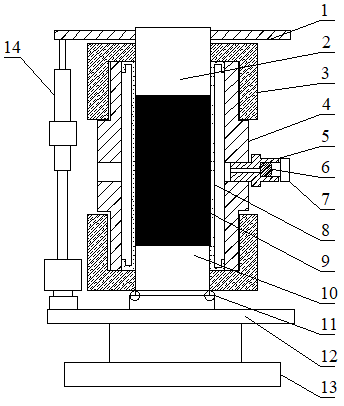
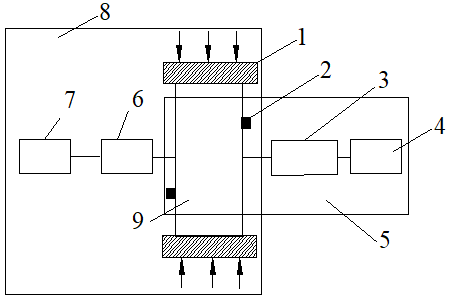
To observe the AE in coal and rock loading, the experimental devices include a rock mechanics test system and an AE test system. As shown in Figure 1, the loading system is an RMT-301 servo-controlled testing machine. In the rock mechanics test system, an instruction is firstly given by a computer, and the press is then controlled by a control cabinet. The principle of AE is that the elastic wave emitted from the AE source propagates all the way to the surface of the material, causing a surface displacement that can be detected by AE sensors. The sensors convert the mechanical vibration of the material into electrical signals, which are then amplified, processed, and recorded. During the loading, the AE probe pasted on the surface of the sample receives the AE signal in real time as the sample ruptures. The signal is received and processed by the AE instrument, and displayed in real time on the computer. The AE observation system is shown in Figure 2.
1- measurement positioning plate; 2- upper pressure head; 3 - through cover; 4 - cylinder; 5 - plug seat; 6 - plug; 7 - O-ring; 8- isolation sleeve; 9 - sample; 10- lower pressure head; 11 - washer; 12- sensor mounting plate; 13- bearing seat; 14- displacement sensor
Figure 1. The loading system
1-loading pressure plate; 2-AE probe; 3-acoustic emitter; 4-computer; 5-AE test system; 6-control cabinet; 7-computer; 8-rock mechanics test system; 9 samples
Figure 2. The AE observation system
2.2 Methods
(1) Sample preparation
Firstly, large anthracite coal samples were taken from the coal mine. Then, the core (diameter: 50mm) of each sample was drilled with a rock drilling machine, and ground by a grinding machine into a standard sample (Φ50mm×100mm). The end flatness of the samples must meet the requirements of rock mechanics test.
(2) Experimental preparation
The AE probe was pasted on sample surface with the 502 strong glue, before fixing the coal sample on the rock mechanics testing machine. Meanwhile, the deformation sensors were debugged. The AE probe was connected to the computer, and the AE recording parameters were configured. Before the power was connected, the power switch on the back of the numerical controller was connected. Then, the power light would be turned on and enter the preheating state. Then, the computer was turned on to observe the readings of each sensor displayed in the self-check state. After all readings were found normal, the hydraulic source was started, and the cooling water valve was opened. Once started, the hydraulic source must first run under low pressure for about 5min. Only then, could the source operate under high pressure until the oil temperature becomes normal (i.e., the pipeline is hot), which marks the completion of experimental preparation.
(3) Experimental process
After the preparation, the samples were mounted according to the requirements of each test. The displacement sensors were adjusted to the proper position based on the readings in the self-check state. Two control modes are available: automatic and manual. The former was selected for conventional continuous loading, and the latter for creep loading test. There are also two control methods: force and deformation. After a method was selected, the optimal waveforms would be displayed. Once the parameters were configured, the main interface of the test would be shown on the screen. Then, the file name and sample parameters needed to be inputted. Firstly, the sample was preloaded, and formal loading would begin after the upper pressure head contacted the sample. The loading adopts displacement control. Two loading rates were chosen: 0.01mm/s and 0.02mm/s. During the loading, the AE was displayed in real time on the computer. The test was ended when the sample was completely destroyed.
3.1 Stress-strain features
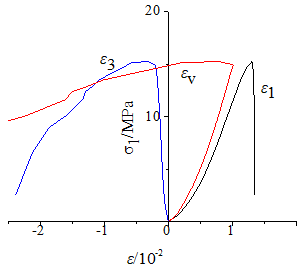
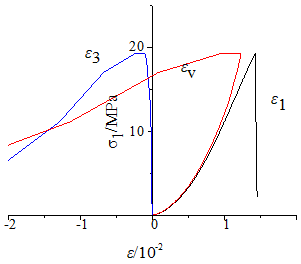
The uniaxial compression stress-strain curves of coal samples each consist of four segments: compaction, elasticity, yield, and failure. Due to the high density of the anthracite being tested, the elastic segment of each stress-strain curve was long, while the yield segment was short. The coal sample reached the peak strength and got destroyed immediately after elastic deformation. There was almost no sign of failure on the corresponding stress-strain curve. With the increase of loading rate, the slope of the straight segment of the stress-strain curve grew to a certain extent.
When the loading rate was 0.01mm/s, the peak stress was 15.21MPa and the corresponding deformation was 1.30mm. When the loading rate was 0.02mm/s, the peak stress was 19.25MPa, and the corresponding deformation was 1.43 mm.
The peak strength of coal sample increased with loading rate. When the loading rate was slow, the initial damage and micro-cracks in the coal sample evolved and developed thoroughly, resulting in a low strength. As the loading rate increased, the micro-cracks could not fully develop. As a result, the entire stress-strain curves (Figures 3 and 4) show that the slower the loading rate, the stronger the post-peak deformability.
Figure 3. Stress and strain features (loading rate: 0.01mm/s)
Figure 4. Stress and strain features (loading rate: 0.02mm/s)
3.2 AE features
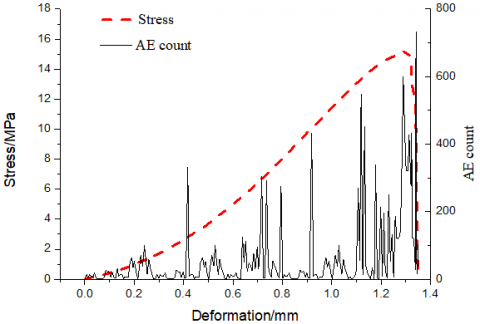
Figure 5. The AE features (loading rate: 0.01mm/s)
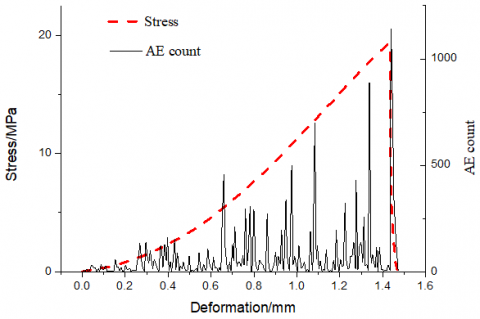
At the initial stage of loading, AE activities were few, and the initial cracks in the coal and rock began to close. During and after the closure, a small amount of AE was produced due to the slip between the crack surfaces, but the energy was low. As the loading rate slowly climbed up, the cracks began to propagate, and new cracks emerged. Then, the ringing counts, cumulative ringing counts, and energy rates became more and more active. Further loading intensified the interaction between cracks, and micro cracks coalesced and penetrated the sample, forming macro cracks. The AE was extremely active near the stress peak, and AE ringing counts reached the maximum at the stress peak. Specifically, the faster the loading rate, the more obvious the brittle failure features of anthracite, the more the AE events, the higher the AE frequency. At the loading rate of 0.01mm/s, the maximum AE count was 732; at the loading rate of 0.02mm/s, the maximum AE count was 1,142 (Figures 5 and 6).
Figure 6. The AE features (loading rate: 0.02mm/s)
3.3 Energy analysis
The instability failure of coal and rock is irreversible. It is caused by the sudden release of energy after the dissipated energy accumulates to a certain level [17]. The energy changes differently as the sample is loaded, unloaded, compressed, or expanded. During loading and compression, the testing machine consumes energy, while the sample absorbs energy. During unloading and expansion, the testing machine and the sample both release energy. The destruction of coal samples is a process involving pore compression, crack generation, expansion, and penetration. During the process, crack generation and expansion absorb energy to overcome friction resistance [18].
The deformation and failure of coal sample manifest as expansion in the horizontal direction, and compression in the vertical direction. From the perspective of energy analysis, the failure of coal sample is the combination of horizontal volume expansion and vertical compression. In the airtight cylinder of triaxial loading test, the coal sample is compressed vertically by the press in the axial direction, which produces compression energy. The deformation and expansion in the horizontal direction do work to overcome the confining pressure resistance and release energy [19]. The total energy is often divided into vertical compression energy and horizontal expansion energy, aiming to disclose the energy change of vertical deformation and horizontal deformation during compression and expansion. The total energy absorbed by unit volume coal sample during compression and expansion can be expressed as [20]:
$U={{U}_{a}}+{{U}_{l}}=\int {{\sigma }_{1}}d{{\varepsilon }_{1}}+2\int {{\sigma }_{3}}d{{\varepsilon }_{3}}$ (1)
where, U, Ua and Ul are total energy, vertical compression energy, and horizontal expansion energy, respectively; $\sigma_{1}, \varepsilon_{1}, \sigma_{3}$, and $\varepsilon_{3}$ are vertical stress, vertical strain, horizontal stress, and horizontal strain, respectively. The deformation is positive in compression and negative in expansion.
In the uniaxial compression and expansion test, the horizontal expansion energy is 0. Thus, the total energy in the compression and expansion of coal sample equals the energy consumed by axial compression
${{U}_{a}}=\int {{\sigma }_{1}}d{{\varepsilon }_{1}}=\sum\limits_{i=0}^{n}{\frac{1}{2}}({{\varepsilon }_{1i+1}}-{{\varepsilon }_{1i}})({{\sigma }_{1i}}+{{\sigma }_{1i+1}})$ (2)
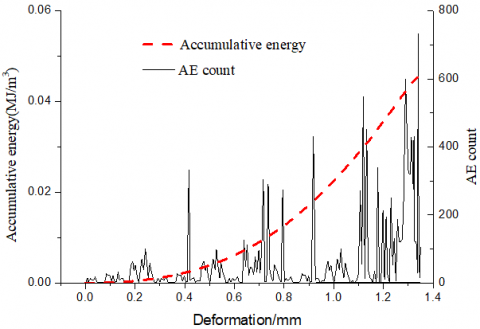
Figure 7. Cumulative energy (loading rate: 0.01mm/s)
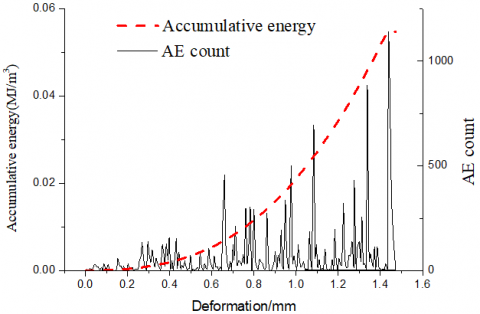
Figure 8. Cumulative energy (loading rate: 0.02mm/s)
As shown in Figures 7 and 8 above, the higher the loading rate, the greater the peak strength, the larger the energy consumption, and thus the more significant the energy accumulation. The maximum cumulative energy was 0.0456MJ/m3 at the loading rate of 0.01mm/s, and 0.0548MJ/m3 at the loading rate of 0.02mm/s. Judging by the cumulative energy curves, the slope of each curve increased with the loading rate.
This paper carries out uniaxial compression and AE tests on coal samples under different loading rates, and observes the positive correlation between the loading rate and the brittle failure features of anthracite. Then, the relationship between AE and energy accumulation was analyzed from the angle of energy. The main conclusions are as follows:
(1) Through the mechanics tests on anthracite, the stress-strain curve of each coal sample consists of four segments under uniaxial compression: compaction, elasticity, yield, and failure. The faster the loading rate, the greater the peak strength; the slower the loading rate, the stronger the post-peak deformability.
(2) The influence of loading rate on AE was observed through the AE tests on anthracite during uniaxial loading. It was learned that the faster the loading rate, the more obvious the brittle failure features of anthracite. At the loading rate of 0.01mm/s, the maximum AE count was 732; at the loading rate of 0.02mm/s, the maximum AE count was 1,142. The faster the loading rate, the more the AE events and the higher the frequency of AE.
(3) The failure process of coal is accompanied by energy accumulation and release. After analyzing the energy of anthracite loading at different rates, the authors discovered that the cumulative energy peaked at 0.0456MJ/m3 at the loading rate of 0.01mm/s, and at 0.0548MJ/m3 at the loading rate of 0.02mm/s. Judging by the cumulative energy curves, the slope of each curve increased with the loading rate.
In reality, coal is not only affected by vertical stress, but also by horizontal stress. Therefore, the future research will take impacts of both stresses into account.
[1] Spasova, L.M., Ojovan, M.I., Gibb, F.G. (2012). Acoustic emission on melting/solidification of natural granite simulating very deep waste disposal. Nuclear Engineering and Design, 248: 329-339. https://doi.org/10.1016/j.nucengdes.2012.03.024
[2] Chmel, A., Shcherbakov, I. (2013). A comparative acoustic emission study of compression and impact fracture in granite. International Journal of Rock Mechanics and Mining Sciences (1997), 64: 56-59. https://doi.org/10.1016/j.ijrmms.2013.08.025
[3] Ma, Y., Wang, E., Xiao, D., Li, Z., Liu, J., Gan, L. (2012). Acoustic emission generated during the gas sorption–desorption process in coal. International Journal of Mining Science and Technology, 22(3): 391-397. https://doi.org/10.1016/j.ijmst.2011.11.001
[4] Jiang, D.Y., Chen, J., Ren, S., Wang, W.Z., Bai, Y.M. (2012). Experimental study of strain rate effect and acoustic emission characteristics of salt rock under uniaxial compression. Chinese Journal of Rock Mechanics and Engineering, 31(2): 326-336. http://dx.chinadoi.cn/10.3969/j.issn.1000-6915.2012.02.012
[5] Huang, B., Liu, J. (2013). The effect of loading rate on the behavior of samples composed of coal and rock. International Journal of Rock Mechanics and Mining Sciences, 61: 23-30. https://doi.org/10.1016/j.ijrmms.2013.02.002
[6] Ranjith, P.G., Jasinge, D., Song, J.Y., Choi, S.K. (2008). A study of the effect of displacement rate and moisture content on the mechanical properties of concrete: Use of acoustic emission. Mechanics of Materials, 40(6): 453-469. https://doi.org/10.1016/j.mechmat.2007.11.002
[7] Filimonov, Y., Lavrov, A., Shkuratnik, V. (2002). Acoustic emission in rock salt: Effect of loading rate. Strain, 38(4): 157-159. https://doi.org/10.1111/j.1475-1305.2002.00022.x
[8] Sagar, R.V., Rao, M.V.M.S. (2014). An experimental study on loading rate effect on acoustic emission based b-values related to reinforced concrete fracture. Construction and Building Materials, 70: 460-472. https://doi.org/10.1016/j.conbuildmat.2014.07.076
[9] Zhang, X.P., Zhang, Q., Wu, S. (2017). Acoustic emission characteristics of the rock-like material containing a single flaw under different compressive loading rates. Computers and Geotechnics, 83: 83-97. https://doi.org/10.1016/j.compgeo.2016.11.003
[10] Gagar, D., Foote, P., Irving, P.E. (2015). Effects of loading and sample geometry on acoustic emission generation during fatigue crack growth: Implications for structural health monitoring. International Journal of Fatigue, 81: 117-127. https://doi.org/10.1016/j.ijfatigue.2015.07.024
[11] Backers, T., Stanchits, S., Dresen, G. (2005). Tensile fracture propagation and acoustic emission activity in sandstone: The effect of loading rate. International Journal of Rock Mechanics and Mining Sciences (1997), 42(7-8): 1094-1101. https://doi.org/10.1016/j.ijrmms.2005.05.011
[12] Zhang, J.F., Yang, Y.Z. (2021). Rock size effect and acoustic emission characteristics under the influence of loading rate. China Mining Magazine, 30(7): 205-210. http://dx.chinadoi.cn/10.12075/j.issn.1004-4051.2021.07.003
[13] Jia, Z., Xie, H., Zhang, R., Li, C., Wang, M., Gao, M., Zhang, Z., Zhang, Z. (2020). Acoustic emission characteristics and damage evolution of coal at different depths under triaxial compression. Rock Mechanics and Rock Engineering, 53: 2063-2076. https://doi.org/10.1007/s00603-019-02042-w
[14] Zhang, R., Liu, J., Sa, Z., Wang, Z., Lu, S., Wang, C. (2020). Experimental investigation on multi-fractal characteristics of acoustic emission of coal samples subjected to true triaxial loading–unloading. Fractals, 28(5): 2050092. https://doi.org/10.1142/S0218348X20500929
[15] Liu, W., Guo, Z., Niu, S., Hou, J., Zhang, F., He, C. (2020). Mechanical properties and damage evolution behavior of coal–fired slag concrete under uniaxial compression based on acoustic emission monitoring technology. Journal of Materials Research and Technology, 9(5): 9537-9549. https://doi.org/10.1016/j.jmrt.2020.06.071
[16] Wang, H.L., Song, D.Z., Li, Z.L., He, X.Q., Lan, S.R., Guo, H.F. (2020). Acoustic emission characteristics of coal failure using automatic speech recognition methodology analysis. International Journal of Rock Mechanics and Mining Sciences, 136: 104472. https://doi.org/10.1016/j.ijrmms.2020.104472
[17] Xie, H., Peng, R., Ju, Y. (2004). Energy dissipation of rock deformation and fracture. Chinese Journal of Rock Mechanics and Engineering, 23(21): 3565-3570. http://dx.chinadoi.cn/10.3321/j.issn:1000-6915.2004.21.001
[18] You, M., Hua, A. (2002). Energy analysis of the failure process of rock specimen. Chinese Journal of Rock Mechanics and Engineering, 21(6): 778-781. http://dx.chinadoi.cn/10.3321/j.issn:1000-6915.2002.06.004
[19] Chen, W.Z., Lu, S.P., Guo, X.H., Qiao, C.J. (2009). Research on unloading confining pressure tests and rockburst criterion based on energy theory. Chinese Journal of Rock Mechanics and Engineering, 28(8): 1530-1540. http://dx.chinadoi.cn/10.3321/j.issn:1000-6915.2009.08.003
[20] Zhu, Z.Q., Sheng, Q., Xiao, P.W., Liu, J.G. (2011). Analysis of energy dissipation in process of unloading confining pressure failure of rocks. Chinese Journal of Rock Mechanics and Engineering, 30(5): 2675-2682.