Lalmi Khier* | Lakel Abdelghani | Djamel Maouche
© 2021 IIETA. This article is published by IIETA and is licensed under the CC BY 4.0 license (http://creativecommons.org/licenses/by/4.0/).
OPEN ACCESS
In this work, we have studied the Kaolin M1 and M2 by the X-ray diffraction method, and we have focused on mullite phase which is the main phase present in common in both products. An update of the program of the method of Stokes was carried out, it was necessary to the microstructural analysis. The completed version is less sensitive to the choice by excess of the number of coefficients of Fourier with regard to the effect of truncation and the office plurality of the errors. The determination of the symmetry of the cell of the principal phase (mullite) in the studied fritted Kaolins was carried out. In Kaolin M1, the size of crystallites of the dominant phase varies between 80 to 170 Å. In Kaolin M2, the size of the crystalline grains of mullite varies between 100 to 400 Å. The size of crystallites was confirmed by the joint method of Williamson-Hall. A distribution of sizes of crystallites was carried out. It shows a dominance of the size of approximately 140 Å for the principal phase of Kaolin M1 and a dominance of the size of approximately 230 Å for the same principal phase of Kaolin M2. By the study of the profiles of line by DRX, it appears very clearly that the principal phase of the various sintered Kaolins, mullite, is free from internal microstrains. It is the case of the mixtures fritted not only at low temperature (1100℃) during 1 hour but also the case of the mixtures of the type ‘chamotte’ cooks with 1350℃ during very long times.
Kaolin M1, Kaolin M2, microstrains, method of stokes, distribution of the sizes
The microstructural parameters of a material (sizes, shape of the crystallites, external and internal stresses in the crystals) are generally obtained by first extracting the true profile of the sample using a deconvolution operation of Profiles of diffraction lines for powdered compounds. For a microstructural study, the methods of Rent, Weigel and Louboutin (LWL) and that of Stokes are used in the deconvolution of the profiles of diffraction lines. These techniques are said to be rigorous because they do not make assumptions about the nature of the diffraction line profiles. Nevertheless, they use the Fourier coefficients to approximate the function of the 'true' profile of the diffraction peak. Consequently, they are very sensitive to the number of these coefficients which implies the truncation effect (low number of coefficients) but also the cumulative error effect (large number of coefficients). For this reason, it is interesting to take into account the number of Fourier coefficients concerning the X-ray diffraction peaks. The method best suited to this study, where there is a possibility of the presence of a double size stress effect, is Warren and Averbach's method. The latter will be used in conjunction with the Williamson-Hall method in addition to the analytical methods that use the previous rigorous deconvolution, simple methods are often used to separate the widths of the convolved functions. The intrinsic error of these methods has been treated in particular by Vives et al. [1], Langford et al. [2] and Zornet al. [3]. To be reliable, the quality of the recording, with sufficiently long times, is required. This makes it difficult to study low symmetry compounds where the overlap of the lines is greater. Moreover, in these methods, the deconvolution is always carried out on the basis of hypotheses on the profiles of the components involved. The microstructural results that result from them can differ significantly from one hypothesis to another [1-15].
Methods of microstructural analysis. The intrinsic diffraction line pattern is caused mainly by the size and internal stresses of the sample. We will give succinctly the methods used for the evaluation of these two phenomena.
Relation of Scherrer has shown that cuts her cristallites in the sample (when the latter does not contain of forced micro) vary in the oppositedirection of the width of ray of diffraction. The relation enters those two sizes is given by Balzar: Df = C λ ∕βcosq [16].
For widths specified in 2q; C is a coefficient which depends on the shape of the crystallites [17] and can assume values between 0.8 and 1.39. For spherical particles, it is generally equal to 1/Df = 1 ∕β* For widths in units where reciprocal q is the Bragg angle, Df is the average grain size, λ is the wavelength and β* is the integral width characterizing enlargement, expressed as the reciprocal lattice.
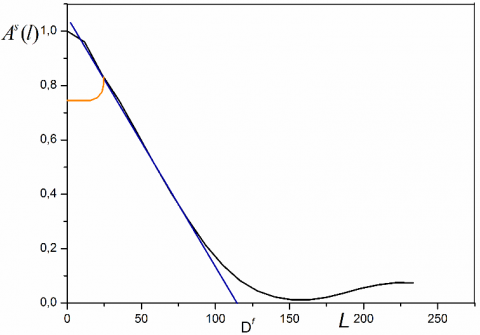
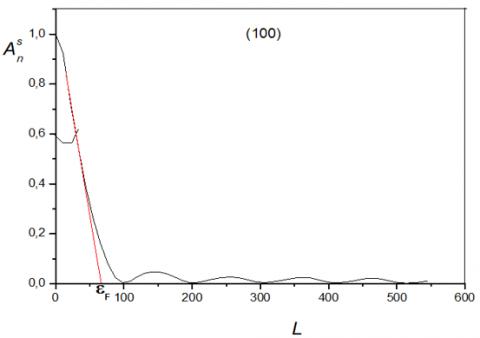
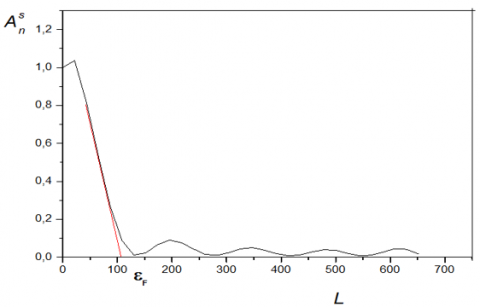
Method of Warren – Averbach. If the sample does not contain microstrain was: AD(l, s) = 1, therefore A(l, sn ) = As(l). The initial slope of the curve giving A (l, sn) according to the length L columns is inversely proportional to the apparent size of the crystallites in a direction perpendicular to the plane (hkl) considered (Figure 1). This apparent size is given by the following equation [18, 19].
$1 / \mathrm{D}_{f}=\left|\frac{d A\left(l, s_{n}\right)}{d L}\right|$
Figure 1. Fourier coefficients As (l) as a function of L
$\Delta \mathrm{s}=\lambda 2\left(\sin \theta_{2} \sin \theta_{1}\right) \theta_{1}$ and $\theta_{2}$ are the values of the limit angles that define the profile.
From the Figure 1, the point of intersection of the initial slope of the curve with the x-axis (L) provides the size Df.
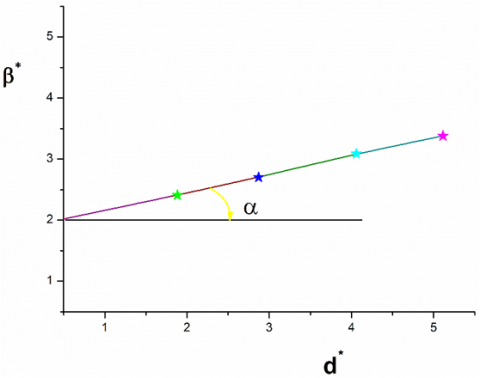
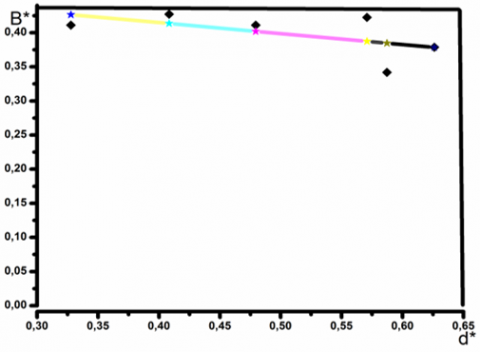
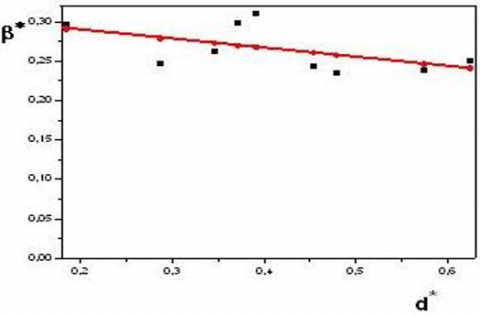
Williamson and Hall Method. This method applies to types of Voightian or pseudo-voightian profiles. She uses what is commonly called a graph of Willamson& Hall [20]. This graph, to be a straight line, gives valuable indications on the presence or absence of the microstresses in the sample. The slope of the line shows the presence of the latter (Figure 2).
Figure 2. Diagram shape of Williamson & Hall
If the profiles are purely Gaussian or purely voightian, this method provides a very simple and quick way to evaluate the effects of stress and size. For the other pseudo-voighian profiles, approximations are necessary for the separation of these two effects [21, 22].
The DD1 Kaolin which we will call M1 Kaolin, in its purest form mainly contains Kaolinite and halloysite.
The firing of ceramic materials from the silica-alumina system (containing clays or Kaolins) dissociates Kaolinite from 700℃:
$\mathrm{Al}_{2} \mathrm{O}_{3} 2 \mathrm{SiO}_{2} \mathrm{nH}_{2} \mathrm{O} \rightarrow \mathrm{Al}_{2} \mathrm{O}_{3} 2 \mathrm{Si} \mathrm{O}_{2}+\mathrm{SiO}_{2}+\mathrm{nH}_{2} \mathrm{O}$
(Kaolinite (n = 2) or halloysite (n = 4)) (metaKaolin) (Amorphous silica).
From 900℃ the metaKaolin dissociates giving in particular unstable amorphous silica [23], which. will react at higher temperatures, according to three reactions: one part with γ alumina [23-25] to give the 3Al2O32SiO2 mullite, another part will crystallize into β cristobalite, finally the remaining amorphous silica will react with the impurities metal oxides to give vitreous phases of varying compositions.
The raw M2 ore (KT2) is levied in cyclones then filtered and decanted, to bring the concentration of Kaolinite to 73% by weight, residues of quartz and mica therefore persist in appreciable proportions (between 15 and 20%). in weight. Micrographs of samples of Tamazert's Kaolin treated by rapid sintering at 1250, 1450℃ (1 hour) and 1350℃ (6h and 18h) we notice fine pores of irregular shape and very elongated in size of the order of 5 µm. Figure 3 shows the existence of large pores of the order of 40 µm of relatively regular circular shape which could be the imprint of torn grains.
Figure 3. Sintering at 1250℃/hour of the fired KT2 Kaolin
The small, irregularly shaped pores of relatively variable size on the order of 5 µm, we see the coalescence of a clover of small pores and a cluster of four pores. Inside the pores which is very irregular in shape (Figure 4) we notice the mullite needles in the form of a threadlike tangle whose length is of the order of 5 to 10 µm and whose thickness is less than 1 µm.
Figure 4. Mullite needle after sintering at 1350℃ / 6h of KT2 Kaolin
The results of observation of a sample sintered at 1350℃ for 6 h holding times, show large needles (primary mullite) of lengths varying from 5 to 10 µm, a thickness of 1 to 1.5 µm from which start new needles much thinner with entanglement in all directions and whose length is less than 0.5 µm. Since the data come from a point-by-point survey, they do not correspond to the scheme used by the Stokes method, which works on constant steps. For this reason, we have written a program that does this adaptation of the data. The profile parameters obtained for the different Kaolins are recorded in Tables (1 and 2). Since the data come from a point-by-point survey, they do not correspond to the scheme used by the Stokes method, which works on constant steps. For this reason, we have written a program that does this adaptation of the data. Table 1: Parameters of DD XR diffraction peak profiles (1100℃).
In order to adapt the standard, a least squares method has been established in the laboratory. It makes it possible to approach the widths of the diffraction peaks according to the Caglioti formula.
Moreover, from the hypothesis of a pseudo-voigtian shape of quartz peaks, we automated the obtaining of the standard corresponding to each peak of the studied sample. This makes it much easier to use the standard in analyzes of different samples. It is therefore interesting to use this second method for microstructural analysis.
Table 1. Parameters of DD X-rays diffraction profiles (1100℃)
|
hkl |
$2 \theta_{M}$ |
a |
b |
2ω (°2$\theta$) |
β (°2$\theta$) |
ф |
|
110 |
16.38 |
14.6 |
17.86 |
0.36 |
0.46 |
0.78 |
|
120 |
25.62 |
23.5 |
27.74 |
0,.34 |
0.39 |
0.87 |
|
210 |
26.22 |
23.94 |
28.50 |
0.54 |
0.61 |
0.88 |
|
001 |
31 |
29.78 |
32.28 |
0.32 |
0.42 |
0.76 |
|
220 |
33.28 |
32 |
34.76 |
0.42 |
0.48 |
0.87 |
|
111 |
35.18 |
33 |
35.70 |
0.46 |
0.50 |
0.92 |
|
230 |
40.98 |
39.50 |
42.50 |
0.36 |
0.40 |
0.90 |
|
320 |
43.4 |
41.50 |
45.40 |
0.38 |
0.388 |
0.98 |
|
240 |
52.6 |
51.28 |
54 |
0.38 |
0.41 |
0.92 |
|
041 |
57.58 |
56 |
59.50 |
0.42 |
0.44 |
0.95 |
Table 2. Parameters of KT2 X-rays diffraction profiles (1350℃)
|
hkl |
2$\theta$M |
a |
b |
2ω (°2$\theta$) |
β (°2$\theta$) |
ф |
|
110 |
16.36 |
51.30 |
17.42 |
0.34 |
0.354 |
0.96 |
|
021 |
19.50 |
18.52 |
20.48 |
0.26 |
0.273 |
0.96 |
|
200 |
23.68 |
22.58 |
24.78 |
0.38 |
0.41 |
0.92 |
|
120 |
26 |
24.62 |
27.38 |
0.38 |
0.41 |
0.92 |
|
210 |
26.28 |
25.08 |
27.48 |
0.3 |
0.33 |
0.91 |
|
001 |
31 |
30.08 |
31.98 |
0.22 |
0.25 |
0.88 |
|
220 |
33.2 |
32 |
34.4 |
0.42 |
0.43 |
0.97 |
|
111 |
35.28 |
34.02 |
36.54 |
0.34 |
0.37 |
0.92 |
|
130 |
36.86 |
35.78 |
37.94 |
36.54 |
0.42 |
0.95 |
|
230 |
40.8 |
39.62 |
41.98 |
0.34 |
0.36 |
0.94 |
|
311 |
49.48 |
48.50 |
50.46 |
0.32 |
0.36 |
0.88 |
|
041 |
57.58 |
56.66 |
58.48 |
0.38 |
0.40 |
0.95 |
|
331 |
60.62 |
59.50 |
61.74 |
0.32 |
0.33 |
0.96 |
|
002 |
64.48 |
65.00 |
63.04 |
0.38 |
0.40 |
0.95 |
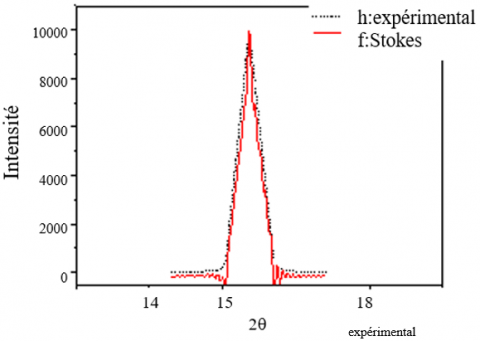
The results of the application of the Stokes method were evaluated each time by comparing the calculated profiles and the experimental profiles. Figures 5 and 6 each show the true profile and the experimental profile for a peak chosen on the spectrum of each Kaolin DD studied. As can be seen in these figures, the calculated and experimental profiles are sufficiently superimposed. From the results obtained, we will, in a next step, address the calculation of micro-structural parameters.
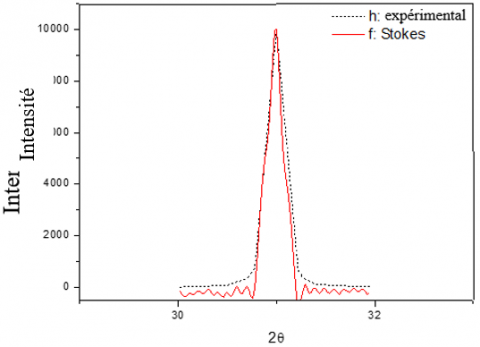
The application of the Stokes method provides the profile of the true function. Figures 7 and 8 show two profiles corresponding to the peaks respectively in 2θ = 16.36° and 2θ = 31°. In these latter figures and taking into account the difference introduced by the intrinsic effect of the sample; it is easy to see that the calculated and experimental profiles are sufficiently superimposed.
Figure 5. True profile of the peak 110 of Kaolin DD (1100°C)
Figure 6. True profile of the peak 100 of Kaolin DD (1100℃)
Figure 7. True profile of KT2 Kaolin peak 100
Figure 8. True profile of KT2 Kaolin peak 110
Diagrams of Williamson-Hall
The Williamson-Hall diagram of each of the Kaolins DD is given in Figure 9. Note that the curve is a straight line of almost zero slopes. The negative value of this slope is probably due to the accuracy of the data (obtaining the diffraction and fitting data). We deduce that the sample has no microstrains.
Figure 10 shows the Williamson-Hall diagram of Kaolin KT2. We observe that the curve is a straight line with almost no slope. As we discussed in the previous paragraph, the negative value of this slope.
Figure 9. Williamson-Hall diagram of Kaolin DD (1100℃)
Figure 10. Williamson-Hall Diagram of KT2 Kaolin
Evaluation of the size of the crystallites Kaolins DD
Since the sample does not have any microstrains, we apply the Warren and Averbach method to a non-distorted case. Figures 11 and 12 show the variation of the Fourier coefficients as a function of L (harmonic number) for two peaks of Kaolin obtained at 1100℃. (peaks 100 and 001). The slope originally obtained by extrapolation provides an average value for the crystallite size in the direction perpendicular to the diffractive plane. So:
$\left|\frac{d A_{n}}{d L}\right|_{L \rightarrow 0}=1 / \varepsilon_{f}$ (1)
$2 \theta_{1}$ and $2 \theta_{2}$ are the values of the limit angles that define the profile. Or L = nt with $t={\lambda }/{2}\;\text{ }(\sin {{\theta }_{2}}-\sin {{\theta }_{1}}).$
Figure 11. Variation of the Fourier coefficients of the peak 100 as function of L (DD 1100℃)
Figure 12. Variation of the Fourier coefficients of the peak 001 as function of L (DD 1100℃)
The values obtained for the size of the crystallites of the different Kaolins DD studied are reported in Table 3. As can be seen, the crystallites are of quasi-nanometric dimensions. This result is consistent with observations on other DD Kaolins. The values found can be somewhat confirmed by the Williamson-Hall diagram. Indeed, at the height of the right, the average size can be evaluated by:
$\varepsilon=1 / \beta^{*}$ (2)
β* being the integral width in reciprocal coordinates. For Kaolin at 1100℃, the average value found from the Williamson-Hall diagram is about 190 Å (compared with 115 Å found by the Warren &Averbach method.
Figures 13 and 14 show the variation of the Fourier coefficients as a function of L (harmonic number).
Table 3. The crystallite size of Kaolin DD obtained at 1100℃
|
hkl |
ε (Å) |
|
(110) |
70 |
|
(120) |
115 |
|
(210) |
97 |
|
(001) |
61 |
|
(220) |
115 |
|
(111) |
118 |
|
(230) |
117 |
|
(320) |
125 |
|
(240) |
133 |
|
(041) |
189 |
Figure 13. Variation of the Fourier coefficients of the peak 100 as a function of L (KT2)
Figure 14. Variation of the Fourier coefficients of the peak 001 as a function of L (KT2)
Table 4. Average size of KT2 crystallites from different diffraction peaks
|
hkl |
ε(Å) |
|
(110) |
130 |
|
(021) |
143 |
|
(200) |
109 |
|
(120) |
106 |
|
(210) |
143 |
|
(001) |
217 |
|
(220) |
132 |
|
(111) |
150 |
|
(130) |
127 |
|
(230) |
148 |
|
(311) |
173 |
|
(041) |
226 |
|
(331) |
241 |
|
(002) |
205 |
The average value of the size of the crystallites in the direction perpendicular to the diffracting plane is provided by the slope at the origin.
The values obtained for the average crystallite size are reported in Table 4.
As can be seen in Table 4, the dimensions of the crystallites are of the nanometric order.
To confirm, to some extent, the values found, we evaluated the average crystallite size from the Williamson-Hall diagram. The value found is 230 Å, which is close to the average for sizes from Warren &Averbach (245 Å).
Size distribution in the main phase of Kaolin DD and KT2
A study of the size distribution within the main phase of Kaolin DD was performed. This distribution was calculated using a parabolic approach. We only give the values of the dominant size for each peak. These values are reported in Table 5.
Table 5. Dominant size of Mullite in Kaolin DD (1100℃)
|
hkl |
Dominant size (Å) |
|
(110) |
85 |
|
(210) |
124 |
|
(001) |
71 |
|
(220) |
64 |
|
(111) |
61 |
|
(230) |
52 |
|
(320) |
76 |
|
(240) |
36 |
|
(041) |
49 |
The values of the dominant size evaluated by the relation of the second derivative of the different peaks of the principal phase of Kaolin KT2 are given in Table 6.
Table 6. Dominant size of the main phase of Kaolin KT2
|
hkl |
Dominant size (Å) |
|
(110) |
82 |
|
(210) |
120 |
|
(001) |
73 |
|
(220) |
64 |
|
(111) |
60 |
|
(230) |
52 |
|
(320) |
72 |
|
(240) |
40 |
|
(041) |
51 |
According to this table, the average arithmetic size of the crystallites is 164 Å. From the Williamson-Hall diagram, we can estimate this average size (this time in the least squares sense): it is 229 Å. The relative difference between the two values is less than 40% [26], which, in our opinion, is acceptable since the size for a single crystallite can vary enormously depending on the direction of the diffracting planes and, moreover, there exist several crystallites of dimension diffracting variable in the same direction.
The methods for the determination of microstructural parameters from the analysis of the diffraction peaks were primarily developed for X-ray diffraction The Warren-Averbach method requires no assumption about the shape of the diffraction peaks and it is the most rigorous. However, it is very sensitive to the phenomenon of truncation profile and an overestimation of background noise that can lead to an error of 20-40% on the determination of the Fourier coefficients. In the method of Sprauel, the Fourier coefficients are determined by smoothing each diffraction pattern by a mathematical function (generally Voigt), fitted to the experimental values by a least-squares optimization. In addition, this method allows to take into account the effects due to the heterogeneity of elastic deformations. The analysis is performed on two further orders of the same reflection. Methods based on the analysis of a single diffraction peak based on fairly restrictive assumptions about the shape of the peaks and the contribution of the effects of size and shape. They are rather qualitative analysis methods, but quick and easy application. The results obtained in the simplest cases (isotropic cubic) are in agreement with those obtainable with the methods based on the analysis of two orders of reflection.
By studying the contours of the lines by DRX, it seems very clear that the main phase of many sintered Kaolin, mullite, is devoid of internal micro-chains. This is the case for mixtures whipped not only at low temperature (1100℃) for one hour, but also for mixtures of the chamotte cooker type with a temperature of 1350℃ for very long periods (several weeks).
The Williamson-Hall diagram was constructed and constructed to determine if a sample is affected by deformation and to determine the size of the crystals. Since the specimen has no small folds, we apply the Relation of Scherrer. The Warren and Averbach method were also used in an undistorted condition.
This result is very important because it gives an element of explanation for a very large quality of mullite: its mechanical resistance during repeated uses at high temperatures.
The Authors are thankful to Dept. of Material Science, University of Biskra, Biskra for XRD facility.
[1] Vives, S., Gaffet, E., Meunier, C. (2004). X-ray diffraction line profile analysis of iron ball milled powders. Materials Science and Engineering: A, 366(2): 229-238. https://doi.org/10.1016/S0921-5093(03)00572-0
[2] Gonçalves, N.S., Carvalho, J.A., Lima, Z.M., Sasaki, J.M. (2012). Size–strain study of NiO nanoparticles by X-ray powder diffraction line broadening. Materials Letters, 72: 36-38. https://doi.org/10.1016/j.matlet.2011.12.046
[3] Mote, V.D., Purushotham, Y., Dole, B.N. (2012). Williamson-Hall analysis in estimation of lattice strain in nanometer-sized ZnO particles. Journal of Theoretical and Applied Physics, 6(1): 6. https://doi.org/10.1186/2251-7235-6-6
[4] Lock, J.T., Parker, I. (2020). IP3 mediated global Ca2+ signals arise through two temporally and spatially distinct modes of Ca2+ release. Elife, 9: e55008. https://doi.org/10.7554/eLife.55008
[5] Basciano, L.C., Peterson, R.C. (2007). Jarosite–hydronium jarosite solid-solution series with full iron site occupancy: mineralogy and crystal chemistry. American Mineralogist, 92(8-9): 1464-1473. https://doi.org/10.2138/am.2007.2432
[6] Pourghahramani, P., Altin, E., Mallembakam, M.R., Peukert, W., Forssberg, E. (2008). Microstructural characterization of hematite during wet and dry millings using Rietveld and XRD line profile analyses. Powder Technology, 186(1): 9-21. https://doi.org/10.1016/j.powtec.2007.10.027
[7] Bhakar, A., Pandey, A.H., Singh, M.N., Upadhyay, A., Sinha, A.K., Gupta, S.M., Rai, S.K. (2017). Effect of processing parameters on microstructural properties of lead magnesium niobates. Acta Crystallographica Section B: Structural Science, Crystal Engineering and Materials, 73(6): 1095-1104. https://doi.org/10.1107/S2052520617012872
[8] Uvarov, V., Popov, I. (2007). Metrological characterization of X-ray diffraction methods for determination of crystallite size in nano-scale materials. Materials Characterization, 58(10): 883-891. https://doi.org/10.1016/j.matchar.2006.09.002
[9] Williamson, G.K., Hall, W.H. (1953). X-ray line broadening from filed aluminium and wolfram. Acta Metallurgica, 1(1): 22-31. https://doi.org/10.1016/0001-6160(53)90006-6
[10] Lakel, A. (2019). Microstructural studies of materials DD1 and KT2 by X-ray diffraction. Journal of Building Materials and Structures, 6(1): 20-31. https://doi.org/10.5281/zenodo.2606600
[11] Avillez, R.R.D., Abrantes, F.G., Letichevsky, S. (2018). On the intrinsic limits of the convolution method to obtain the crystallite size distribution from nanopowders diffraction. Materials Research, 21(3). https://doi.org/10.1590/1980-5373-mr-2017-0980
[12] Bot, A., Aldea, N., Matei, F. (2015). Experimental data deconvolution based on Fourier transform applied in nanomaterial structure. In Fourier Transform-Signal Processing and Physical Sciences. IntechOpen. https://doi.org/10.5772/59667
[13] Matei, F., Aldea, N., Rada, M., Pop, I. (2016). Fundamental parameter method applied to X-ray line profile analysis. Bulletin of University of Agricultural Sciences and Veterinary Medicine Cluj-Napoca. Horticulture, 73(2): 310-314. http://dx.doi.org/10.15835/buasvmcn-hort:11954
[14] Poudeu, R.C., Ekani, C.J., Djangang, C.N., Blanchart, P. (2019). Role of heat-treated laterite on the strengthening of geopolymer designed with laterite as solid precursor. Annales de Chimie - Science des Matériaux, 43(6): 359-367. https://doi.org/10.18280/acsm.430601
[15] Williamson, G.K., Smallman, R.E. (1956). III. Dislocation densities in some annealed and cold-worked metals from measurements on the X-ray debye-scherrer spectrum. Philosophical Magazine, 1(1): 34-46. https://doi.org/10.1080/14786435608238074
[16] Balzar, D., Ledbetter, H. (1993). Voigt-function modeling in Fourier analysis of size- and strain-broadened X-ray diffraction peaks. J. Appl. Cryst., 26: 97-103. https://doi.org/10.1107/S0021889892008987
[17] Balzar, D. (1999). Voigt-function model in diffraction line-broadening analysis. International Union of Crystallography Monographs on Crystallography, 10: 94-126. https://doi.org/10.1107/S0021889804022551
[18] Marinkovic, B., Avillez, R.R.D., Saavedra, A., Assunção, F.C.R. (2001). A comparison between the Warren-Averbach method and alternate methods for X-ray diffraction microstructure analysis of polycrystalline specimens. Materials Research, 4(2): 71-76. https://doi.org/10.1590/S1516-14392001000200005
[19] Rivnay, J., Noriega, R., Kline, R.J., Salleo, A., Toney, M.F. (2011). Quantitative analysis of lattice disorder and crystallite size in organic semiconductor thin films. Physical Review B, 84(4): 045203. https://doi.org/10.1103/PhysRevB.84.045203
[20] Williamson, G.K., Hall, H.W. (1953). X-ray line broadening from filed aluminium and wolfram. Acta Metallurgica, 1(1): 22-31. https://doi.org/10.1016/0001-6160(53)90006-6
[21] Irfan, H., Racik, K.M., Anand, S. (2018). X-ray peak profile analysis of CoAl2O4 nanoparticles by Williamson-Hall and size-strain plot methods. Modern Electronic Materials, 4(1): 31-40. https://doi.org/10.3897/j.moem.4.1.33272
[22] Nath, D., Singh, F., Das, R. (2020). X-ray diffraction analysis by Williamson-Hall, Halder-Wagner and size-strain plot methods of CdSe nanoparticles-a comparative study. Materials Chemistry and Physics, 239: 122021. https://doi.org/10.1016/j.matchemphys.2019.122021
[23] Alves, H.P., Silva, J.B., Campos, L.F., Torres, S.M., Dutra, R.P., Macedo, D.A. (2016). Preparation of mullite based ceramics from clay–Kaolin waste mixtures.Ceramics International, 42(16): 19086-19090. https://doi.org/10.1016/j.ceramint.2016.09.068
[24] Aksay, I.A., Dabbs, D.M., Sarikaya, M. (1991). Mullite for structural, electronic, and optical applications. Journal of the American Ceramic Society, 74(10): 2343-2358. https://doi.org/10.1111/j.1151-2916.1991.tb06768.x
[25] Cheraitia, A., Redjimi, Z., Bououdina, M. (2020). Novel mullite-cordierite ceramic refractory fabricated from halloysite and talc. International Journal of Applied Ceramic Technology, 18(1). https://doi.org/10.1111/ijac.13633
[26] Louër, D. (2003). Microstructure et profil des raies de diffraction des rayons X. In Journal de Physique IV (Proceedings), 103: 321-337. https://doi.org/10.1051/jp4:200300013