Saida Boualleg
© 2021 IIETA. This article is published by IIETA and is licensed under the CC BY 4.0 license (http://creativecommons.org/licenses/by/4.0/).
OPEN ACCESS
The objective of this work is the quantification of hydration in cement. To monitor this quantity of hydrated cement "hydration degrees" we adopted the method of thermogravimetric analysis (TGA) which allowed us to determine the degree of hydration α(t), bound water (WB) and non-evaporable water. This study is completed by the analysis of diffractometers (DRX). Cements containing different percentages of slag. The evolution of the kinetics was studied during 3, 7 and 28 days. According to the results obtained, the hydration rate is inversely proportional to the addition content in the cement. The degree of hydration is directly related to the formation of hydrates and portlandite, more non-evaporable water retained in the hydrates corresponds to a high degree of hydration. This technique is coupled with the carbonation and strength of ordinary mortar. The experimental data obtained have been correlated and interpreted with regard to the evolution of strength and carbonation as a function of the degree of hydration, bound water and non-evaporable water of the cement hydrates. The Bhatty method is verified for the calculation of the degree of hydration and can be successfully applied for composite cements.
hydration, bound water, degrees of hydration, slag, strength, thermogravimetric analysis, portlandite, non-evaporable water
Cement hydration is a sum of chemical processes that lead to the changes of anhydrous phases into different hydrated phases. These chemical transformations are accompanied by a set of physical processes that participate in the construction of the microstructure of the cement paste the process of hydration of cements combined by more or less reactive secondary additions is necessary and more complicated, Nevertheless, these mineral additions modify the treated hydration by physical and chemical means, often quite difficult to dissociate [1, 2].
The need for cement dependent on secondary environmental additions is to remove by-products. These secondary cements react more slowly than the cement clinker, and due to the need for suitable properties at an early age, this restricts the levels of substitution. At the rate of reaction of these mineral additions, it is important to have a simple means of assessing the degree of hydration [3, 4].
Cement combined with water produces a more or less viscous paste, which can be poured and then. This is one of the key benefits of the concrete industry. Cement hardens in a few hours and can withstand heavy mechanical loads in a couple of days.
This hardening is the product of cement hydration. This is a dynamic mechanism that produces such phenomena, such as the release of heat and the creation of resistance. It is often important to identify a macroscopic variable to track the hydration of cement globally by means of the ratio between the mass of hydrated cement and the mass of cement initially added. The description, typically used for the degree of hydration, is proposed (α) [5].
The hydration of Portland cement is the series of chemical reactions that allow the passage from a viscous state to a solid state. The development of several new components called hydrates follows this hardening. The amount of hydrates produced represents the amount of cement that has reacted with water. It is for this reason that their quantification has attracted the attention of many researchers, using different methods and techniques. They have defined that: the quantity of hydrates produced shows the progression of the hydration of the matrix, which is observable through.
The degree of hydration. Theoretically, the higher the hydrate content, the stronger the material is, i.e. the mechanical strength increases with the hydrate content.
To monitor hydration by the evolution of the quantity of cement hydrated, define the degree of hydration. By thermogravimetric analysis (TGA) [6], under the effect of high temperatures, these hydrates decompose by releasing water. The evaluation of these mass losses makes it possible to quantify the quantities of water that have reacted with the cement (non-evaporable water), which is the principle of this technique.
The difficulty of this method (TGA) lies in the determination of the temperature intervals corresponding to each hydrate and which vary according to the authors [7]. This formula has recently been reformulated and simplified by some researchers, allowing the development of simpler equations based on the mass losses recorded in the temperature ranges relative to each of the hydrated phases.
The authors presented three methods for the calculation of the degree of hydration based on the spectra of the thermogravimetric analysis (TGA).
The first method of Bhatty's method [8] is based on the following formula:
wtih: $\alpha(\mathrm{t})=\frac{W_{B}}{0.24}$ (1)
WB = Ldh + Ldx+ 0.41Ldc.
The value 0.41 represents the conversion factor to take into account the bound water contained in the carbonated Portlandite. (WB) refers to the sum of chemically bound water at time t.
The value of 0.24 is the mass proportion of water required for complete hydration (100%) of the cement (in g / g of cement) deduced from Bogue's formula. Ldh, Ldx and Ldc represent the mass losses related to the decomposition of hydrates, portlandite and limestone respectively, and derived from (TGA) spectra in the given temperature ranges.
The second method is that of Pane [3]. It is based on the following equations:
$\alpha(t)(\%)=\frac{W_{B}}{W_{B \infty}}$ (2)
with: WB = Ldh + Ldx+ (Ldc - Ldca).
where, Ldca is the relative mass loss recorded in the temperature range between 600 and 780℃, due to the decomposition of CaCO3 in (TGA) tests performed on anhydrous cement. The subtraction of this mass loss from the total mass loss due to decarbonation is due to the mass loss recorded by the authors during the tests performed on anhydrous cements.
(WB∞): This value can vary between 0.23 and 0.25 according to the different authors [5, 8].
The third method is the Monteagudo method [9]. It takes into consideration the two parameters, Ldca (mass loss relative to decarbonation of anhydrous cement) and 0.41 (conversion coefficient related to carbonated portlandite).
$\alpha(t)(\%)=\frac{W_{B}}{W_{B \infty}}$ (3)
with: WB = Ldh + Ldx+ 0.41 (Ldc – Ldca).
According to Deboucha et al. [10], the chemical reactions of composite cements are defined by the hydration degree parameter. The methods suggested by Bhatty [8] determine the degree of cement hydration. The evaporable water and hydrate decomposition represents the first phase between 25 and 400℃, between 400 and 600℃ which represents the dehydroxylation of Portlandite indicated by the evaporation of Ldx. The third phase associated with the decarbonation of CaCO3 mentioned by ldc and the decomposition of hydrates and the evaporation of the Ldh mentioned between 105℃ and 400℃.
Pane et al. and Deboucha et al. [3, 10] are becoming a fundamental approach to understanding mineral addition hydration processes. Monteagudo et al. [9] recently proposed a model that provides the researcher with a way of understanding the effects of mineral additions in cements on hydration kinetics.
However, to estimate the degree of hydration, it is necessary to know the chemically bound water content (WB1) of our compound cement paste [10].
According to Mong [11] the effect mineral additions in composite cements on hydration kinetics have been studied using his process. The values of the degree of hydration (WB1) in mineral admixture-based composite cement pastes are obtained by the adjusted TG method, which seems reasonable compared to the conventional methods used.
Numerical research, according to Rivera, based on chemical stoichiometry [9, 12, 13]. Nevertheless, there may be variations in the composition and precision of anhydrous mineral mixtures and also in hydrated materials, which greatly affect the final amount of combined water.
It is well known that portlandite is an important product of cement hydration. The portlandite content reflects the degree of hydration of the cement, and secondary additions can also indicate the degree of pozzolanic activity. Lower levels of portlandite in admixed cement paste indicate lower hydration levels, as shown in other studies [2, 14, 15].
Using the results of thermogravimetric analysis, conventional methods for assessing hydration rate based on chemically bound water content. It is a little complicated to suggest a hydration level of cement with mineral additions. Instead of estimating the amount of chemically bound water, Mong [11] provides a direct estimate of the amount of secondary additions contributing to the hydration reaction
The degree of hydration is defined as the more generalized ratio between the quantity of cement reacted at 't' about the initial quantity Briffaut [16]. It presents the ratio of the value of a property (physical or chemical) considered at a given time to its ultimate value [17].
The degree of hydration is connected to the formation of hydrates in cement, especially hydrated calcium silicates and portlandite [18], since the formation of the last Portlandite crystals theoretically corresponds to a degree of hydration of 100%. Its principle is based on the hypothesis of mass conservation. It gives the hydration rate of cement at a given moment in time, compared to the maximum hydration rate that the cement can reach if it consumes all its water.
To calculate it, thermogravimetric analysis (DTA/ATG) is one of the most widely used techniques. The analysis is carried out on composite cements based on anhydrous or hydrated additions; this analysis has been studied by Pane and Hansen [3] using thermogravimetric analysis and isothermal calorimetry.
The amount of water loss was estimated and is regarded as bound water between 105℃ and 450℃ and is expressed at 450°C as the percentage of the ignited weight.
They found that the collected chemically bound water is proportional to the hydration heat and can be used as a hydration measure. To measure the pozzolanic reaction, the mass loss from hydration products due to dehydroxylation of portlandite can be used, the results of Escalante et al. [19] the quantification of the degree of hydration using chemically bound water indicates that overall hydration is delayed, especially for paste-containing slag, in the presence of pozzolans. Whittaker et al. [20] calculated the sum of Ca(OH)2 at 450-550℃ by thermogravimetric analysis.
They observed that this quantity decreases significantly with the increase in the percentage of substitution slag. They explained this observation by the fact that the hydrated cement produces portlandite and the slag consumes it to form additional hydration products [21].
The authors presented several methods for calculating the degree of hydration based on ATG spectra such as the Bhatty’s method [8].
This second phase varies from one author to another, as Loukili and al. and Monteagudo et al. [9, 22] have suggested, the temperature intervals between evaporation of free water and hydrate-bound (chemically bound) water respectively.
According to these methods it is suggested (Table 1) to calculate the mass losses in the temperature ranges from 105℃ to 450℃ (water evaporation from C-S-H hydrates), from 450℃ to 580℃ (water evaporation) due the dehydroxylation of Portlandite) and from 600 to 1000℃ (CO2 evaporation) due to decarbonation of CaCO3.
Table 1. The temperature ranges of mass losses suggested by the three methods are as follows [9]
|
Temperatures (℃) |
Bhatty [7] |
Pane [3] |
Monteagudo [8] |
|
Ldh |
105-440 |
140-440 |
105-430 |
|
Ldx |
440-580 |
440-520 |
430-530 |
|
Ldc |
580-1000 |
520-1100 |
530-1100 |
The objective of our work is to evaluate the amount of bound water and the hydration rate of slag cement by the method of thermogravimetric (DTA/TGA) tests performed on hydrated cement paste with different slag content. The experimental data obtained are compared and interpreted in terms of the development of strength and carbonation as a function of hydration cement, bound water and non-evaporable water. The approach followed in this investigation is part of an experimental verification of this opinion.
2.1 Cement
The preparation of several types of cement concerns the characterization of these compositions according to the content of addition in the clinker:
- (CSL30% -CEMII / B-S) class 32.5 MPa with 30% slag.
- (CSL20% -CEMII /A-S) class 32. 5 MPa with 20% slag.
- (CSL 10% -CEMII /A-S) class 32.5 MPa with 10% slag.
- Ordinary Portland cement (OPC-CEMI/52.5) class 52.5 MPa. The chemical composition (Tables 2 and 3) is determined by XRF fluorescence, mineralogical for clinker (Table 4), Physical properties (Table 5) [23-25].
Table 2. Cement's chemical properties [26].
|
Chemical Composition (%) |
||||||||
|
Cement type |
CaO |
SiO2 |
Al2O |
Fe2O3 |
MgO |
Na2O |
K2O |
SO3 |
|
OPC |
64.4 |
20.2 |
5.13 |
3.73 |
1.69 |
0.16 |
0.62 |
2.2 |
|
CSL10% |
59.3 |
21.2 |
5.23 |
5.82 |
1.87 |
0.11 |
0.32 |
2.5 |
|
CSL20% |
60.8 |
23.3 |
6.24 |
5.42 |
2.85 |
0.11 |
0.32 |
1.8 |
|
CSL30% |
62.1 |
25.4 |
7 |
5.1 |
3.56 |
0.11 |
0.34 |
1.9 |
Table 3. Slag's chemical properties (raw material)
|
Chem. Comp (%) |
CaO |
SiO2 |
AL2O |
Fe2O3 |
MgO |
Na2O |
K2O |
SO3 |
PAF |
CL- |
|
Slag |
36.76 |
40.58 |
11.62 |
0.62 |
9.05 |
0.39 |
0.43 |
0.41 |
0.02 |
0.018 |
Table 4. Mineralogical composition of clinker (%) [26]
|
Composition mineralogical (%) |
|||
|
C3S |
C2S |
C3A |
C4AF |
|
64.4 |
20.25 |
5.13 |
3.73 |
Table 5. Physical properties [27]
|
|
Properties physiques |
|
|
|
Blain fineness (cm2/g) |
Density (g/cm3) |
|
OPC |
3890 |
3.17 |
|
CSL10% |
3780 |
3.14 |
|
CSL 20% |
3760 |
3.12 |
|
CSL 30% |
3660 |
3.06 |
Blended Cement (cement based added) = Addition/clinker (%).
1. OPC*: Artificial Portland cement= 0/clinker = 0/100.
2. CSL10%: Cement with slag addition, SL/clinker=10/90.
3. CSL20%: Cement with slag addition= SL/clinker =20/80.
4. CSL30%: Cement with slag addition = SL/clinker= 30/70.
We can see that the percentage of sulfuric anhydride (SO3) content is less than 4%. This is in accordance with the NF EN 197-1 standard [26].
Table 5 has the fineness and density of cement, according to the NF EN 196-6 standard) [27].
2.2 Standardized sand
The CEN standardized sand (ISO standardized sand) (Standard EN 196-1) [28] is a natural sand, siliceous, especially in its finest fractions. It is clean, the grains are of generally isometric and rounded shape. It is dried, screened and prepared in a workshop (new society of littoral, origin of France). Modern offering all guarantees of the quality and regularity of such material.
2.3 The mixing water
The mixing water should be as pure as possible, it should not contain a quantity of water that is not excessive silt, organic materials, acids. The mixing water used in our study for the preparation of mortars and pastes pure according to the standard NF P 18- 404 [29] and distilled water.
Four mortars are studied, according to standard EN 196-1(2006) [30], (standardized sand, W/B = 0.5 and B/S = 1/3). The size of the specimens selected is (4x4x16) cm3.
The samples are demoded after 24 hours and stored in water and air according to the method of storage. The tests carried out are the heat of hydration, the compressive strength and the natural carbonation at (d) day.
3.1 Heat of hydration measurement
In the framework of our study, the aim is to evaluate the impact of the slag addition rate to Portland clinker on temperature variations and the quantities of heat released, since it is the latter that will partly condition the behavior of cements in the short, medium and long-term. The test is carried out on three types of cement (OPC), (CSL10%, CSL20%) and (CSL30%). Temperature variations are evaluated using the LANGAVANT calorimeter.
The semi-adiabatic calorimetry LANGAVANT is defined by the standard NF P 15 – 436 [31]. This method consists in introducing a normal mortar, as soon as it has been mixed, into a DEWAR vessel in order to determine the quantity of heat released according to the temperature evolution.
3.2 Compression test on mortar
Tests are carried out in compliance with the NF EN 196-1 standard [30]. The size of the specimens selected is (4x4x16) cm3. The half pieces obtained after the test by bending were subjected to compression test to evaluate the strength of mortars.
3.3 Detection of Carbonation depth measurement
The detection of PH less than 9 decarbonate called front to evaluate the depth of carbonation, a coloured indicator, phenolphthalein, is generally used. The coloured indicator test consists of spraying a phenolphthalein solution with a sprayer [32] on the surface subjected to carbonation.
3.4 Microstructure tests
3.4.1 Analysis (XRD)
This method of analysis is used to perform quantitative or semi-quantitative analyses to identify the nature and structure of materials.
The analysis of the samples was carried out in the laboratory of the physics department, M’sila University. The apparatus used is a SIEMENS D5000 Diffractometer equipped with a cobalt anticathode and a rear monochromator and coupled to a computer system that allows the automatic exploitation of the results.
The mineralogical analyses were carried out on powders (less than 80 μm). For each sample, the analysis was carried out on the external face, which was then abraded to a thickness of a few tens of micrometers. The surface thus discovered was then subjected to analysis.
3.4.2 Thermogravimetric analysis of cement paste
Thermo-gravimetric analysis is a thermo-balance used to measure changes in mass. These mass variations correspond, among other things, to the dehydration and dehydroxylation of hydrates and the decomposition of calcite.
The thermal analysis used is NETZSCH STA 409. The rate of temperature rise used for our tests is 10°C/min the atmosphere is reconstituted air (80% N2 and 20% O2) The products of cement hydration decompose in a TGA test.
The mass of the sample is equal to a maximum of 2000 mg, it is conditioned by the size of the crucible used during the heating up to 1000°C with a ramp of 10°C/min.
Cement pastes have been prepared with a ratio W/B=0.27, for the pure paste four types of cements containing a substitution rate of slag by clinker of (10%, 20%, 30%), kept in water for 3, 7 and 28 days, the sample sizes are cylindrical Moulds in PCV (2.5/5.5) cm3.
3.4.3 Hydration monitoring
The preparation of the pure paste samples for the DTA - TGA and XRD test was carried out by stopping the hydration reaction as a function of the ages of 3.7 and 28 days.
Hydration monitoring is performed on micro test tubes of cement paste on which hydration arrest (acetone arrest) is performed at (d) days. The influence of the storage mode on hydration is studied for both air and water modes.
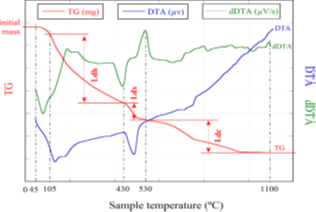
Figure 1. Generic DTA–TG curves of cement paste [9]
According to Monteagudo et al. [9], Figure 1 shows the content of water lost between 105°C and 450°C was measured as bound water, which shows at 450°C the weight lost. Water from calcium silicate hydrate hydrates will be captured to avoid mass loss associated with portlandite dehydroxylation and calcium carbonate carbonation. The content of portlandite is part of the water in the hydrates and contributes only by the cement because the hydration of the slag does not produce it.
The interval that shows the evaporation of water and the beginning of hydrate dehydration was specified as two temperature ranges, 105℃ and 450℃ for which we have chosen a temperature limit of 105℃ [9].
The method proposed by Bhatty [8], allows to directly calculate the degree of hydration (α) from the experimental results by thermogravimetric DTA / TGA analysis. The methodology is comfortable and offers data on the evolution of the hydration mechanism. Mass loss results due to dehydration and carbonation are measured. These variations become more important in cements with additions [9].
3.4.4 Evaluation of the bound water content (WB) and degree of hydration (α)
Evolution of the degree of hydration according to Bhatty's method [8] and the bound water content (WB) as a function of the loss in mass, the degrees of hydration calculated according to the equation formula:
$\alpha(t)=\frac{W B}{0.23}$
And deduced from TGA spectra performed on samples of cement pastes cured at 3, 7 and 28 days. Recall that:
WB = Ldh + Ldx+ 0.41Ldc
According to Bhatty's formula [8].
Z = 0.24 C3S + 0.21 C2S + 0.4 C3A + 0.37 C4AF, according to Bogue ‘s formula [9]. Hence for our cement Z equals 0.23.
3.4.5 Non-evaporable water
The quantity of hydrates (CSH) represents the development of exchange reactions between the anhydrous components, determined by measuring the quantity of evaporated water chemically bound to the hydrates [19-33].
with:
N.E.W (%) = [(W105° - W450°) / W450°] × 100 (4)
N.E.W: quantity of non-evaporable water.
W105°: Mass loss at 105 °C is calculated of the initial mass burned.
W450°: Mass loss at 450 ° C is calculated of the initial mass burned.
4.1 Heat of hydration of the cements studied
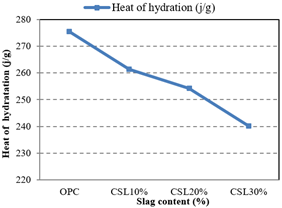
Figure 2 indicates that as the quantity of slag in the cement increases, the heat flux decreases to its limit. An increase in the amount of slag content decreases the hydration heat. In the OPC reference paste, the hydration heat of 275.5 J/g was reduced to 261,334 J/g, 254,251 J/g and 240,085 J/g for 10%, 20% and 30% replacement of cement by slag respectively.
The dilution effect can be due to this reduction. Indeed, an increase in the rate of mineral addition is followed by a decrease in the content of the clinker, which naturally implies fewer hydration products [34, 35]
These results are in good agreement with those of [36, 37], they actually found that the total heat of the cement paste containing 30% Slag was 200 J/g after 140 h of hydration, compared to 260 J/g for the reference cement paste.
Figure 2. Heat released from the cements studied
4.2 Influence of slag content on compressive strength (water cure)
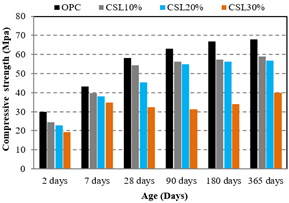
It can be shown according to the results obtained in Figure 3 that the compressive strength of mortars increases proportionally with age and decreases with increasing slag content.
There is a systematic decrease in compressive strength concerning replacement by slag, especially at younger ages when compared with the OPC control mortar. The increase in resistance due to the pozzolanic effect takes its full extent in the long term; this behaviour is expressed by low resistance at a young age.
Figure 3. Compressive strength (Mpa) as a function of age (%), (parameter; slag content) (water cure)
The curing kinetics curves clearly show the lower curing kinetics of slag cements compared to OPC. The favourable effect on the curing kinetics is also noted in the longer curing time of up to one year so that the strengths of CHF and CPJ are somewhat similar to those of OPC [38].
The positive influence of mineral additions is not noticed during the first few days because hydration is slow. After 28 days, an improvement in resistance is observed.
In fact, Baron [39] showed by several studies that the different properties studied of the interactions of the cement paste with an addition such as slag could have a delaying effect more important than the accelerating effect at a young age.
It is observed that the gain rate of the resistance of the OPC control mortar kept in water is 50% between 2 days and one year, and a 48.7% gain rate between 2 days and 28 days, for the CSL10% mortar the gain rate is 58%. 5% between 2 days and one year, and a 55% gain rate between 2 days and 28 days, for CSL20% mortar the gain rate is 60% between 2 days and one year, and a 36% gain rate between 2 days and 28 days, and for CSL30% mortar the gain rate is 47% between 2 days and one year, and a 40% gain rate between 2 days and 28 days.
4.3 Influence of slag content on compressive strength (air cure)
According to the results obtained in Figure 4, shows that the samples left in the air have the lowest resistance. Increasing the slag content in the cement leads to an approximately directly proportional decrease in compressive strength.
An approximate explanation lies in the fact that the specimens having been kept in the air, most of the mixing water they use is lost due to lack of hydration. As a result, the resistance was stopped. The skin is easily broken down and lowers air retention at low compressive strengths in the long run due to the hydration process due to low water scarcity [40, 41]. There is no influence of the type of addition on the short term strengths for this type of cement. In the case of the different cements CSL10% and CSL20% and CSL30%, the partial replacement of clinker by a mineral addition (the latent pozzolanic effect), it is observed that the gain rate of the mortar preserved in the air is less than that preserved in water.
For the OPC control mortar preserved in air, the gain rate is 37.22% between 2 days and one year and again rate 38. 7% between 2 days and 28 days, for CSL10% mortar the gain rate is 45.2% between 2 days and one year, and again rate of 35.2% between 2 days and 28 days, for CSL20% mortar the gain rate is 53. 6% between 2 days and one year, and a gain rate of 27.8% between 2 days and 28 days, for mortar CSL30% the gain rate is 7.41% between 2 days and one year, and again the rate of 46.53% between 2 days and 28 days.
Figure 4. Compressive strength (Mpa) as a function of age (%), (parameter; slag content) (air cure)
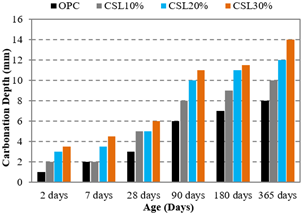
4.4 Influence of slag content on carbonation depth
4.4.1 Phenolphthalein carbonation kinetics
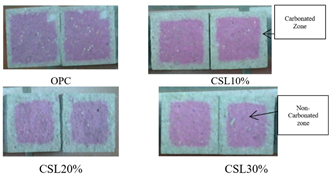
As shown in Figure 5 the carbonated area of the samples takes on the colour of the mortar, while the healthy area takes on a pink colouring. The reference samples are entirely pink in colour, meaning that they are not carbonated during the storage time.
Figure 5. Carbonation fronts visualized following spraying with phenolphthalein at 28 days. (Depths of carbonation: OPC: 3 mm; CL10%: 4 mm; CL20%: 5 mm; CL30%: 5 mm). In air (T=20°C, RH=65%)
Figure 6. Effect of slag content (%) on carbonation depth (mm) (air cure)
This Indicator becomes colourless at a pH below 9. On the other hand, the usual pH of the cementitious matrix rises to around 12.5 before carbonation (equilibrium pH of the portlandite) and drops rapidly to 8 once carbonated [41, 42].
It is, therefore, the absence of portlandite that is supposed to demonstrate that the mortar is carbonated. The natural carbonation of the test specimens (Figure 6) is the method closest to reality, it was found that carbonation of the C-S-H gel resulted in the formation of amorphous CaCO3. [43, 44]. The OPC mortar control sample has a fully coloured depth; it has a healthy state less degraded depth. Figure 6 shows that the depth of carbonation is greater for mortars with certain additions content [45, 46].
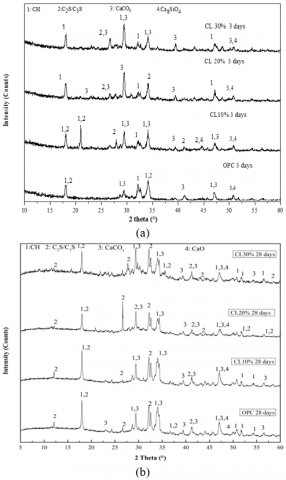
4.5 Mineralogical analysis
The study of the modification of hydration products of cements as a function of the hardening age, the spectra in the region of 2θ between 5˚ and 60˚ are stacked. Figure 7 (a), (b) shows the XRD patterns of cement with different hydrated slag content for 3, 28 days, this may be because the main hydration products were hydrated calcium silicates, portlandite and calcium carbonates, plus non-hydrated products and C2S, C3S and CaO. Peaks in calcium silicate phases decrease with age.
The OPC diagram at three days (Figure 7 (a) shows the onset of hydration with the appearance of portlandite and hydrated silicates and the decrease in anhydrous including tricalcium silicate, bicalcium silicate (β), and tricalcium aluminate. This trend of increasing portlandite peak is of course confirmed at 28 days.
Figure 7. XRD of hydrated cement pastes at different ages (a) 3 days and (b) 28 days (OPC, CSL10%, CSL20%, CSL30%)
The analysis carried out under the same conditions on the rest of the cements with slag, the cement of hydrated pastes at the same deadlines gives globally the same information: same hydrates, same peak evolutions. Cements of varying ages reveal identical arrays of peaks of diffraction.
According to the Figure 7 (a), (b) the essential peak grades of the minerals detected by XRD marked by portlandite (CH) is a hydrated secondary product resulting from the reaction of a crystalline mineral with water to form the paste, calcite and larnite (β-C2S/C3S) at lower intensities [47]. The presence of calcite is attributable to the slag expander and to the carbonation of CH during paste setting and hardening [48]. Due to its low reactivity, β-C2S is present as a non-hydrated cement component. It is well known that the reactive component of pozzolanic gels, amorphous silica, is an essential component of DNA. To generate an additional hydration product, it can react with CH. In general, the degree of pozzolanism of the reaction is regulated by CH consumption in cement pastes. The same remark by diffractometric analysis (XRD), the length of the essential peaks that reflect the content of portlandite in the reference cement (OPC) especially Compared with the rest of the cement at 28 days of age [48].
4.6 Thermogravimetric analysis
The Figure 8 (a), (b) show the (DTA/TGA) results of the hydrated cement pastes as a function of age. In order to evaluate the degree of pozzolanic reaction, the TGA curves are used to determine the mass losses of about 100, 200, 450 and 850°C, the dehydration of (Ldh) representing the evaporation of free water in C-H-S, the dehydroxylation of portlandite also presented by the evaporation of chemically bound water in portlandite (Ldx) and the decarbonation of calcium carbonates (Ldc) presented by the evaporation of CO2.
In the 100-200°C zone, dehydration of C-S-H gels takes place. It can be observed as a wide band that moves towards temperatures as the age of hydration increases. This change takes place with a great loss of mass. The weight reduction is mainly due to the decomposition of ettringite, gypsum and AFM phases below 170°C, the dehydration of CSH [49].
This loss of masse decreases proportionally as the substitution rate of the addition increases. The replacement of part of the cement by an addition slows down the hydration reaction, may result in the dilution of the clinker part of the cement with concomitant reduction of the aluminate and calcium silicate content of the cement [38].
The second major mass loss can be observed in the range 450-550°C, which is attributed to the decomposition of the crystalline Ca(OH)2 produced by the hydration of the calcium silicate phases of composite cements.
The data showed that the Ca(OH)2 content of the reference cement paste is higher as a function of the age of hydration when compared with the composite cements where a slight decrease in portlandite was observed, due to the low portlandite content coming from clinker plus the effect of the low hydration rate in slag cements the same remark in the X-ray (XRD) analysis [38].
The same Figure 8 (a), (b) shows the DTA (Thermal differential analysis) results of hydrated cement paste at different hardening ages. The loss of mass in the relative temperature range can be obtained from the TGA curve. The same behaviour for Figures 8(a), (b) the age of 3 and 28 days an inverse relationship is observed between the decrease in the intensity of peaks (DTA curves) and the content of additions in the reference cement.
Figure 8. (DTA/TG) curves of hydrated cement pastes at different ages; (a) 3 and (b) 28 days (OPC, CSL10%, CSL20%, CSL30%)
It can be observed that with the increase in the percentage of addition in the composite cements, peak intensities on the derivative curves (DTA) are reduced. This implies that the mass losses indicated by the curves (TGA) are connected to these intensities. In the first temperature interval a peak high between 105°C and 450°C [44].
It is corresponding to a significant loss of mass on the TG curves. These two endothermic peaks are formed by the loss of mass which corresponds to the evaporation of water and the decomposition of part of the hydrate (C-S-H). The amount of chemically bound water combined in the C-S-H can be estimated from the weight loss corresponding to the C-S-H [50].
With a high substitution rate of addition, the endothermic peak from 105°C to 450°C becomes more noticeable, which can be due to the contribution of hydration products to the formation of hydrates of cement matrix [51].
The decomposition of portlandite due to mass loss in this range is found to reflect the water lost due to Ca(OH)2 dehydration in the 2nd endothermic peak in the TG curves between 450°C and 550°C [ 38].
The intensity of the peak decreases with increasing addition content. At the age of 3 days, mass losses between 105°C and 450°C correspond to 4.15%, 3.21%, 2.90% and 1.95% for samples containing OPC, CSL10%, CSL20% and CSL30% respectively. For 28 days losses corresponding to 8.51, 6.20, 5.31 and 4.03 for samples containing OPC, CSL10%, CSL20%, CSL30%, respectively.
Mass loss observed in the TG curve Above 600 ◦C Between 600°C and 800°C, the total CaCO3 content is determined by the evaporation of CO2, the intensity of which increases with the additional content [50].
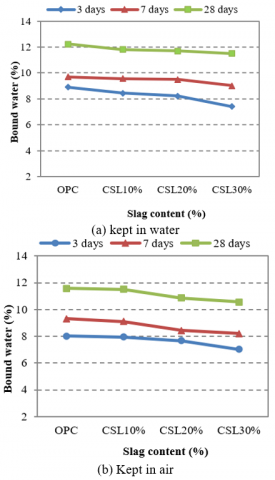
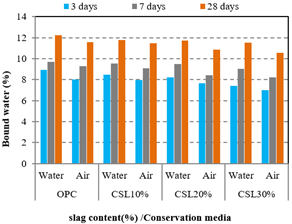
4.7 Influence of slag content on bound water (WB) content of cement
Figure 9. Effect of slag content (%) on bound water (%)
Figure 10. Effect of slag content (%) on bound water (%)
From the Figures 9 (a), (b) and 10, the TGA results analysis was used to calculate the amount of chemically bound water from the loss in mass between 150° and 550°C.
The results show that the amount of chemically bound water decreases with increasing slag content in the cement at the various hydration times of 3, 7 and 28 days of hydration studied.
The peak at 150°C shows the dehydration of C-S-H and ettringite. With the increase in the rate of replacement of cement by slag, it can be seen that the reduction in the amount of portlandite is caused mainly by the dilution effect of the cement whose main mineral phases form C-S-H and portlandite during hydration [52].
The amount of chemically bound water in cements increases as a function of time following the development of the hydration process, and for both conservation media.
For a water-conserved OPC control cement, the increase in bound water is 8.82%, 9.7% and 12.24% for the 3, 7 and 28 day periods respectively [53].
However, for a CSL30% cement with water, the increase was 7.41%, 9.04% and 11.52%, while for OPC cement preserved in air, the rate was 8.04%, 9.3% and 11.6% for the 3, 7 and 28 day maturities respectively, and for CSL30% cement preserved in air, the rate was 7.02%, 8.2% and 10.56% for the same maturities.
4.8 Influence of slag content on degree of hydration (α)
Figure 11. Effect of slag content (%) on degree of hydration (α) (%)
Figure 12. Effect of slag content (%) on the degree of hydration (%)
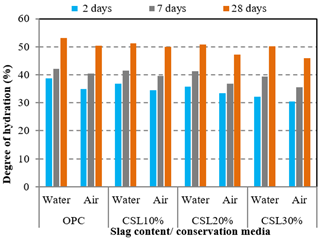
As noticed in Figures 11 (a), (b) and 12 show the variation of hydration degree as a function of slag content (%) in hardened cement pastes stored in water and air at 3, 7 and 28 days. From these results it is clear that the degree of hydration increases with time and decreases with increasing slag content.
For the different deadlines studied the degree of hydration did not reach 100%, which confirms that the complete hydration is only theoretical [9] , although its calculation by this method is only approximate at 28 days, the slag content (CSL30%) in water with a degree of hydration of 50.1% and that of OPC control a rate of 53.22%, whereas for the (CSL30%) stored in air the degree reaches 45%, that of OPC a rate of 50% which is in close correlation with the results obtained in terms of mechanical resistance and the storage environment.
It should be noted that the degree of hydration is more important in water than in air curing specimens. This decrease is probably due to a lack of hydration due to lack of water, the low quantity of water did not allow all the cement grains to react and form hydrates compounds.
4.9 Relationship of non-evaporable water and slag content
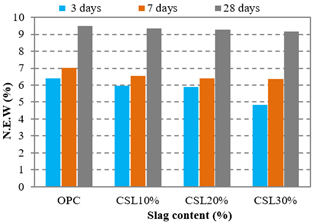
The non-evaporable water of the studied pastes cement defined by thermogravimetric analysis (ATG) is shown in Figure 13.
Figure 13. Effect of slag content (%) on non-evaporable water (%)
Non-evaporating water increases with the age of hydration, the increased slag content of which, due to the low hydraulic activity of the slag used, leads to a decrease in water values and the water content increases with the age of hydration, where the increase in the slag content leads to a decrease in water values due to the low hydraulic activity of the slag used.
In cement (OPC), the volume of non-evaporative water (NEW) is higher than in composite cements. As well as the loss of portlandite due to the pozzolanic composite cement reaction. The phenomenon of delayed hydration due to the high level of secondary addition [38].
4.10 Correlation
4.10.1 Correlation of degree of hydration (α) and compressive strength
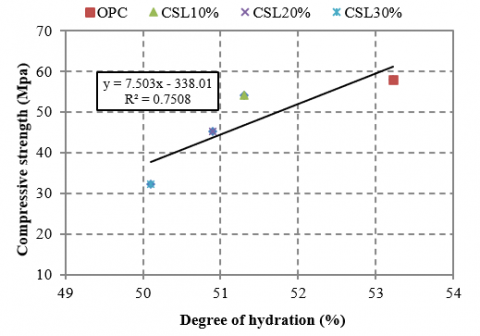
We have plotted the trends for the different parameters studied (Figure 14) which generally shows the decrease in hydration levels with the increase in slag content (%) (R2 = 0.7508) at 28 days. It can be seen that the degree of hydration increases as a function of compressive strength. This finding confirms that the progress of hydration generates an increase in compressive strength due to the increase in the rate of CHS hydrates in the clinker, which densify the cement matrix and consequently increase the compressive strength [54].
Figure 14. Correlation of degree of hydration (%) and Compressive strength (Mpa)
4.10.2 Correlation of degree of hydration (α) and carbonation
Figure 15. Correlation of degree of hydration (%) and carbonation (mm)
The Figure 15 shows the general trend of the increase in the degree of hydration as a function of the depth of carbonation at 28 days, the relation is proportional between the two parameters (R2 = 0.9845), the high hydration rate generates more hydrate in the cement as a result of the increase in compactness which results in a cement resistant to carbonation (CO2 penetration) is more durable [10, 54].
4.10.3 Correlation of compressive strength and carbonation
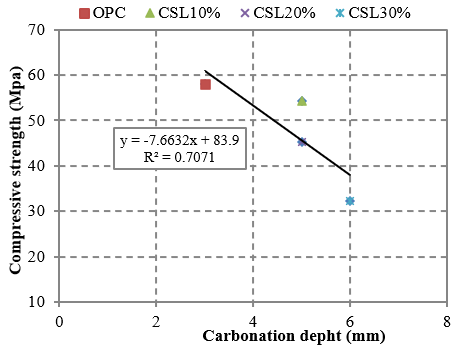
The Figure 16 shows the general trend of decreasing carbonation depth with increasing compressive strength is consistent with the literature [38, 54].
Figure 16. Correlation of compressive strength (Mpa) and carbonation (mm)
4.10.4 Correlation of compressive strength and bound water (WB)
The relationship between compressive strength and bound water is a linear function over time (R2 = 0.557) (Figure 17). The amount of bound water increases with the resistance measured on specimens stored in water.
The amount of bound water is always higher in the case of rehydration. Thus, it is the amount of hydrates and the texturing of the material that determines the strength of the material [19, 54, 55].
Figure 17. Correlation of bound water (%) and compressive strength (Mpa)
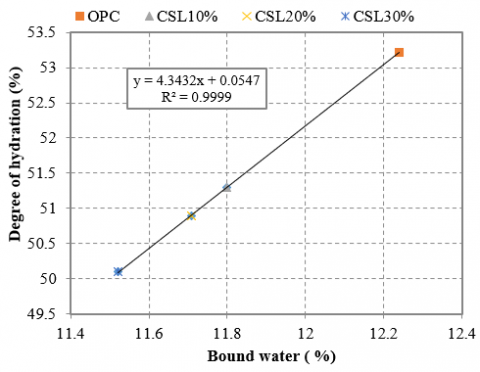
4.10.5 Correlation of degree of hydration (α) and bound water (WB)
The degree of hydration and the bound water (WB) reflect the microstructural characteristics of the system, a very good correlation exists between these two parameters (R2= 0.9999) through the coefficient (Z=0.23) (Figure 18).
The bound water presents the amount of water that reacts to form more hydrate and the degree of hydration presents the percentage of hydration in the cement that is related to the content of the mineralogy of the cement, especially C3A [19, 54].
Figure 18. Correlation of degree of hydration (%) and bound water (%)
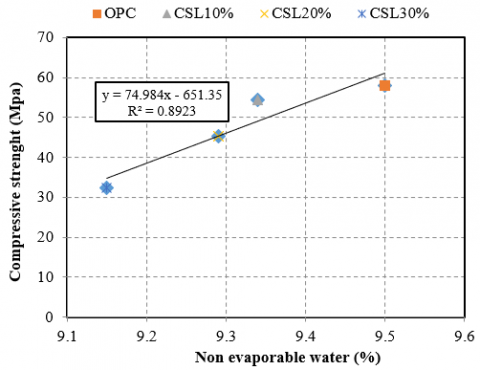
4.10.6 Correlation of non-evaporable water and compressive strength
The curves representing Figure 19 the non-evaporable water show the growth of the resistances observed for all cements (R2=0.8923). This result allowed the validation of the approach developed from Deboucha et al. [10] study and allowed to. It to be observed that with the decrease of the replacement of the addition, the non-evaporative water of the cements increases.
Figure 19. Correlation of non evaporable water (%) and compressive strength (Mpa)
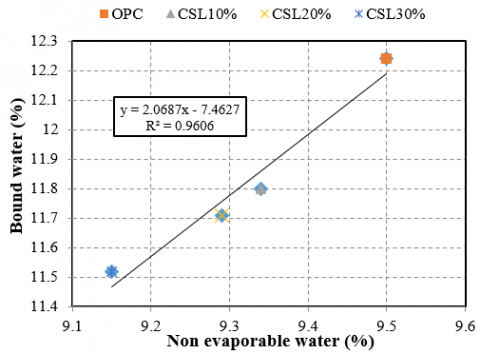
4.10.7 Correlation of Non evaporable water and Bound water
According to Figure 20, the general trend for the two parameters studied a good correlation between non-evaporated water and bound water (WB).
Non-evaporable water and bound water increase with the age of hydration, with the increase in slag content leading to a decrease in water values due to the low hydraulic activity of the slag used. The amount of non-evaporable water (NEW and WB) in cement (OPC) is higher than in composite cements.
Figure 20. Correlation of non evaporable water (%) and Bound water (%)
The objective of this work was to relate the evolution of the microstructural properties of the cements studied, such as the heat of hydration, chemically bound water and the degree of hydration, to the physical-mechanical properties.
Thermogravimetric analyses (TGA/DTA) on thecement paste were carried out at the laboratory of Physics and Chemistry of Materials, University of M'sila, Algeria. The authors would like to express his sincere appreciation for the assistance provided by the laboratory.
|
DTA |
TG Thermo differential, Thermo gravimetric analysis |
|
Ldh |
Loss of weight between (150- 450)℃ |
|
Ldx |
Loss of weight between (450- 550)℃ |
|
Ldc |
Loss of weight between (600- 1000)℃ |
|
W/B |
Water/Binder |
|
B/S |
Binder/Sand |
|
Greek symbols |
|
|
α (t) |
hydration degrees (%) |
|
WB |
Bound water (%) |
|
WB∞ |
constant this value can vary between 0.23 and 0.25 |
[1] Okyay, M. (2016). Cement and Concrete Mineral Admixtures. CRC Press.
[2] Meziani, M., Chelouah, N., Amiri, O., Leklou, N. (2018). Blended cement hydration assessment by thermogravimetric analysis and isothermal calorimetry. In MATEC Web of Conferences, 149: 01062. https://doi.org/10.1051/matecconf/201814901062
[3] Pane, I., Hansen, W. (2005). Investigation of blended cement hydration by isothermal calorimetry and thermal analysis. Cement and Concrete Research, 35(6): 1155-1164. https://doi:10.1016/j.cemconres.2004.10.027
[4] Mouret, M., Bascoul, A., Escadeillas, G. (1997). Study of the degree of hydration of concrete by means of image analysis and chemically bound water. Advanced Cement Based Materials, 6(3-4): 109-115. https://doi.org/10.1016/S1065-7355 (97)90017-1
[5] Morandeau, M. (2013). Atmospheric carbonation of low portlandite content cementitious materials. Dissertation, Doctoral School, University of Paris-Est.
[6] Ameur E.H. (2009). Towards a prediction of gas permeability from the composition of cementitious materials. Dissertation, University of La Rochelle.
[7] Mounanga, P. (2003). Experimental study of the behaviour of cement pastes at a very young age: Hydration, shrinkage, thermo-physical properties. Dissertation, University of Nantes.
[8] Bhatty, J.I. (1986). Hydration versus strength in a portland cement developed from domestic mineral wastes-A comparative study. Thermochimica Acta, 106: 93-103. https://doi.org/10.1016/0040-60(31(86)85120-6
[9] Monteagudo, S.M., Moragues, A., Gálvez, J.C., Casati, M.J., Reyes, E. (2014). The degree of hydration assessment of blended cement pastes by differential thermal and thermogravimetric analysis. Morphological evolution of the solid phases. Thermochimica Acta, 592: 37-51. https://doi.org/10.1016/j.tca.2014.08.008
[10] Deboucha, W., Leklou, N., Khelidj, A., Oudjit, M.N. (2017). Hydration development of mineral additives blended cement using thermogravimetric analysis (TGA): Methodology of calculating the degree of hydration. Construction and Building Materials, 146: 687-701. http://dx.doi.org/10.1016/j.conbuildmat.2017.04.132
[11] Mong, J. (2007). Cracking of mortars in thin layers Effects of hydration, drying and carbonation. Dissertation, the Cachan Normal School.
[12] Rivera Lozano, J. (2004). La hidratación de la pasta de cemento con adiciones activas. PhD, Universidad Autónoma de Madrid.
[13] Esteves, L.P. (2011). On the hydration of water-entrained cement–silica systems: Combined SEM, XRD and thermal analysis in cement pastes. Thermochimica Acta, 518(1-2): 27-35. https://doi.org/10.1016/j.tca.2011.02.003
[14] Shaikh, F.U.A., Supit, S.W.M., Sarker, P.K. (2014). A study on the effect of nano silica on compressive strength of high volume fly ash mortars and concretes. Materials & Design, 60: 433-442. https://doi.org/10.1016/j.matdes.2014.04.025
[15] Hou, P.K., Kawashima, S., Wang, K.J., Corr, D.J., Qian, J.S., Shah, S.P. (2013). Effects of colloidal nanosilica on rheological and mechanical properties of fly ash-cement mortar. Cement and Concrete Composites, 35(1): 12-22. https://doi.org/10.1016/j.cemconcomp.2012.06.013
[16] Briffaut, M. (2010). Study of early cracking of massive concrete structures: influence of cooling rate. Concrete and reinforcement recovery. Ph.D, Dissertation, ENS Cachan, French.
[17] Younci, A. (2011). Carbonation of concretes with high substitution rates of cement by mineral additions. Ph.D, Dissertation, Civil Engineering, Rochelle, Ill, French.
[18] Bougara, A., Lynsdale, C., Milestone, N.B. (2018). The influence of slag properties, mix parameters and curing temperature on hydration and strength development of slag/cement blends. Construction and Building Materials, 187: 339-347. https://doi.org/10.1016/j.conbuildmat.2018.07.166
[19] Escalante, J.I., Gomez, L.Y., Johal, K.K., Mendoza, G., Mancha, H., Mendez, J. (2001). Reactivity of blast-furnace slag in Portland cement blends hydrated under different conditions. Cement and Concrete Research, 31(10): 1403-1409. https://doi.org/10.1016/S0008-8846(01)00587-7
[20] Whittaker, M., Zajac, M., Haha, M.B., Bullerjahn, F., Black, L. (2014). The role of the alumina content of slag, plus the presence of additional sulfate on the hydration and microstructure of Portland cement-slag blends. Cement and Concrete Research, 66: 91-101. https://doi.org/10.1016/j.cemconres.2014.07.018
[21] Loukili, A., Khelidj, A., Richard, P. (1999). Hydration kinetics, change of relative humidity, and autogenous shrinkage of ultra-high-strength concrete. Cement and Concrete Research, 29(4): 577-584. https://doi.org/10.1016/S0008-8846(99)00022-8
[22] Neville, A.M. (1995). Properties of concrete. London: Longman.
[23] Technical data sheet. (2013). GROUPE GICA industry group cements algeria. Centre for Study and Technology services industry building materials.
[24] Bogue, R.H. (1955). The chemistry of Portland cement. 79(4): 322.
[25] NF EN 197-1. (2001). French standard composition, specifications and compliance criteria for common cements.
[26] NF EN 196-6. (1990). Standard French .test method for cements, determination of fineness.
[27] NF EN 196-1. (2009). European standard (French Association of Standardization). ISO Standard Sand. According to ISO 679.
[28] NF. P18-404. (1981). French standard. Concretes-Design. Suitability and control tests-Manufacture and Conservation of test specimens.
[29] NF. EN196-1. (2006). Methods of testing cement – part 1: determination of strength.
[30] NF. P 15-436. (1988). Binders. measurement of the heat of hydration of cements by semi–Adiabatic calorimetry known as the LANGAVANT calorimeter method.
[31] Lo, Y., Lee, H.M. (2002). Curing effects on carbonation of concrete using a phenolphthalein indicator and Fourier-transform infrared spectroscopy. Building and environment, 37(5): 507-514. https://doi.org/10.1016/S0360- 1323(01)00052-X
[32] Strydom, C.A., Potgieter, J.H. (1997). An investigation into the chemical nature of the reactivity of lime. Proc. 10th Int. Congr. Chem. Cement, Ed. H. Justnes, Sweden.
[33] Behim, M. (2005). Industrial by-products and sustainable development: Reactivity. role and durability of el hadjar slag in cementitious matrix materials. Dissertation, University of Annaba.
[34] Chen, H., Feng, P., Ye, S., Sun, W. (2018). The coupling effect of calcium concentration and pH on early hydration of cement. Construction and Building Materials, 185: 391-401. https://doi.org/10.1016/j.conbuildmat.2018.07.067
[35] Merzouki, T., Bouasker, M., Khalifa, N.E.H., Mounanga, P. (2013). Contribution to the modeling of hydration and chemical shrinkage of slag-blended cement at early age. Construction and Building Materials, 44: 368-380. https://doi.org/10.1016/j.conbuildmat.2013.02.022
[36] Beushausen, H., Alexander, M., Ballim, Y. (2012). Early-age properties, strength development and heat of hydration of concrete containing various South African slags at different replacement ratios. Construction and Building Materials, 29: 533-540. https://doi.org/10.1016/j.conbuildmat.2011.06.018
[37] Boualleg, S., Bencheikh, M., Belagraa, L., Daoudi, A., Chikouche, M.A. (2017). The combined effect of the initial cure and the type of cement on the natural carbonation, the portlandite content, and nonevaporable water in blended cement. Advances in Materials Science and Engineering. https://doi.org/10.1155/2017/5634713.
[38] Husson, S. (1991). Physico-chemical and mechanical study of cement filler interactions Application to mortars. Ph.D, Dissertation, Saint-Etienne University.
[39] Baron, J., Gagne, R., Ollivier, J.P. (1996). Striving for durability in the Concrete, Bases and data for their formulation. Collection ATHIL. Eyrolles Edition, 307-363.
[40] Patel, R.G., Killoh, D.C., Parrott, L.J., Gutteridge, W.A. (1988). Influence of curing at different relative humidities upon compound reactions and porosity in Portland cement paste. Materials and Structures, 21(3): 192-197. https://doi.org/10.1007/BF02473055
[41] Prince, W., Edwards-Lajnef, M., Aı̈tcin, P.C. (2002). Interaction between ettringite and a polynaphthalene sulfonate superplasticizer in a cementitious paste. Cement and Concrete Research, 32(1): 79-85. https://doi.org/10.1016/S0008-8846(01)00632-9
[42] Sickert, G. (1997). Extended modelling for the advance of carbonation in concrete. Betonwerk und Fertigteil-Technik, 63(12): 74-88.
[43] Liu, M., Hong, S., Wang, Y., Zhang, J., Hou, D., Dong, B. (2021). Compositions and microstructures of hardened cement paste with carbonation curing and further water curing. Construction and Building Materials, 267: 121724. https://doi.org/10.1016/j.conbuildmat.2020.121724
[44] Atiş, C.D. (2003). Accelerated carbonation and testing of concrete made with fly ash. Construction and Building Materials, 17(3): 147-152. https://doi.org/10.1016/S0950-0618 (02)00116-2
[45] De Ceukelaire, L., Van Nieuwenburg, D. (1993). Accelerated carbonation of a blast-furnace cement concrete. Cement and Concrete Research, 23(2): 442-452. https://doi.org/10.1016/0008-8846(93)90109-M
[46] Fang, Y., Chang, J. (2015). Microstructure changes of waste hydrated cement paste induced by accelerated carbonation. Construction and Building Materials, 76: 360-365. http://dx.doi.org/10.1016/j.conbuildmat.2014.12.017
[47] Papadakis, VG., Vayenas, C.G., Fardis, M.N. (1989). A reaction engineering approach to the problem of concrete carbonation. Aich. Jour., 35: 1639-1650. https://doi.org/10.1002/aic.690351008
[48] Bogas, J.A., Carriço, A., Tenza-Abril, A.J. (2020). Microstructure of thermoactivated recycled cement pastes. Cement and Concrete Research, 138: 106226. https://doi.org/10.1016/j.cemconres.2020.106226
[49] Bahafid, S., Ghabezloo, S., Duc, M., Faure, P., Sulem, J. (2017). Effect of the hydration temperature on the microstructure of Class G cement: CSH composition and density. Cement and Concrete Research, 95: 270-281. http://dx.doi.org/10.1016/j.cemconres.2017.02.008
[50] Chidiac, S.E., Panesar, D.K. (2008). Evolution of mechanical properties of concrete containing ground granulated blast furnace slag and effects on the scaling resistance test at 28 days. Cement and Concrete Composites, 30(2): 63-71. https://doi.org/10.1016/j.cemconcomp.2007.09.003
[51] Krolo, P.E.T.A.R., Krstulovic, R., Dabic, P., Bubic, A. (2005). Hydration and leaching of the cement-zeolite composite. Ceramics- Silikaty, 49(3): 213-219. https://doi.org/10.1016/j.ceramint.2004.11.010
[52] Kourounis, S., Tsivilis, S., Tsakiridis, P.E., Papadimitriou, G.D., Tsibouki, Z. (2007). Properties and hydration of blended cements with steelmaking slag. Cement and Concrete Research, 37(6): 815-822. https://doi.org/10.1016/j.cemconres.2007.03.008
[53] Bresson, B. (2006). Influence of mineralogy on the behavior of cement mortars at a young age. Ph.D, Dissertation, Faculty of Science and Engineering, Laval University, Quebec.
[54] Smolczyk, H.G. (1976). Physical and chemical phenomena of carbonation. In RILEM symposium on Carbonation of Concrete.