Zimao Peng
© 2021 IIETA. This article is published by IIETA and is licensed under the CC BY 4.0 license (http://creativecommons.org/licenses/by/4.0/).
OPEN ACCESS
Green high-performance fiber-reinforced cement (GHPFRC) matrix composite is prepared by mixing matrix composites like slurry, mortar, or concrete with reinforcing materials like metal or inorganic nonmetal fiber, synthetic fiber, or natural organic fiber by a certain method. This composite is more energy-efficient, ductile, low-carbon, economic, and environmentally friendly than ordinary concrete. However, the performance of GHPFRC matrix composite has not been fully studied. The existing research only deals with the seismic performance and fire resistance of the material, failing to systematically discuss the optimal mix ratio. To solve the problem, this paper presents an optimization strategy for multielement GHPFRC matrix composite, and carries out multiple tests on its basic mechanical performance, toughness, impact resistance, shrinkage cracking, dry shrinkage performance, and durability. The test data on various indices verify the superior performance of the prepared multielement GHPFRC matrix composite. Further, the optimal mix ratio of the material was determined as: 60% cement, 30% fly ash, and 10% silica ash, with the water-cement ratio of 0.4, water reducer dosage of 1.5%, and quartz sand dosage of 500g.
green high-performance fiber-reinforced cement (GHPFRC), mix ratio optimization, performance analysis, test
Cement concrete is a widely used building material, thanks to its low production and curing cost, and strong pressure resistance. However, the material faces some intrinsic defects, such as a high susceptibility to cracking, and a small tensile-compressive strength ratio. Composite material and fiber addition are necessary means to help cement concrete overcome problems in dry shrinkage, durability, and brittleness [1-4]. In recent years, a new material called green high-performance fiber-reinforced cement (GHPFRC) matrix composite has emerged, which is prepared by mixing matrix composites like slurry, mortar, or concrete with reinforcing materials like metal or inorganic nonmetal fiber, synthetic fiber, or natural organic fiber by a certain method. This material enjoys much better performance than any of its component [5, 6].
GHPFRC matrix composite can be used as a bridge connecting board to facilitate the maintenance and repair problem of the expansion joints for corrosive beams, slabs, and rebars of bridges. It can also serve as the airstrips and parking aprons that are repeatedly under static/dynamic load and hot/humid load, as well as shear walls that absorb seismic energy [7-9]. With the maturity of production technologies and processes, there is a declining trend in the price of green high-performance fibers. Therefore, the widespread use of GHPFRC matrix composite is foreseeable in new projects.
GHPFRC matrix composite is more energy-efficient, ductile, low-carbon, economic, and environmentally friendly than ordinary concrete [10-13]. With the aid of finite-element software, Environment et al. [14] numerically simulated cement matrix members, which are unfired, fired in single cavity, fired in two cavities, and damaged in fire, respectively, and explored how the seismic performance of cement matrix frame is affected by parameters like axial compression ratio, integral point, rebar yield strength, reinforcement thickness, and replacement dimensions. Combined with an actual case, Mutisya et al. [15] demonstrated that GHPFRC matrix composite members/structures have better carrying capacity, energy efficiency, and seismic performance than ordinary concrete frames, and their seismic performance improves with the increase in rebar yield strength and decrease in axial compression ratio. Nguyen et al. [16] conducted fire resistance tests on the fire endurance and ignition methods of the beams and columns in GHPFRC matrix composite members or structures, established a finite-element constitutive model under thermal coupling, and performed verification tests with changing temperature field and beam end displacement. To improve the fire safety of components and structures in engineering applications, Pisello et al. [17] explored the bonding performance between green cement matrix composite and rebars after high temperature, analyzed the influence laws of five factors of mix ratio that affect material performance, namely, water-cement ratio, sand-cement ratio, fiber dosage, fly ash replacement rate, and water reducer dosage, and ranked these factors in descending order of performance influence by Minitab; Finally, the bond slip curve of the material was given, the bond slip features were analyzed, and the bond failure mechanism was discussed.
Similar to seismic performance and fire resistance, the dynamic mechanical properties are an important indicator of the macro performance of green cement matrix composite structures [18-22]. Tran et al. [23] investigated the dynamic mechanical properties of two typical green composites, i.e., cement matrix regeneration composite and alkaline-activated material, studied how the graphene oxide content enhances the macro dynamic mechanical properties of cement matrix regeneration composite, analyzed the influence of different renewable rubber replacement ratios on the fluidity and static mechanical properties of alkaline-activated material, and evaluated the ecological and economic performance of the materials through mix ratio optimization. Seto et al. [24] carried out monofilament pulling test and breakage test on high ductility cement matrix composite, which is more than 200 times as ductile as ordinary concrete, acquired the friction and elastic modulus of different matrices, and computed the residual energy index of the bridging between fiber and matrix, which characterizes the material’s strain hardening potential; in the end, the rheological properties of the matrix slurry and the dispersion properties of the fibers were tested and analyzed with a rotary viscometer.
Currently, basalt fiber boasts good application prospects in reinforcing cement matrix structures, owing to its excellent high-temperature performance, corrosion resistance, and tensile strength [25-27]. Following the design philosophy of strong nodes and weak members, Fantous and Yahia [28] tested the node refractory performance and component seismic resistance of cement matrix frames reinforced by basalt fiber, and concluded that the pouring material and stirrup ratio of the core area of frame nodes are not key influencing factors of the deformation and stiffness degradation in plastic hinge area.
The existing studies have not thoroughly explored multielement cement matrix composite, nor systematically discussed the optimization of mix ratio. Thus, this paper carries out the following research: Section 2 introduces the mix ratio optimization strategy for the prepared multielement GHPFRC matrix composite, and details the calculation methods for dispersion coefficients, dispersion spacing, bending toughness, breakage energy consumption, impact resistance, crack resistance, and crack index; Section 3 analyzes the test results on basic mechanical performance, toughness, impact resistance, shrinkage cracking, dry shrinkage performance, and durability. Based on various test indices, the authors verified the superiority of the prepared cement matrix composite, and identified the optimal mix ratio of the material.
2.1 Calculation of dispersion coefficients and dispersion spacing
The multielement GHPFRC matrix composite sample was cut into 60mm×60mm small blocks. Each small block was meshed into 25 grids of the size 5×5. Then, the dispersion effect can be characterized by the difference between grids in the number of fibers. Let Ni be the number of fibers in each grid, and N΄ be the mean number of fibers in all grids. Then, the variation coefficient of the multielement GHPFRC matrix composite can be expressed as:
$\lambda =\frac{D}{{{N}'}}$ (1)
where, D is the standard deviation of 25 fibers:
$D=\sqrt{\frac{\sum\nolimits_{i=1}^{25}{{{\left( {{N}_{i}},{N}' \right)}^{2}}}}{24}}$ (2)
Then, the fiber dispersion of multielement GHPFRC matrix composite can be expressed as:
$\eta ={{e}^{-\lambda }}$ (3)
Formula (3) shows, η=1 when λ value approximates zero. In this case, the fibers are dispersed uniformly in different grids. Table 1 presents the fiber dispersion parameters of the multielement GHPFRC matrix composite at different fiber dosages.
Table 1. Fiber dispersion parameters of the multielement GHPFRC matrix composite
|
Test number |
N΄ |
λ |
η |
|
1 |
62 |
0.219 |
0.832 |
|
2 |
69 |
0.206 |
0.846 |
|
3 |
61 |
0.281 |
0.741 |
|
4 |
59 |
0.272 |
0.785 |
|
5 |
67 |
0.196 |
0.864 |
|
6 |
56 |
0.242 |
0.817 |
|
7 |
55 |
0.274 |
0.827 |
|
8 |
63 |
0.214 |
0.839 |
|
9 |
66 |
0.189 |
0.876 |
|
10 |
57 |
0.163 |
0.881 |
As shown in Table 1, the GHPFRC matrix composite block 10# achieved the best dispersion coefficients among all blocks in the fiber dispersion tests. The harmless cracks, which are shorter than the center distance of the fibers, in the cement matrix will not further expand into harmful cracks, due to the crack resistance of the fibers. Let d, ε, and rV be the diameter, directional effective coefficient, and volume ratio of fibers, respectively. Then, the cross-sectional area of each test block can be calculated by:
$A=0.886d\sqrt{\varepsilon \cdot {{r}_{V}}}$ (4)
where, rV can be calculated by:
${{V}_{f}}=\frac{\frac{{{m}_{coir}}}{{{\rho }_{coir}}}}{\frac{{{m}_{cement}}}{{{\rho }_{cement}}}+\frac{{{m}_{sf}}}{{{\rho }_{sf}}}+\frac{{{m}_{fa}}}{{{\rho }_{fa}}}+\frac{{{m}_{water}}}{{{\rho }_{water}}}+\frac{{{m}_{coir}}}{{{\rho }_{coir}}}+\frac{{{m}_{sand}}}{{{\rho }_{sand}}}+\frac{{{m}_{wr}}}{{{\rho }_{wr}}}}$ (5)
where, mc, mfa, mw, ms, mq, mgf, and mwr are the masses of the components; ρc, ρfa, ρw, ρs, ρq, ρgf, and ρwr are the densities of the components. Table 2 provides the physical densities of the multielement GHPFRC matrix composite blocks.
Table 2. Physical densities of test blocks
|
Density |
ρc |
ρfa |
ρw |
ρs |
ρq |
ρgf |
ρwr |
|
Value |
3.25 |
2.37 |
1 |
2.06 |
2.33 |
1.46 |
1.12 |
Suppose the fibers obey chessboard distribution in cement matrix. Then, the center distance of the fibers, i.e., the dispersion spacing of fibers, can be calculated by:
$d=\sqrt{\frac{A}{{{N}_{A}}}}$ (6)
where, NA is the number of fibers on A. Table 3 records the test results on fiber dispersion spacing.
Table 3. Fiber dispersion spacing of test blocks
|
Test number |
rV |
Calculated value |
Test value |
|
1 |
0.892 |
1.311 |
1.124 |
|
2 |
0.921 |
1.270 |
1.337 |
|
3 |
0.875 |
1.323 |
1.315 |
|
4 |
0.865 |
1.363 |
1.512 |
|
5 |
0.915 |
1.279 |
1.425 |
|
6 |
0.922 |
1.271 |
1.464 |
|
7 |
0.879 |
1.348 |
1.548 |
|
8 |
0.896 |
1.303 |
1.514 |
|
9 |
0.857 |
1.376 |
1.383 |
|
10 |
0.907 |
1.290 |
1.397 |
As shown in Table 3, adding quartz sand and water reducer can promote the dispersion of natural organic plant fibers in the cement matrix (blocks 1-3 and 9-10). The fiber dispersion spacing was the closest to the ideal value in cement matrix blocks 3 and 9, which contain fly ash and silica ash. Hence, the mix ratios of blocks 3 and 9 give full play to the crack resistance of the fibers.
2.2 Quantification of bending toughness
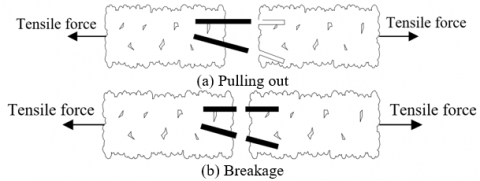
When the composite cracks under pulling or bending, the crack propagation in the matrix is slowed down, as the deformable fibers carry a part of the tensile force. As the cracks gradually widen, the residual stress of the matrix continues to decrease, while the tensile force borne by the fibers tends to increase. Eventually, the fibers are broken or pulled out (Figure 1). The toughening effect of the fibers is manifested in the delay of crack propagation.
Figure 1. Tensile damage of fibers in the composite
Considering the influence of the type and volume ratio of natural organic plant fibers on the composite toughness, the length of the test block was denoted as δ, deflection δ/150 as KSu, the area under the load-deflection curve with deflection in [0, δ/150] as Su, the width of the cracked cross-section as w, and the height of the cracked cross-section as h. Then, the bending toughness of the prepared multielement GHPFRC matrix composite can be characterized by the bending toughness coefficient:
$\gamma =\frac{{{S}_{u}}\delta }{1000h{{w}^{2}}{{K}_{{{S}_{u}}}}}$ (7)
Ignoring the accuracy of the initial crack-induced deflection, the loads corresponding to deflections 0.6, 0.9, 1.2, and 1.5mm were denoted as L0.6, L09, L1.2, and L1.5, respectively. Then, the bending toughness of the composite under secondary loading can be characterized by residual strength:
$RS=\frac{1}{h{{w}^{2}}}\left[ \frac{{{L}_{0.6}}+{{L}_{0.9}}+{{L}_{1.2}}+{{L}_{1.5}}}{4} \right]$ (8)
2.3 Calculation of breakage energy consumption
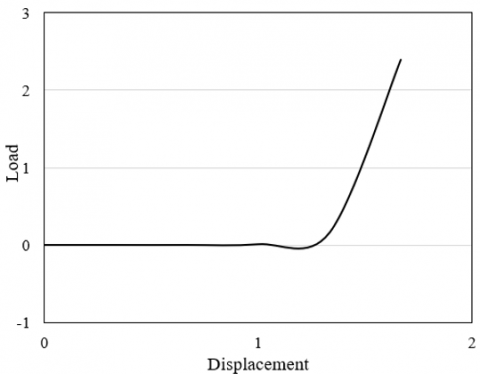
Figure 2 gives the displacement-load curve of the cement matrix with no fibrous tissue. It can be seen that the load of pure cement matrix quickly dropped to zero at the moment of cracking. If cracking takes place in multielement GHPFRC matrix composite, the bridging effect of fibers could quickly reduce the load, such that the matrix will not be broken or will be broken after a much longer time.
Figure 2. Displacement-load curve of pure cement matrix
Let K0 and Q0 be the deflection and energy of the block at the moment of cracking, respectively; M be the mass of the block. Then, the toughness of cement matrix can be expressed by the breakage energy consumption:
${{Q}_{Fra}}=\frac{\int_{0}^{{{K}_{0}}}{q\left( K \right)d\left( K \right)+9.8M{{K}_{0}}}}{A}=\frac{{{Q}_{0}}+9.8M{{K}_{0}}}{wh}$ (9)
Table 4. Breakage energy consumptions of composites
|
Test number |
K0 |
M |
w |
h |
Q0 |
Calculated value |
Test value |
|
1 |
0.51 |
784.31 |
60 |
60 |
419.64 |
157.31 |
152.44 |
|
2 |
0.62 |
769.14 |
60 |
60 |
452.97 |
129.67 |
120.85 |
|
3 |
0.69 |
718.47 |
60 |
60 |
439.02 |
147.89 |
141.76 |
|
4 |
0.58 |
756.84 |
60 |
60 |
452.16 |
152.93 |
160.01 |
|
5 |
0.64 |
772.91 |
60 |
60 |
475.91 |
143.90 |
148.67 |
Table 4 lists the parameters of the energy consumed during composite breakage. It is intuitive that the composites with different mix ratios differed in toughness.
2.4 Calculation of impact resistance, crack resistance, and crack index
Currently, there is no unified test method for impact resistance of cement matrix. This paper applies load quickly on cake blocks by weight dropping. The impact tests were carried out cyclically, and the number of impacts NS leading to the first crack was recorded. Let mL and H be the mass and fallen height of the load, respectively. Then, the anti-impact toughness of the composite can be calculated by:
${{T}_{S}}=9.8{{N}_{S}}{{m}_{L}}H$ (10)
The cracking of cement matrix mainly comes from the fact that the tensile stress surpasses the tensile strength of the matrix, or the tensile strain exceeds the ultimate tensile strength of the matrix. The possible causes of cracking include the dry shrinkage of cement matrix, changes in ambient temperature difference, and uneven load. The primary evaluation indices are ultimate tensile strength, crack resistance, and crack index. Let αST, αSH, TS, and ETM be the ultimate tensile strength, dry shrinkage, axial tensile strength, and tensile elastic modulus of the cement matrix composite cured for n days, respectively. Then, the crack index can be calculated by:
$\tau =\frac{{{\alpha }_{ST}}\cdot TS}{{{\alpha }_{SH}}\cdot {{E}_{TM}}}$ (11)
It can be seen that the cement matrix with large ξp and Rf, and small Ef and ξd has relatively good crack resistance. That is, the fiber-reinforced cement concrete with good crack resistance must have large ultimate tensile strength and axial tensile strength, and small dry shrinkage and elastic modulus. Table 5 presents the crack resistance test results on the composite cured for 30d.
Table 5. Crack resistance of the 30d composite
|
Test number |
Fiber dosage per unit volume |
αST |
αSH |
TS |
ETM |
τ |
|
1 |
0 |
144.52 |
247 |
4.11 |
3.41 |
67.5 |
|
2 |
1 |
168.45 |
216 |
4.34 |
3.05 |
98.5 |
|
3 |
3 |
181.20 |
198 |
4.65 |
2.56 |
112.6 |
|
4 |
6 |
198.70 |
182 |
4.94 |
2.11 |
132.0 |
As shown in Table 5, the addition of 1, 3, 6kg/m3 plant fibers increased the crack index by 45.9%, 66.8% and 95.5%, respectively, compared with the pure cement matrix. The higher the dosage, the larger the crack index, and the better the crack resistance of the matrix.
Further, the multielement GHPFRC matrix composite was subject to shrinkage cracking test without curing. To speed up surface evaporation, an 8m/s wind was applied on the block surface for 24h, and the width bi and length li of each surface crack were recorded. The weight of the crack width ωi was also defined. Then, the crack index, which reflects the cracking degree and crack resistance of multielement GHPFRC matrix composite, can be calculated by:
$C=\sum{({{b}_{i}}\times {{l}_{i}})}$ (12)
3.1 Basic mechanical properties
Figure 3 shows the test results on compressive and bending strengths of multielement GHPFRC matrix composite with different dosages of natural organic plant fibers and binding materials.
Figure 3. Test results on basic mechanical properties
Figure 3(a) compares the 5d and 30d compressive strengths between 10 samples with different mix ratios and 1 pure sample. It can be seen that the addition of natural organic plant fibers and binding materials slightly reduced the compressive strength of pure cement matrix. Excessive amounts of fly ash and silica ash would weaken the hydration and rheology of the composite, which in turn affect the fiber dispersion in the matrix. From the perspective of bending resistance and roughness, the mix ratios of the 10 samples are all acceptable.
Figure 3(b) compares the 5d and 30d bending strengths between 10 samples with different mix ratios and 1 pure sample. The results show that the addition of natural organic plant fibers and binding materials improved the bending strength of pure cement matrix. The binding materials could increase the dispersion of natural organic plant fibers. Thus, making the fibers an important element can effectively enhance the bending strength of cement matrix.
Table 6. Test results on mechanical properties of the composite
|
Test number |
Fiber dosage per unit volume |
Fiber length |
Tensile strength |
Bending strength |
||
|
5d |
30d |
5d |
30d |
|||
|
1 |
0 |
/ |
3.65 |
4.17 |
3.09 |
4.03 |
|
2 |
1 |
12±2 |
3.69 |
4.71 |
3.12 |
4.11 |
|
3 |
3 |
12±2 |
3.81 |
4.88 |
3.28 |
4.24 |
|
4 |
6 |
12±2 |
3.68 |
4.76 |
3.17 |
4.15 |
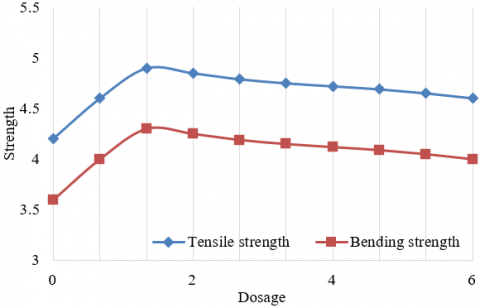
Figure 4. Mechanical strength curves
The composites with different mix ratios were also subject to splitting and bending tests. The results in Table 6 indicate that the pure cement matrix, which contains no admixture, had low splitting strength and bending strength. After being added 1, 3, or 6kg/m3 of natural organic plant fibers, the splitting and bending strengths of 5d composites did not change much, but those of 30d composites increased significantly, as compared with the pure cement matrix.
Figure 4 presents the mechanical strength curves of the test samples cured for 30d. The tensile and bending strengths of the composite followed basically the same trends, peaking at the dosage of 1.85kg/m3.
3.2 Toughness
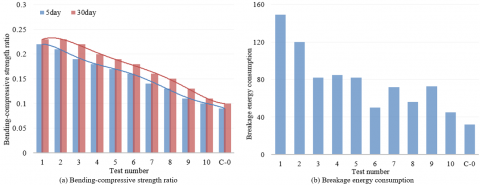
Figure 5 shows the test results on the bending-compressive strength ratios and breakage energy consumptions of multielement GHPFRC matrix composite with different dosages of natural organic plant fibers and binding materials. As shown in Figure 5(a), the composites added with fibers were tougher than pure cement matrix.
Figure 5(b) compares the breakage energy consumptions between composite blocks and pure cement matrix. The toughening effect of natural organic plant fibers on the composite was verified from the angle of energy consumption.
From the test results, the best toughness was observed on the composite prepared from the matrix of 60% cement, 30% fly ash, and 10% silica ash, with the water-cement ratio of 0.4, water reducer dosage of 1.5%, and quartz sand dosage of 500g. This composite achieved good matrix surface adhesion and fiber dispersion effect.
Figure 5. Test results on toughness
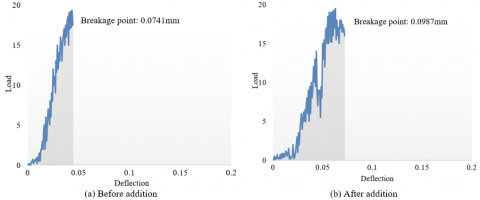
Figure 6. Load-deflection curves of composite before and after fiber addition
The breakage of multielement GHPFRC matrix composite covers two stages: elastic deformation and persistent microcracking. The second stage begins from the appearance of the first micro-crack, and lasts until the breakage of most fibers and pulling out of the rest. Figure 6 presents the load-deflection curves of composite before and after fiber addition. Obviously, the multielement GHPFRC matrix composite absorbed a huge amount of energy as the fibers were broken and pulled out. The declining softening segment in Figure 6(b) testifies the large toughness and deformability of the composite, even if its load capacity was falling.
After the breakage of composite, different types of natural organic plant fibers deform differently. The load-deflection curve of cement matrix mixed with plant fibers cannot be described accurately with a fitting function. In this paper, the deflection at block breakage point is measured by displacement sensors, and the deformations of different blocks are compared by the area under the load-displacement curve between point zero to the breakage point.
Table 7 displays the calculated toughness of composite blocks after bending breakage. With the fiber dosage of 1 and 3kg/m3, the breakage toughness of composite was 17.5% and 44.7% higher than that of pure cement matrix. As the dosage increased to 6kg/m3, the breakage toughness of composite decreased. This is consistent with the test results on compressive and bending strengths.
3.3 Impact resistance
Table 7. Calculated toughness of composite blocks after bending breakage
|
Test number |
Fiber dosage per unit volume |
Fiber length |
Toughness |
|
1 |
0 |
/ |
546.1 |
|
2 |
1 |
12±2 |
662.5 |
|
3 |
3 |
12±2 |
989.4 |
|
4 |
6 |
12±2 |
1014.3 |
Table 8. Calculated impact resistance of composite blocks
|
Test number |
Fiber dosage per unit volume |
Number of impacts per unit time |
Impact energy |
Impact strength |
|
1 |
0 |
22 |
658.3 |
152 |
|
2 |
1 |
24 |
698.2 |
175 |
|
3 |
3 |
28 |
714.5 |
188 |
|
4 |
6 |
31 |
757.4 |
215 |
As shown in Table 8, compared with pure cement matrix, the impact resistance of multielement GHPFRC matrix composite continued to improve with the fiber dosage. As the dosage grew from 1, 3, to 6kg/m3, the number of impacts tolerable by the matrix composite increased by 9%, 27%, and 40%, respectively, and the relative impact strength rose by 15%, 23.6%, and 41.4%, respectively. This is because, when the composite faces continuous impacts, part of the external load is borne by the fibers; lots of impact energy is absorbed by the fibers, which effectively mitigates the damages on the composite.
3.4 Cracking performance
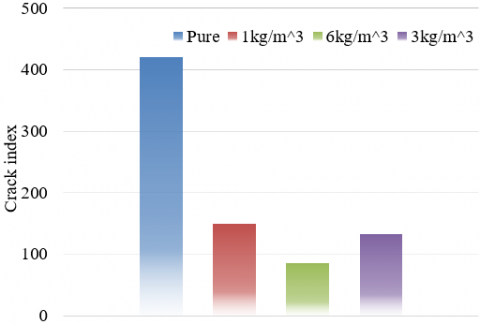
Table 9 shows the results of the cracking test on the multielement GHPFRC matrix composite. Figure 7 provides the crack indices of composite blocks with different fiber dosage per unit volume.
As can be seen from Table 9 and Figure 7, the crack indices of the composites with 1, 3, and 6kg/m3 fibers were 24.7%, 20.1%, and 23.7% that of pure cement matrix, respectively. The crack index gradually decreased with the growth in fiber dosage. The smallest crack index belonged to the composite with the fiber dosage of 6kg/m3. This composite has the strongest early shrinkage ability and crack resistance.
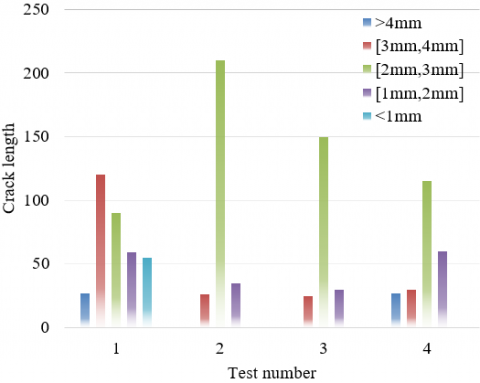
The addition of natural organic plant fibers reduced the early elastic modulus and tensile stress of the composite, and carried more shrinkage stress, making the dry shrinkage cracks fewer and thinner. The cracking situation of different blocks is illustrated in Figure 8. It can be seen that the composites with 1kg/m3 and 3kg/m3 fibers contained no >4mm crack after dry shrinkage; the cracks in the width interval of [3mm, 4mm] and [1mm, 2mm] decreased by 81.5% and 86.3%, respectively; those in [2mm, 3mm] slightly increased, but with apparently smaller width. Meanwhile, the appearance of the first crack was clearly delayed, which further verifies the improved crack resistance of the composite.
Table 9. Results of cracking test
|
Crack width |
Weight |
Fiber dosage |
|||
|
0 |
1 |
3 |
6 |
||
|
>4mm |
2.5 |
37 |
/ |
/ |
/ |
|
[3mm, 4mm] |
1.5 |
134 |
/ |
/ |
/ |
|
[2mm, 3mm] |
0.8 |
103 |
18 |
13 |
9 |
|
[1mm, 2mm] |
0.4 |
68 |
239 |
164 |
121 |
|
<1mm |
0.2 |
62 |
47 |
31 |
25 |
|
Weighted crack index |
/ |
415.5 |
119.4 |
82.2 |
60.6 |
Figure 7. Crack indices of composite blocks with different fiber dosage per unit volume
Figure 8. Cracking situation of different blocks
3.5 Dry shrinkage performance
The samples for dry shrinkage test were prepared by Test Code for Hydraulic Concrete (DL/5150-2001), and relocated to a standard curing room for 24h of molded curing. Then, the initial length of each sample was measured, and taken as the benchmark sample length. To prevent the offset of the metal probe, the probe was fixed with 701 adhesive after the mold was removed.
Immediately after the measurement, each sample was placed in a dry shrinkage room to be dried at the temperature of (20±2)℃ and relative humidity of (60±5)%. The dry shrinkage age was counted from the measurement of the benchmark length. The samples were cured for 1d, 3d, 7d, 14d, 28d, and 60d, respectively, before length measurement. The length at each curing age was measured by the same method for the benchmark length. The results of dry shrinkage test are presented in Figure 9.
Figure 9. Results of dry shrinkage test
As shown in Figure 9, after being cured for 1d in the standard curing room, the dry shrinkage of samples with 1.4kg/m3 and 2.8kg/m3 fibers was 19%-47.6% smaller than that of pure concrete; the sample with 5.6kg/m3 fibers almost did not shrink. After 60d of dry curing, the dry shrinkage of samples with 1.4kg/m3, 2.8kg/m3, and 5.6kg/m3 was 11.5%, 19.3%, and 36.1% smaller than that of pure concrete, respectively, indicating that plant fiber-reinforced concrete has a stronger suppression effect on shrinkage in the early phase than in the late phase.
The fiber-reinforced concretes with different fiber dosages varied in dry shrinkage. The higher the dosage, the smaller the dry shrinkage. Pure concrete shrank significantly in dry curing, due to the water loss of cement. By contrast, the numerous plant fibers, which are evenly distributed in concrete, produce a constraining tensile stress opposite to the shrinkage direction of cement. This stress limits the further shrinkage of cement, and thus reduces the dry shrinkage of fiber-reinforced concrete.
3.6 Durability
For strong alkaline cement matrices, the reinforcing fibers must have strong anti-aging resistance. Our multielement GHPFRC matrix composite adopts natural organic plant fibers, rather than organic synthetic fibers. Thus, it is necessary to probe deep into the corrosion of the plant fibers in alkaline solutions, and the long-term durability of the composite.
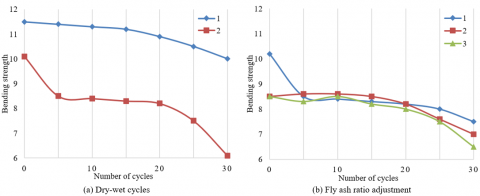
Figure 10(a) presents the bending strength curves of the composite after multiple dry-wet cycles. As shown in Figure 10 (a), the bending strengths of pure cement matrix and the composite after 30d curing stood at 10.14MPa and 11.57MPa, respectively, which dropped to 6.12MPa and 10.11MPa, after 30 dry-wet cycles. Pure cement matrix saw a deeper decline in bending strength than the composite, during the accelerated aging.
Figure 10(b) shows how the adjustment of fly ash ratio affects the bending strength of the composite. It can be seen that increasing the fly ash ratio could speed up the aging of the composite to a certain extent, but bending strength of composites with different fly ash ratios declined by the same trend. Comparatively, it is more effective to enhance the durability of the composite by increasing the fiber dosage.
Figure 10. Bending strength of composite after different treatments
GHPFRC matrix composite is a mixture of matrix composites like slurry, mortar, or concrete with reinforcing materials like metal or inorganic nonmetal fiber, synthetic fiber, or natural organic fiber. Compared with ordinary concrete, GHPFRC matrix composite is energy-efficient, ductile, low-carbon, economic, and environmentally friendly. However, there is not yet any research on the optimal mix ratio of this novel composite.
To make up for the gap, this paper details how to calculate and quantify the dispersion coefficient, dispersion spacing, bending toughness, breakage energy consumption, impact resistance, crack resistance, and crack index of the prepared GHPFRC matrix composite, and performed multiple tests on the its basic mechanical performance, toughness, impact resistance, shrinkage cracking, dry shrinkage performance, and durability of the composite.
The test results verify the excellence of the prepared GHPFRC matrix composite in toughness, compressive and bending strengths, impact resistance, crack resistance, and durability. On this basis, the authors provided the optimal mix ratio of the composite: 60% cement, 30% fly ash, and 10% silica ash, with the water-cement ratio of 0.4, water reducer dosage of 1.5%, and quartz sand dosage of 500g.
This paper was supported by the Research on BIM Technology-Based Traffic Engineering Completion Filing and Digital Archive Management Regulations, the Science and Technology Planning Project of the Department of Transportation of Hunan Province in 2019 (Grant No.: 201936).
[1] Kolawole, J.T., Combrinck, R., Boshoff, W.P. (2020). Rheo-viscoelastic behaviour of fresh cement-based materials: Cement paste, mortar and concrete. Construction and Building Materials, 248: 118667. https://doi.org/10.1016/j.conbuildmat.2020.118667
[2] Nguyen, T.T., Waldmann, D., Bui, T.Q. (2020). Phase field simulation of early-age fracture in cement-based materials. International Journal of Solids and Structures, 191: 157-172. https://doi.org/10.1016/j.ijsolstr.2019.12.003
[3] Honorio, T., Carasek, H., Cascudo, O. (2020). Electrical properties of cement-based materials: Multiscale modeling and quantification of the variability. Construction and Building Materials, 245: 118461. https://doi.org/10.1016/j.conbuildmat.2020.118461
[4] Rao, M., Wei, J., Gao, Z., Zhou, W., Li, Q., Liu, S. (2016). Study on strength and microstructure of cement-based materials containing combination mineral admixtures. Advances in Materials Science and Engineering. https://doi.org/10.1155/2016/7243670
[5] Kong, W., Wei, Y., Wang, S., Chen, J., Wang, Y. (2020). Research progress on cement-based materials by X-ray computed tomography. International Journal of Pavement Research and Technology, 13(4): 366-375. https://doi.org/10.1007/s42947-020-0119-8
[6] Tang, S., Huang, J., Duan, L., Yu, P., Chen, E. (2020). A review on fractal footprint of cement-based materials. Powder Technology, 370: 237-250. https://doi.org/10.1016/j.powtec.2020.05.065
[7] Bertelsen, I.M.G., Ottosen, L.M., Fischer, G. (2020). Influence of fibre characteristics on plastic shrinkage cracking in cement-based materials: A review. Construction and Building Materials, 230: 116769. https://doi.org/10.1016/j.conbuildmat.2019.116769
[8] Honorio, T., Bary, B., Benboudjema, F. (2018). Thermal properties of cement-based materials: Multiscale estimations at early-age. Cement and Concrete Composites, 87: 205-219. https://doi.org/10.1016/j.cemconcomp.2018.01.003
[9] Chartier, D., Sanchez-Canet, J., Bessette, L., Esnouf, S., Renault, J.P. (2018). Influence of formulation parameters of cement based materials towards gas production under gamma irradiation. Journal of Nuclear Materials, 511: 183-190. https://doi.org/10.1016/j.jnucmat.2018.09.024
[10] Ghafari, E., Yuan, Y., Wu, C., Nantung, T., Lu, N. (2018). Evaluation the compressive strength of the cement paste blended with supplementary cementitious materials using a piezoelectric-based sensor. Construction and Building Materials, 171: 504-510. https://doi.org/10.1016/j.conbuildmat.2018.03.165
[11] Bennack, V., Dalla Valentina, L.V.O., Folgueras, M.V. (2017). Analysis of technical suitability of using wood ash in cement based materials. Materials Science Forum, 881: 341-345. https://doi.org/10.4028/www.scientific.net/MSF.881.341
[12] Smyl, D., Hallaji, M., Seppänen, A., Pour-Ghaz, M. (2016). Quantitative electrical imaging of three-dimensional moisture flow in cement-based materials. International Journal of Heat and Mass Transfer, 103: 1348-1358. https://doi.org/10.1016/j.ijheatmasstransfer.2016.08.039
[13] Schmidt, W., Alexander, M., John, V. (2018). Education for sustainable use of cement based materials. Cement and Concrete Research, 114: 103-114. https://doi.org/10.1016/j.cemconres.2017.08.009
[14] Environment, U.N., Scrivener, K.L., John, V.M., Gartner, E.M. (2018). Eco-efficient cements: Potential economically viable solutions for a low-CO2 cement-based materials industry. Cement and Concrete Research, 114: 2-26. https://doi.org/10.1016/j.cemconres.2018.03.015
[15] Mutisya, S.M., de Almeida, J.M., Miranda, C.R. (2017). Molecular simulations of cement based materials: a comparison between first principles and classical force field calculations. Computational Materials Science, 138: 392-402. https://doi.org/10.1016/j.commatsci.2017.07.009
[16] Nguyen, T.T., Waldmann, D., Bui, T.Q. (2019). Computational chemo-thermo-mechanical coupling phase-field model for complex fracture induced by early-age shrinkage and hydration heat in cement-based materials. Computer Methods in Applied Mechanics and Engineering, 348: 1-28. https://doi.org/10.1016/j.cma.2019.01.012
[17] Pisello, A.L., D’Alessandro, A., Sambuco, S., Rallini, M., Ubertini, F., Asdrubali, F., Cotana, F. (2017). Multipurpose experimental characterization of smart nanocomposite cement-based materials for thermal-energy efficiency and strain-sensing capability. Solar Energy Materials and Solar Cells, 161: 77-88. https://doi.org/10.1016/j.solmat.2016.11.030
[18] Mehdipour, I., Libre, N.A. (2017). Linking fiber factor to material performance of fiber-reinforced self-consolidating cement-based materials. ACI Materials Journal, 114(1): 77-91. https://doi.org/10.14359/51689483
[19] Savoye, S., Rajyaguru, A., Macé, N., Lefèvre, S., Spir, G., Robinet, J.C. (2018). How mobile is tritiated water through unsaturated cement-based materials? New insights from two complementary approaches. Applied Radiation and Isotopes, 139: 98-106. https://doi.org/10.1016/j.apradiso.2018.04.019
[20] Bouniol, P., Guillot, W., Dauvois, V., Dridi, W., Le Caër, S. (2018). Original behavior of pore water radiolysis in cement-based materials containing sulfide: Coupling between experiments and simulations. Radiation Physics and Chemistry, 150: 172-181. https://doi.org/10.1016/j.radphyschem.2018.04.021
[21] Hall, C. (2019). Capillary imbibition in cement-based materials with time-dependent permeability. Cement and Concrete Research, 124: 105835. https://doi.org/10.1016/j.cemconres.2019.105835
[22] Guo, M., Xiao, J., Zuo, S. (2019). Multifractal analysis on pore structure of cement-based materials blended with ground limestone and its relationship with permeability. Journal of the Chinese Ceramic Society, 47(5): 617-624.
[23] Tran, B.V., Pham, D.C., Loc, M.D., Le, M.C. (2019). An adaptive approach for the chloride diffusivity of cement-based materials. Computers and Concrete, 23(2): 145-153. https://doi.org/10.12989/cac.2019.23.2.145
[24] Seto, K.E., Churchill, C.J., Panesar, D.K. (2017). Influence of fly ash allocation approaches on the life cycle assessment of cement-based materials. Journal of Cleaner Production, 157: 65-75. https://doi.org/10.1016/j.jclepro.2017.04.093
[25] Flores-Vivian, I., Pradoto, R.G., Moini, M., Kozhukhova, M., Potapov, V., Sobolev, K. (2017). The effect of SiO 2 nanoparticles derived from hydrothermal solutions on the performance of portland cement based materials. Frontiers of Structural and Civil Engineering, 11(4): 436-445. https://doi.org/10.1007/s11709-017-0438-2
[26] Bediako, M., Kevern, J.T., Ankrah, J.S. (2016). Strength and durability of cement-based materials incorporated with low grade kaolinitic calcined clay. Fourth International Conference on Sustainable Construction Materials and Technologies, Las Vegas, USA. https://doi.org/10.18552/2016/SCMT4S121
[27] Grengg, C., Ukrainczyk, N., Koraimann, G., Mueller, B., Dietzel, M., Mittermayr, F. (2020). Long-term in situ performance of geopolymer, calcium aluminate and Portland cement-based materials exposed to microbially induced acid corrosion. Cement and Concrete Research, 131: 106034. https://doi.org/10.1016/j.cemconres.2020.106034
[28] Fantous, T., Yahia, A. (2020). Air-void characteristics in highly flowable cement-based materials. Construction and Building Materials, 235: 117454. https://doi.org/10.1016/j.conbuildmat.2019.117454