Combined Treatment of Coking Wastewater with N-Ce-TiO2 and Modified Inferior Coal Char

Jinghong Zhang | Shuqin Wang | Luyou Liu | Xiao Zhang | Bo Bi | Dong Fu | Zhiyong Li*
OPEN ACCESS
Treatment of coking wastewater simulated by phenol with coconut shell modified Shanxi coal and N-Ce-TiO2.The SEM of modified char showed that the particles were smaller and rougher than Shanxi coal. But the specific surface area larger. The SEM of TiO2 showed that the particles of N-Ce-TiO2 was smaller than others, the particles of Ce-TiO2 between two parties, and the conclusion is the same to the BET.NH3-TPD showed that the N and Ce can made the adsorption performance improved. UV-VIS N and Ce reduced the band gap and made the catalytic performance enhanced of visible light.potency:300mg/L,char:4g/L ,pH=1, the efficiency of modified char is 62.5 %; potency: 20 mg/L, N-Ce-TiO2:4 g/L, pH=2,the efficiency of N-Ce-TiO2 is 69 %.The efficiency of co-processing is better than that of single treatment and the BOD/COD of phenol wastewater about 600mg/L was more than 0.3. The application experiment of simulated wastewater shows that modified char and N-Ce-TiO2 can treat phenol wastewater more efficiently and improve biodegradability, to lay a foundation for subsequent treatment.
N-Ce-TiO2, nanomaterials, coking wastewater, photocatalysis, modified char, biomass
Coking waste water is produced in the process of coal-to-char, coal-gas purification and coking product recovery. There are many kinds of organic matter, mainly in the form of phenol, p-cresol, o-xylene and their homologues [1-2]. Organic pollutants contained in coking waste water seriously inhibit the growth and normal metabolic activities of microorganisms, resulting in the degradation of their biodegradability. Thus, treatment is very difficult, making it often difficult to meet the national emission standards. How to treat coking waste water economically and effectively has always been a hot issue in environmental protection.
It is feasible to treat coking waste water by adsorption and photocatalysis studied by scholars at home and abroad. The adsorption method takes advantage of the developed pores property of the adsorbent to adsorb the pollutants. The activated carbon has good adsorption performance, but its yield is low and cost is high. The utilization of inferior coal char to adsorb pollutants can greatly reduce the treatment cost. The modified TiO2 is characterized by high photocatalytic activity, low cost and no secondary pollution. The use of TiO2 for photocatalysis can effectively degrade organic macromolecules into small molecules and finally oxidize them to water and CO2. Yang Xiaoxia et al. use modified coal char to adsorb benzoic acid. The experimental result shows that there are certain functional groups in the coal char, and the specific surface area increases to 143 m2/g after modification with ammonia water [3]. Karri studies the adsorptive property of coconut shell activated carbon to phenol solution, finding that with the increase of phenol concentration, the adsorption efficiency decreases. The treatment efficiency of 250 mg/L phenol-containing waste water is 64 %, and activated carbon is low in yield and high in cost [4]; S. C. Liu et al. use modified char as adsorbent to treat coking waste water in depth. The experiment result shows that 13 g of modified char for every 200 mL of waste water can reduce the mass concentration of COD in waste water from 93 mg/L to about 48 mg/L, which can meet the requirement of circulating water for COD index [5]. Y.Lara et al. catalyze 30 mg/L phenol-containing waste water with TiO2 UV-light 40 % degradation for four hours [6]. Antonopoulou M et al. study the phenol-containing waste water catalyzed by non-metallic modified TiO2 by sol-gel method, finding that grain size, adsorption capacity and band gap can all influence the photocatalytic activity [7]; TiO2 has a wide band gap (Eg=3.2 eV) and can only respond to UV-light with wavelength less than 387 nm. To improve the photocatalytic performance of TiO2 in visible light, element doping is one of the effective methods. Transition metals (Ce, etc.) have 4f electrons, easily produce multi-electron configurations, and their oxides also have many crystal forms, strong adsorption selectivity, and good electronic conductivity and thermal stability [8]. The doping of N element can shift the excitation light wavelength of TiO2 to the visible region, and can effectively suppress the increase of the particle size of TiO2. The decrease of the particle size is also beneficial to the increase of photocatalytic activity [9].
A large number of previous studies have focused on UV-light catalyzed phenol-containing waste water and activated carbon as an adsorbent to adsorb phenol-containing waste water. The concentration of photocatalytic treatment is low and the adsorption can’t effectively improve the biodegradability and the cost of activated carbon is high and difficult to recover. Thus, there are many defects in the treatment of coking waste water. In view of this, this study uses modified coal char and metal non-metal co-doped TiO2 to treat phenol-containing waste water, reduces the cost of adsorption, and realizes visible light catalysis. This study first uses modified coal char to adsorb high-concentration waste water and then uses TiO2 visible light photocatalysis. The two complement with each other, which can not only expand the concentration range of waste water treatment, but also effectively improve the biodegradability, laying a foundation for further application.
2.1 Industrial analysis of coal and biomass
The coal and biomass used in the experiment are naturally dried and ground into fine powder, and made into pulverized coal and biomass powder through a 240 mesh sieve and placed in a dryer. Industrial analysis is conducted on coal according to national standard GB/T212-2001. At present, the characteristic analysis method of biomass refers to the determination method of coal. The results are shown in Table 1.
Table 1. Industrial analysis of samples
|
% |
Industrial analysis |
|||
|
Md |
A |
V |
FC |
|
|
Shanxi bituminous coal |
3.14 |
18.29 |
27.60 |
50.97 |
|
Shengli lignite |
24.04 |
27.53 |
21.46 |
26.97 |
|
Zhaocheng bituminous coal |
0.78 |
44.24 |
15.40 |
39.58 |
|
Chongqing bituminous coal |
1.05 |
24.69 |
11.26 |
62.99 |
|
Hebei cotton stalk |
5.01 |
3.52 |
70.51 |
20.96 |
|
Xinjiang walnut shell |
7.53 |
0.01 |
71.86 |
20.60 |
|
Hainan coconut shell |
8.04 |
1.00 |
80.08 |
10.88 |
|
Shenyang hazelnut shell |
6.07 |
0.57 |
77.77 |
15.59 |
|
Liaoning Pine nut shell |
7.85 |
0.93 |
73.26 |
17.96 |
A certain proportion of butyl phthalate is rapidly added to absolute ethyl alcohol under rapid stirring to produce light yellow transparent solution A, and then a certain proportion of absolute ethyl alcohol glacial acetic acid and water (cerium nitrate solution, hexamethylenetetramine solution) is mixed into solution B. Slowly drop B into A and stir for 15 minutes after mixing thoroughly to form yellow sol. Pour the sol into a hydrothermal kettle and move to an oven for a certain time. Remove the supernatant and calcine in a muffle oven after being dried by microwave oven, and then grind.
2.3 Performance test of materials
2.3.1 Characterization
Morphology analysis: SEM; composition and phase analysis: X-ray diffraction (XRD); specific surface area and pore size distribution: nitrogen adsorption and desorption, BET; absorption spectrum: ultraviolet and visible absorption spectrum (UV-vis).
2.3.2 Test on adsorptive property of coal char
The effects of different factors on the adsorptive property of coal char are studying by adding 4 g/L coal char, 300 mg/L phenol concentration, pH=1, 100 mL phenol solution, and shaking for 150 times with a constant temperature water bath oscillator.
2.3.3 Photocatalytic performance test of TiO2
The photocatalytic activity of the prepared TiO2 is studied in a self-made reactor. Coking wastewater is simulated with phenol solution by using energy-saving lamp light source. 4-aminoantipyrine spectrophotometry is used to determine and COD is determined by oven method. The effect of different factors on the adsorptive property of coal char is studied by adding 4 g/L TiO2, 20 mg/L phenol concentration, pH=2 and 100 mL phenol solution.
3.1 Characterization result
3.1.1 Characterization result of coal char
1) BET analysis
Table 2. BET analysis result
|
|
SBET/(m2·g-1) |
rp/nm |
Vp/(cm3·g-1) |
Vm/(cm3·g-1STP) |
|
Shanxi bituminous coke |
134.77 |
2.77 |
0.0932 |
30.9638 |
|
Shanxi coal + Ce, N-TiO2 |
281.35 |
2.80 |
0.1973 |
64.8452 |
|
Shanxi coal + coconut shell (3: 7) |
350.83 |
2.40 |
0.2113 |
80.6054 |
The specific surface area, pore volume and adsorption capacity of coal char doped with biomass and Ce-N-TiO2 are greatly increased. The specific surface area of coal char modified by coconut shell is the largest, which is nearly 3 times that of pure Shanxi coal char. Further, the addition of biomass can obviously improve the adsorptive property of coal char. Because more alkali metal is contained in the biomass and Ce-N-TiO2 acts as a catalyst to promote coke formation in the coal gasification reaction [10]. At the same pyrolysis time, a higher coal gasification reaction rate will inevitably increase the amount of volatile matter precipitating from coal, and the pore structure of the coal char will be more abundant, thus increasing the specific surface area by 207.83 m2/g compared with ammonia water modification [11]. In addition, the increase of pore volume and adsorption capacity is beneficial to the improvement of adsorptive property [12].
2) SEM analysis
From Figure 1, it can be seen the unmodified Shanxi coke particles are large and obviously agglomerated, the surface is relatively smooth, and the specific surface area is relatively small. Coal char particles modified with biomass and TiO2 are relatively small, most of which are spherical, with rough surface, good dispersion and well-developed pore structure, so that their specific surface area is increased.
Figure 1. SEM of different modified Coal chars
3.1.2 Characterization result of TiO2
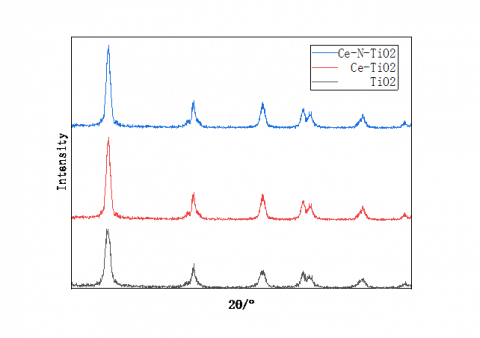
1) XRD Analysis of different TiO2
Figure 2. XRD of different TiO2
Table 3. Crystal form, grain size and anatase proportion of different doping kinds of TiO2
|
Catalyzer |
Preparation conditions |
Grain size |
A proportion/% |
|
TiO2 |
200℃, 3h |
13.42 |
100 |
|
Ce-TiO2 |
200℃, 3h |
10.88 |
100 |
|
Ce-N-TiO2 |
200℃, 3h |
10.57 |
100 |
2) BET analysis of different TiO2
Table 4. Specific surface area, pore size, pore volume and adsorption capacity of different TiO2
|
|
SBET/ (m2·g-1) |
rp/nm |
Vm/ (cm3·g-1STP) |
Vp/ (cm3·g-1) |
|
TiO2 |
89.54 |
11.0 |
20.87 |
0.2457 |
|
Ce-TiO2 |
104.87 |
10.6 |
24.09 |
0.2652 |
|
Ce-N-TiO2 |
112.21 |
10.1 |
25.12 |
0.2964 |
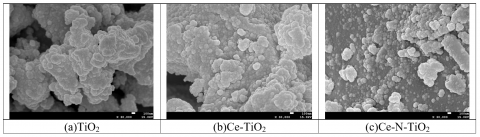
3) SEM analysis of different TiO2
Figure 3. SEM of different TiO2
Figure 3 (a) is the SEM of pure TiO2. The morphology of pure TiO2 is spherical or spheroid, similar to that of (b) and (c), but pure TiO2 has a high degree of aggregation. Ce-N-TiO2 particles are most dispersed and the particle distribution is the most uniform. Ce-TiO2 is in the middle. The particle size of the modified TiO2 decreases slightly, and the specific surface area and pore volume of the catalyst increase with the decrease of the particle size, which indicates that the adsorptive property of TiO2 after doping modification is better than that of pure TiO2.
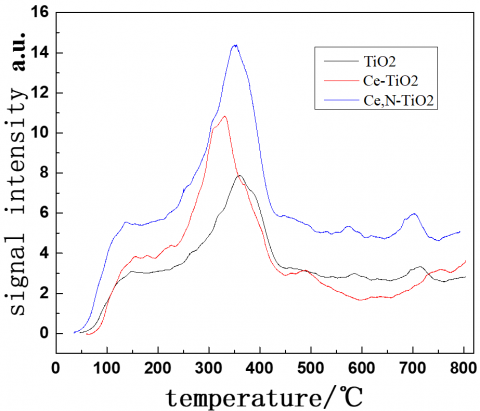
4) NH3-TPD analysis of different TiO2
Figure 4. NH3-TPD of different TiO2
As can be seen from Figure 4, the pure TiO2 catalyst contains approximately 4 desorption peaks, whereas the Ce (1 %)-TiO2, Ce (1 %)-N (14 %)-TiO2 catalyst contains approximately 5 desorption peaks. The location where the peak type is most prominent is in the temperature range of 300-400 ℃. It is the main acidic center where NH3 desorbs from the three catalysts and belongs to the medium strong acid site [14]. Obviously, the acid strength of the three catalysts shows a tendency that Ce (1 %)-N (14 %)-TiO2, Ce (1 %)-TiO2 and pure TiO2 catalysts decrease in turn, showing that the surface acid site of Ce (1 %)-TiO2 catalyst is significantly increased by doping Ce, while the surface acid site of Ce (1 %)-N (14 %)-TiO2 catalyst is further increased by doping N. Therefore, the doping of Ce and N elements may increase the Lew is acid site on the catalyst surface [15], making the catalyst have higher acidity and have stronger adsorption effect on NH3. It is proved that co-doping of Ce and N can improve the adsorptive property of TiO2.
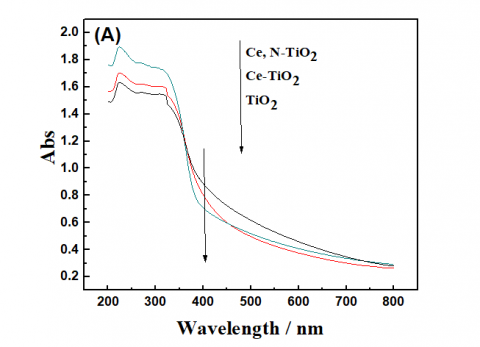
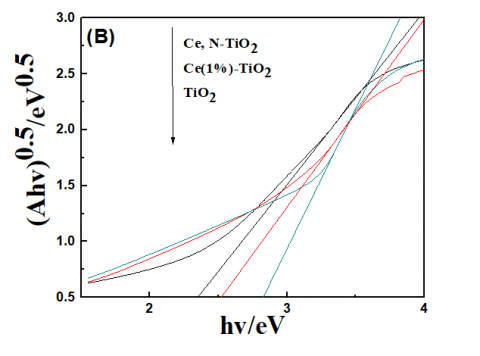
5) UV-vis analysis of different TiO2
(a) UV-vis
(b) Band gap
Figure 5. UV-VIS of different TiO2
From Figure 5 (a), it can be seen that the pure TiO2 absorption spectrum in the UV-light region is wider, and the spectral absorption range of the modified Ce-N-TiO2 catalyst is wider than that of the visible light, which indicates that the utilization rate of the Ce-N-TiO2 catalyst is the highest. The practicality is stronger and photocatalytic performance is the best. Figure 5 (b) shows the band gap of the two materials calculated according to the Tauc method. The band gaps of pure TiO2, Ce-TiO2 and Ce-N-TiO2 are 2.83 eV, 2.54 eV and 2.32 eV, respectively. The smaller the band gap is, the stronger the absorption capacity of visible light is. This conforms to the conclusion of the left figure. The band gap of pure titanium dioxide is supposed to be 3.2 eV according to previous research reports. The smaller values measured here may be due to the occurrence of surface scattering to improve the light trapping capability [16]. When doped with Ce, the f-f transition of Ce3+ occurs under visible light, which results in red shift of Ce-TiO2 absorption spectrum, improving the absorption of TiO2 in the visible region and widening the absorption range of visible light [17]. On this basis, doping of N element can make the conduction band and valence band move to the low energy direction so that the lower photon energy can make carriers be excited and transit, making the catalyst further red shift to a wider range [18]. This indicates that doping of Ce and N synergistically improves the photocatalytic performance.
3.2 Adsorptive property of coal char
3.2.1 Influence of Coke making temperature on adsorption performance
Under the same conditions, Shanxi coal char has the highest efficiency, and the best coking temperature is 850 ℃. With the increase of calcination temperature, the volatile content in coal sample gradually decreases, resulting in the increase of porous structure and increase of specific surface area of coal char. However, when the calcination temperature reaches 950 ℃, the sintering phenomenon occurs in different degrees during the coking process, which hinders the increase of the specific surface area and inhibits the improvement of the adsorptive property of coal char.
Table 6. Influence of Coke making temperature on adsorption performance
|
|
550 ℃ |
650 ℃ |
750 ℃ |
850 ℃ |
950 ℃ |
|
Chongqing coal (%) |
9.2 |
11.3 |
13.7 |
13.8 |
14.8 |
|
Zhaocheng coal (%) |
8.7 |
10.8 |
12.5 |
13.7 |
15.3 |
|
Shengli coal (%) |
13.4 |
14.7 |
17.4 |
23.7 |
17.1 |
|
Shanxi coal (%) |
16.1 |
16.3 |
21.2 |
29.1 |
28.7 |
3.2.2 Adsorptive property of biomass modified coal char
In char preparation by mixing coal sample in proportion of coal species: biomass = 3: 7, the effect of biomass addition on adsorptive property is studied under the conditions of 0.4g of coal char, 300 mg/L phenol concentration, 100 mL phenol solution and 220 r/min stirring rate.
It can be concluded that the adsorption effect of Shanxi coal + coconut shell is better than other coal chars because the volatile content of coconut shell is higher than that of other biomass seen from the industrial analysis of biomass, which results in that the produced biomass char itself has a higher specific surface area. In addition, the ash content of coconut shell is relatively high and the catalyst component contained therein is also relatively high, which does good to volatilization and dispersion loss, and also contributes to the increase of the specific surface area.
Table 7. Adsorptive property of biomass modified coal char
|
|
coconut |
hazelnut |
cotton stalk |
walnut |
pine nut |
|
Chongqing coal |
50.2 |
52.4 |
46.5 |
45.4 |
42.4 |
|
Zhaocheng coal |
47.4 |
49.7 |
42.5 |
38.2 |
41.1 |
|
Shengli coal |
51.4 |
52.8 |
48.5 |
47.6 |
48.9 |
|
Shanxi coal |
62.5 |
57.6 |
49.8 |
52.4 |
52.8 |
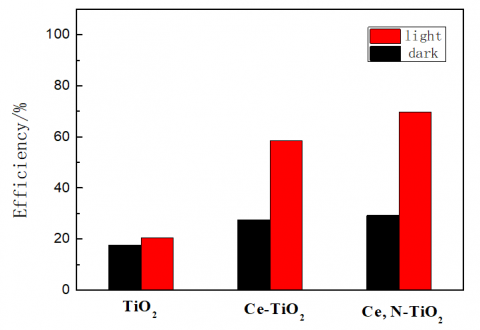
3.3.1 Study on the properties of different TiO2
It can be seen from Figure 6 that the phenol removal rate of different TiO2 is improved under the condition of illumination, which indicates that different TiO2 can be excited into photocatalytic performance under visible light. The removal efficiency of Ce-TiO2 and N-Ce-TiO2 is higher than that of pure TiO2, which indicates that Ce-TiO2 and N-Ce-TiO2 have good photocatalytic properties.
Figure 6. Photocatalytic efficiency of different TiO2
3.3.2 Doping amount of elements and screening of N sources
It can be seen from table 8 that under the same preparation conditions, the photocatalytic efficiency increases first and then decreases as the doping amount of Ce increases. When the doping content of Ce is 1 %, the removal efficiency of Ce-TiO2 to phenol is the highest. The possible reason is that the introduction of Ce can make up photo-generated electrons, inhibit the recombination of photogenerated holes, and improve the photocatalytic efficiency. However, if the doping amount is too large, it may become the center of electron-hole recombination, increase the probability of electron-hole recombination, and decrease the photocatalytic activity. This may be due to the fact that the thickness of the space layer generated by the excitation of TiO2 decreases with increase of Ce, which results from the fact that the space charge potential of the separated electron-hole pair is too low (less than 0.2 V) [19]. Therefore, the optimum doping amount of Ce determined in this experiment is 1 %.
Table 8. Doping amount of elements and screening of N sources
|
Doping ratio % (Ce-TiO2) |
0.5 |
0.7 |
1 |
1.2 |
1.5 |
|
efficiency (%) |
43 |
57 |
62 |
54 |
52 |
|
doping ratio % (N-Ce-TiO2) |
3 |
5 |
14 |
30 |
50 |
|
efficiency (C6H12N4 %) |
53.5 |
61.5 |
69 |
57 |
49 |
|
efficiency (urea%) |
56 |
59.5 |
58 |
25 |
11 |
Under the same preparation conditions, the efficiency of photocatalytic reaction increases with the increase of doping amount of N. The removal efficiency of phenol by N-Ce-TiO2 is the highest when the doping amount of N is 14 %. However, when the doping amount of N is further increased, the efficiency gradually decreases, indicating the synergistic effect of N and Ce on the catalytic activity. This is due to the doping of Ce introduces 4f energy level into the band gap of TiO2. The interaction with the N2p doping level widens the band range of TiO2 in using solar energy [20]. When the doping amount of N is 14 %, N atoms enter the titanium dioxide crystal lattice to replace O atoms, and the number of N atoms in the crystal lattice is optimum, and electron-hole recombination is not excessively formed, so the photocatalytic activity is highest. Therefore, the optimum doping amount of N in this experiment is 14 %.
3.3.3 Optimum hydrothermal temperature and time
From Table 9, it can be seen that under the present experimental conditions, as the hydrothermal time increases, the photocatalytic efficiency also increases because the particle crystallinity is better as the hydrothermal reaction time and the hydrothermal temperature increase. Thus, the catalyst will also have a higher specific surface area. After 24 hours, the efficiency is basically unchanged, so the hydrothermal time used in this experiment is 24 hours. When the hydrothermal temperature is 160 ℃, the treatment efficiency of phenol is the highest, which may be due to the fact that too low temperature will affect the progress of the reaction and complete crystals can’t be obtained while too high temperatures tend to cause collapse of pores and aggregation of particles, which is not conducive to the formation of crystals.
Table 9. Effect of different hydrothermal temperature and time on removal efficiency of Phenol
|
Preparation conditions |
preparation time(h) |
preparation temperature(℃) |
||||||||
|
20 |
22 |
24 |
26 |
28 |
120 |
140 |
160 |
180 |
200 |
|
|
Ce-TiO2(%) |
55.4 |
57.6 |
60.4 |
60.9 |
58.9 |
58.0 |
62.3 |
64.4 |
61.2 |
59.4 |
|
N-Ce-TiO2(%) |
63.4 |
67.2 |
69.2 |
69.3 |
69.5 |
65.4 |
67.3 |
71.0 |
68.7 |
67.4 |
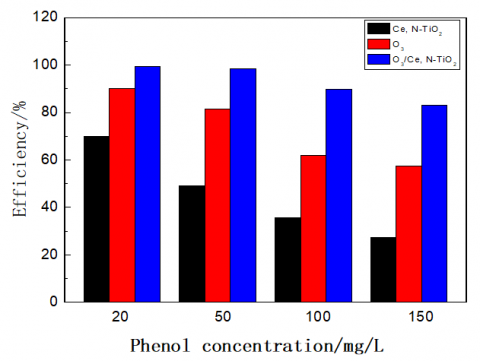
As can be seen from Figure 7, the addition of O3 can effectively improve the photocatalytic oxidation capability of Ce-N-TiO2 and expand the concentration range of the treatable phenol of Ce-N-TiO2. For phenol solution with concentration of 100 mg/L or less, the co-oxidation efficiency of O3 and Ce-N-TiO2 can reach more than 90 %. For 150 mg/L phenol solution, the oxidation efficiency can reach above 80 %.
Figure 7. Influence of O3
A large amount of OH [21] can be produced by the interaction of O3 and H2O. O3 is also a good electron acceptor, which can prevent the recombination of photo-generated electron-hole pair on the surface of TiO2 and improve the photocatalytic activity of Ce-N-TiO2.
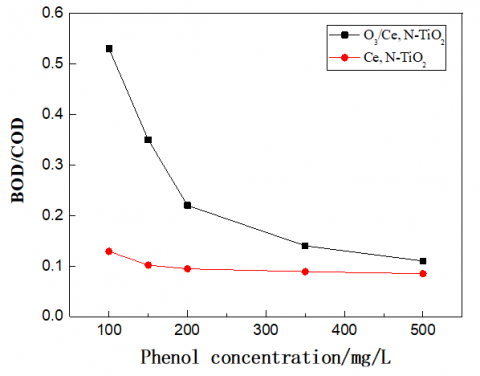
After the addition of O3, the biodegradability can be significantly improved, especially at low phenol concentrations. This indicates that O3 not only can effectively remove phenol and reduce the content of phenol in waste water, but also significantly accelerate the reaction rate of photocatalytic degradation of phenol by O3. At the same reaction time, more phenol is degraded into organic small molecules, so that biochemical property of phenol waste water is obviously improved.
3.4 Combination
3.4.1 Treatment efficiency of adsorption-photocatalysis combination
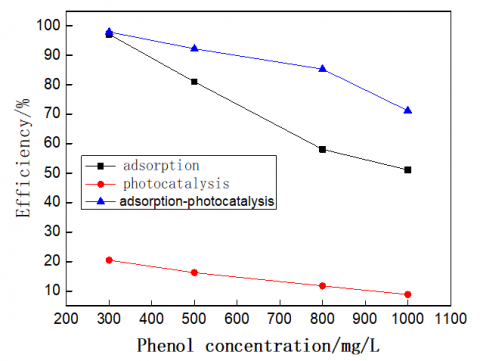
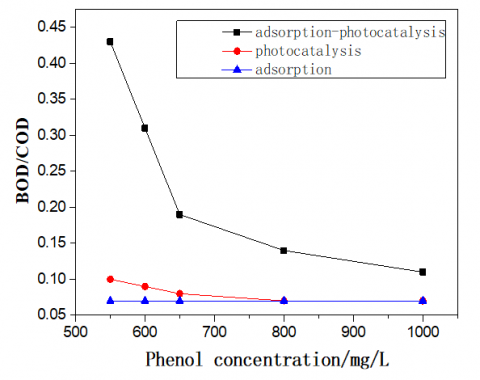
From Figure 8, it can be seen that the treatment effect of phenol waste water by adsorption-photocatalysis combination is obviously better than that of the two alone. With the increase of phenol concentration, the removal effect is more obvious. In addition, when the phenol concentration is high, the removal efficiency of the adsorption-photocatalysis combination is larger than the combined treatment efficiency of the two mainly because the concentration of the phenol is greatly reduced after the adsorption treatment to reach the concentration range of the photocatalytic treatment. In addition, compared with the combined treatment result of ozone/activated carbon in document [22], the addition amount of the adsorbent is reduced from 50 g/L to 4 g/L, which is more than 10 times, and the removal efficiency is also improved by 20 %. The combined process of adsorption/Ce-N-TiO2/O3 photocatalysis improves the biodegradability of phenol waste water with lower concentration (about 600 mg/L), and the BOD/COD value is increased to more than 0.3, basically meeting the requirements of conventional biochemical treatment. For the high-concentration phenol waste water, the biodegradability is obviously improving and the BOD/COD value is increased by about 0.15 compared with that before the combination. Under the same experimental conditions, the improvement degree is higher than 0.08 of ozone/activated carbon combined treatment in document [23].
Figure 8. Comparison of Phenol removal efficiency of photocatalysis and adsorptio
Combined with the research result of biodegradability, it can be found that the biodegradability of phenol waste water with low concentration is greatly improved by the adsorption-photocatalysis combination, and the removal efficiency can reach more than 95%, and the effluent can be directly discharged. For phenol wastewater of high concentration, the adsorption-photocatalysis combination is mainly reflected in the decrease of removal efficiency and the improvement of biodegradability to a certain extent, which can be used in the pretreatment process of high-concentration phenol waste water. It can effectively relieve the operation load of subsequent biochemical treatment or simplify the biochemical treatment process.
(1) The specific surface area of Shanxi coal char modified by coconut shell is increased to be 350.83 m2/g, which is 216.06 m2/g higher than that before modification. When the dosage of 300 mg/L phenol-containing waste water with is 4 g/L, the efficiency is 62.5 %, 33.4 % higher than that before modification;
(2) The modified TiO2, Ce-TiO2 and N-Ce-TiO2 prepared by hydrothermal assisted sol-gel method are both anatase, which have larger specific surface area and smaller band gap, higher activity and stronger practicability under visible light. The visible light catalytic efficiency of 20 mg/L phenol-containing waste water is 60.4 % and 69.2 %, respectively, which is nearly 3 times higher than that before modification.
(3) The addition of O3 auxiliary oxidant can produce more hydroxyl radicals, promote the catalytic efficiency of visible light, increase the concentration and efficiency of waste water treated with TiO2, and make the total efficiency greater than the sum of the two.
(4) Modified coal char with coconut shell and N-Ce-TiO2 can be used to treat phenol-containing waste water with high concentration, which can make the treatment efficiency reach more than 80 %, improve the biodegradability to make the BOD/COD higher than 0.3, laying a foundation for the follow-up treatment.
This work was financially supported by National Natural Science Foundation of China (Grant No. 51708212) and Fundamental Research Funds for the Central Universities (Grant No: 2017MS142).
[1] Ren, J., Li, J., Chen, Z., Cheng, F.Q. (2018). Fate and wetting potential of bio-refractory organics in membrane distillation for coke wastewater treatment. Journal of Chemosphere, 208: 450-459. https://doi.org/10.1016/j.chemosphere.2018.06.002
[2] Yu, X., Xu, R., Wei, C. (2016). Removal of cyanide compounds from coking wastewater by ferrous sulfate: Improvement of biodegradability. Journal of Hazardous Materials, 302: 468-474. https://doi.org/10.1016/j.jhazmat.2015.10.013
[3] Yang, X.X., Zheng, X.F., Gao, X.M., Chai, H., Guo, Y., Fu, F. (2017). Adsorption thermodynamics and kinetics of benzoic acid on modified char. Ion Exchange and Adsorption, 33(5): 472-480. https://cnki:sun:ljyx.0.2017-05-011
[4] Karri, R.R., Sahu, J.N., Jayakumar, N.S. (2017). Optimal isotherm parameters for phenol adsorption from aqueous solutions onto coconut shell based activated carbon: Error analysis of linear and non-linear methods. Journal of the Taiwan Institute of Chemical Engineers, 80: 472-487.
[5] Liu, S.C., Xue, G.F., Zhang, L., Wan, D., Shao, Q.T., He L. (2013). Study of modified coke on the advanced treatment of coking wastewate. Journal of Advanced Materials Research, 726-731: 1739-1743. https://doi.org/10.4028/www.scientific.net/amr.726-731.1739
[6] Lara-López, Y., García-Rosales, G., Jiménez-Becerril, J. (2017). Synthesis and characterization of carbon-TiO2-CeO2 composites and their applications in phenol degradation. Journal of Rare Earths, 35(6): 551-558. https://doi.org/10.1016/S1002-0721(17)60947-5
[7] Antonopoulou, M., Karagianni, P., Giannakas, A., Makrigianni, V., Mouzourakis, E., Deligiannakis, Y., Konstantinou, I. (2016). Photocatalytic degradation of phenol by char/N-TiO2, and char/N-F-TiO2, composite photocatalysts. Journal of Catalysis Today, 280: 114- 121. https://doi.org/10.1016/j.cattod.2016.03.054
[8] Makdee, A., Unwiset, P., Chanapattharapol, K.C., Kidkhunthod, P. (2018). Effects of Ce addition on the properties and photocatalytic activity of TiO2, investigated by X-ray absorption spectroscopy. Journal of Materials Chemistry & Physics, 213: 431-443. https://doi.org/10.1016/j.matchemphys.2018.04.016
[9] Xia, S.M., Zhang, Y.Q., Zheng, Y.F., Xu, C.S., Liu, G.M. (2018). Enhanced visible light photocatalytic activity of N, F-codoped TiO2 powders with high thermal stability. Journal of Environmental Technology, 1: 1-7. https://doi.org/10.1080/09593330.2017.1422555
[10] Yang, J.B., Cai, S.N. (2008). Effects of catalysts on the pore structure and morphology of a lignite char. Journal of Proceedings of the CSEE, 28(11): 24-28. https://doi.org/10.3321/j.issn:0258-8013.2008.11.005
[11] Liu, H., Wu, S.H., Sun, Y., Xu, R., Qiu, P.H., Li, K.F., Qin, Y.K. (2005). Specific area and pore structure of lignite char under the condition of fast pyrolysis. Journal of Proceedings of the CSEE, 25(12): 86-90. https://doi.org/10.3321/j.issn:0258-8013.2005.12.016
[12] Liu, Z.L., Guo, B., Liang, H., Jiang, H.X. (2005). Preparation and characterization of cerium oxidedoped TiO2 nanoparticles. Journal of J Phys.Chem Solids, 66: 161-167. https://doi.org/ 10.1016/j.jpcs.2004.09.002
[13] Li, Q., Han, L.J., Liu, G. (2013). Synthesis characterization and degradation performance of V-N-TiO2 nanoparticle photocatalysts. Journal of Environmental Chemistry, 32(6): 1073-1079.
[14] Chen, Q.F., Jiang, D., Xu, Y., Wu, D., Sun, Y.H. (2009). Visible region photocatalysis of Ce-Si/TiO2 svnthesized using sol-gel-hydrothermal method. Journal of Acta Physico-Chimica Sinica, 25(4): 617-623. https://doi.org/10.3866/PKU.WHXB20090412
[15] Guo, Q., Zhang, Z.H., Ma, X.P., Jing, K., Shen, M.L., Yu, N., Tang, J.H., Dionysiou, D.D. (2017). Preparation of N, F-codoped TiO2 nanoparticles by three different methods and comparison of visible-light photocatalytic performances. Journal of Separation and Purification Technology, 175: 305-313. https://doi.org/10.1016/j.seppur.2016.11.041
[16] Bensouici, F., Bououdina, M., Dakhel, A.A., Tala-Ighil, R., Tounane, M., Iratni, A., Souier, T., Liu, S., Cai, W. (2017). Optical, structural and photocatalysis properties of Cu-doped TiO2 thin films. Journal of Applied Surface Science, 395: 110-116. https://doi.org/10.1016/j.apsusc.2016.07.034
[17] Yang, N.Z., Guo, R.T., Pan, W.G. (2016). The deactivation mechanism of Cl on Ce/TiO2 catalyst for selective catalytic reduction of NO with NH3. Journal of Applied Surface Science, 378: 513-518. https://doi.org/10.1021/jp8088148
[18] Dong, L., Peng, Y., Liu. H.M., Cai, C.G., Tan, D.Y., He, H.P., Zhu, J.X., Chen, T.H. (2013). Quantitative characterization of the solid acidity of montmorillonite using combined FTIR and TPD based on the NH3 adsorption system. Journal of Applied Clay Science, 80: 407-412. https://doi.org/10.1016/j.clay.2013.07.006
[19] Li, X.L., Mao, Y., Leng, K.Y., Ye, G., Sun Y.Y., Xu, W. (2017). Synthesis of amino-functionalized MIL-101(Cr) with large surface area. Journal of Materials Letters, 197: 192-195. https://doi.org/10.1016/j.matlet.2017.03.034
[20] Zhou, L., Deng, J., Liao, L., Zhao, B.Y., Xiao, F.Z., An, L. (2008). Preparation and photo catalytic activity of cerium and nitrogen-codoped TiO2. Journal of Applied Chemical Industry, 37(8): 857-860. https://doi.org/10.3969/j.issn.1671-3206.2008.08.007
[21] Wang, B., Zhou, Y., Ren, H.Y., Huang, Z.Y. (2016). Study on mechanism of MgO catalytic ozonation process for phenol degradation. Journal of Acta Scientiae Circumstantiae, 36: 4009-4016. https://doi.org/10.1039/C7RA07553G
[22] Yang, D.M., Yuan, J.M., Xia, H. (2014). Advanced treatment of coking wastewater by ozone combined with activated carbon. Journal of Chinese Journal of Environmental Engineering, 8(9): 3665-3668.
[23] Chang, G.F., Liu, B., Hong, W. (2015). Biodegradability improvement of processes of activated carbon catalyzed ozonation for coking wastewater treatment. Journal of Water Purification Technology, 34(3): 22-25. https://doi.org/10.3969/j.issn.1009-0177.2015.03.005