
Nawras Faris Ali* | Rasul M. Khalaf
© 2026 The authors. This article is published by IIETA and is licensed under the CC BY 4.0 license (http://creativecommons.org/licenses/by/4.0/).
OPEN ACCESS
Predicting discharge through vertical sluice gates remains challenging, particularly under submerged-flow conditions, because the downstream water level affects the contracted jet and the discharge characteristics. This study experimentally investigates the hydraulic performance of a vertical sluice gate under free- and submerged-flow conditions, focusing on the relationship between the contraction coefficient (Cc) and the discharge coefficient (Cd). Under free-flow conditions, Cc was determined from direct measurements of the contracted jet. Under submerged-flow conditions, where the vena contracta could not be clearly observed, Cc was estimated using an analytical approach based on the energy equation and the relevant measured hydraulic variables. The Cd was determined from the measured discharge and the corresponding theoretical discharge relationship. The results indicate that the relationship between Cc and Cd depends on the flow condition and the relative gate opening. Under free-flow conditions, Cd ranged approximately from 0.49 to 0.56. Under submerged-flow conditions, Cd decreased as the submergence ratio increased, reaching approximately 0.21 at the highest submergence level investigated. These findings highlight the importance of accounting for downstream conditions when estimating discharge through vertical sluice gates.
discharge coefficient, sluice gate, vertical gate, water resources, hydraulic structures, free and submerged flow
Vertical sluice gates are widely used to regulate flow in irrigation channels, water-conveyance systems, and hydraulic laboratories. Accurate discharge estimation is essential for the effective operation of these structures because the flow is influenced by jet contraction, energy losses, and pressure distribution near the gate opening. The discharge coefficient (Cd) relates the actual discharge to the theoretical discharge through the gate opening [1, 2]. Its value is affected by the flow characteristics, including jet contraction and velocity distribution. Consequently, an inaccurate estimate of Cd can lead to errors in discharge calculations [3, 4]. Reliable estimation of this coefficient is therefore important for hydraulic design, flow regulation, and discharge measurement [5].
The hydraulic performance of vertical sluice gates depends on the gate opening, upstream water depth, and downstream hydraulic conditions. Under free-flow conditions, the downstream water level generally has a limited influence on the discharge, which is primarily governed by the upstream water depth and gate opening. Under submerged-flow conditions, however, the downstream water level affects the flow field and the effective head across the gate. Consequently, discharge relationships developed for free flow may not be directly applicable to submerged flow unless the influence of the downstream water level is considered [6, 7].
Recent studies have further advanced the understanding of flow characteristics beneath sluice gates under different hydraulic conditions. Vaheddoost et al. [8] developed an approach for estimating the Cd of vertical sluice gates under submerged-flow conditions by incorporating contraction and energy-loss coefficients into the discharge formulation. Similarly, Shakouri et al. [6] investigated the relationship between Cd, Cc, and the energy-loss coefficient and employed symbolic regression to develop predictive relationships for submerged flow. More recently, Liu et al. [5] proposed a comprehensive model for both free and submerged sluice-gate flows, considering flow contraction, velocity distribution, and energy losses. These studies demonstrate the importance of incorporating different hydraulic effects to improve discharge prediction. Nevertheless, further experimental investigations are required to examine the combined influence of gate-opening and submergence ratios on Cd and Cc.
Dimensional analysis provides a systematic framework for identifying relevant dimensionless variables and examining their relationships. For sluice-gate flow, parameters such as the relative gate-opening ratio and the submergence ratio may be important in describing discharge behaviour. Further investigation is therefore needed to clarify how Cc and Cd vary between free- and submerged-flow conditions and to establish relationships that are consistent with the hydraulic variables measured experimentally.
This study aims to investigate flow through a vertical sluice gate under free and submerged-flow conditions and to develop dimensionless relationships for estimating the Cd. Particular attention is given to the relationship between the Cc, the relative gate-opening ratio (w/y₁), and the submergence ratio (yₜ/y₁). The analysis uses relevant energy and momentum relationships to interpret the experimental observations and develop correlations within the investigated range of conditions.
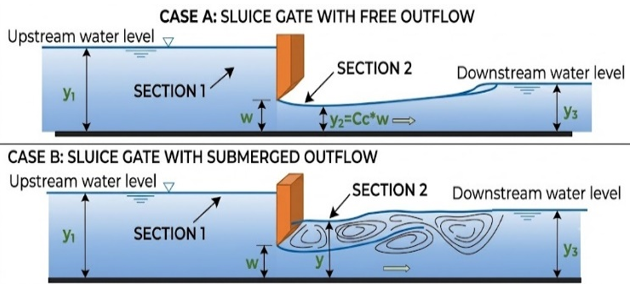
Vertical sluice gates are widely used to regulate discharge and water levels in open channels. Flow beneath a gate involves acceleration, jet contraction, turbulence, and energy dissipation. The hydraulic behaviour depends on several factors, including the upstream water depth, gate opening, downstream water depth, and flow regime. Figure 1 illustrates the flow patterns associated with free- and submerged-flow conditions for a gate without lateral or bottom contraction.
Under free-flow conditions, the downstream water level does not significantly affect the emerging jet. A hydraulic jump may form downstream of the vena contracta, depending on the downstream conditions. Under submerged-flow conditions, the increased tailwater level submerges the emerging jet and alters the downstream pressure distribution. Consequently, the discharge characteristics may differ from those observed under free-flow conditions [9-12].
Figure 1. Sluice gate: (a) free flow, (b) submerged flow
Free flow condition under vertical gates occurs when the tailwater depth, yt is sufficiently low to allow a hydraulic jump to happen downstream of the gate, as shown in Figure 1(a). The general vertical gate formula for flow under a gate with different openings is:
$Q=C_{\mathrm{d}} b_{\mathrm{g}} w \sqrt{2 g y_1}$
where, $Q$ is the sluice gate discharge in $\mathrm{m}^3 / \mathrm{s}, b_{\mathrm{g}}$ is the width of the gate in $\mathrm{m}, w$ is the vertical gate opening, $y_1$ is the upstream water depth, $C_{\mathrm{d}}$ is the discharge coefficient, and $q$ is discharge per unit width $\left(\frac{m^3 / s e c}{m}\right)$ and is defined as: $q=\frac{Q}{b}$.
$q=C_{\mathrm{d}} w \sqrt{2 g y_1}$ (1)
Hydraulically, the sluice gate cases exist when y1= w or less. Thus, in the case of y1= w or less, Eq. (1) does not work. Considering this limiting value and the coordinates of the free flow discharge curve, the following equation is obtained [1]:
$C_{\mathrm{d}}=\frac{C_{\mathrm{c}}}{\sqrt{1+C_c \frac{w}{y_1}}}$ (2)
$C_{\mathrm{c}}=\frac{y 2}{w}$ (3)
Submerged flow: when the tailwater depth y3 rises, the jump is drowned, and the flow is submerged, which affects the Cd (Figure 1(b)).
An approximate analysis can therefore be made by treating the case as one of “divided Flow”. While there will be some energy loss between sections 1 and 2, a much greater portion of the loss will occur in the expanding flow between Sections 2 and 3. Hence, assume as an approximation that all the loss occurs between Sections 2 and 3, i.e., that E1 = E2:
$y_1+\frac{q^2}{2 g y_1^2}=y+\frac{q^2}{2 g y_2^2}$ (4)
while the momentum equation can be applied between 2 and 3, M1 = M2:
$\frac{q^2}{g y_2}+\frac{y^2}{2}=\frac{q^2}{g y_3}+\frac{y_3{ }^2}{2}$ (5)
Note that for both equations, specifically at Section 2, the hydrostatic thrust is y, not y2.
In the normal situation, occurring in practice, y1, y2, and y3 are known, and it is required to calculate q, or for a given q, y1 and y3 are known, and it is required to calculate y2 (or w, where y2 = Cc w). In both situations, y can be solved after some manipulations that may be performed carefully.
Now, let us call yt the tail water depth.
From the energy equation:
$\begin{gathered}\frac{q^2}{2 g}\left(\frac{1}{y_2^2}-\frac{1}{y_1^2}\right)=y_1-y \\ q=\sqrt{2 g\left(y_1-y\right)\left(\frac{y_1^2 y_2^2}{y_1^2-y_2^2}\right)} \\ q=\sqrt{2 g y_1 \frac{\left(y_1-y\right)}{y_1}\left(\frac{y_1^2 y_2^2}{y_1^2-y_2^2}\right)} \\ q=y_2 \sqrt{2 g y_1\left(1-\frac{y}{y_1}\right)\left(\frac{y_1^2}{y_1^2-y_2^2}\right)} \\ q=\sqrt{\left(1-\frac{y}{y_1}\right)\left(\frac{1}{1-\left(\frac{y_2}{y_1}\right)^2}\right) y_2 \sqrt{2 g y_1}}\end{gathered}$
Note that: $y_2=C_{\mathrm{c}} \mathrm{w}$.
$q=C_{\mathrm{c}} \sqrt{\left(\frac{1-\frac{y}{y_1}}{1-\left(\frac{y_2}{y_1}\right)^2}\right)} w \sqrt{2 g y_1}$ (6)
Comparing the above equation with Eq. (3) yields:
$C_{\mathrm{d}}=C_{\mathrm{c}}\left(\frac{1-\frac{y}{y_1}}{1-\left(\frac{y_2}{y_1}\right)^2}\right)^{\frac{1}{2}}=C_{\mathrm{c}}\left(\frac{1-\frac{y}{y_1}}{1-C_{\mathrm{c}}^2\left(\frac{w}{y_1}\right)^2}\right)^{\frac{1}{2}}$ (7)
or,
$\frac{q^2}{2 g y_1^3}=C_{\mathrm{c}}^2\left(\frac{1-\left(\frac{y}{y_1}\right)}{1-C_{\mathrm{c}}^2\left(\frac{w}{y_1}\right)^2}\right)\left(\frac{w}{y_1}\right)^2$ (8)
The Cd through hydraulic gates is primarily dependent on both the immersion ratio and gate opening ratio. In this regard, attempting to model the discharge equation based on a fixed coefficient does not account for the effect of these ratios. Consequently, the formulation of the dimensionless approach in this study presents a more scientifically based approach for predicting the discharge through gates. It is possible to establish practical correlations and models for discharge through gates using this scientific method.
In order to minimize the dependence on particular experimental conditions and generalize the discharge equation, the Buckingham π-theorem was used in dimensional analysis. Based on previous literature, the discharge equation through the gate is expected to depend on the following parameters:
Cd = f(Q, b, w, y₁, yt, g, ρ)
n =7, m = 3
The dimensions of the variables are provided in Table 1 based on the basic dimensional system Mass, Length, Time (MLT).
Table 1. Dimensions of hydraulic parameters using Mass, Length, Time (MLT)
|
Symbol |
Description |
Dimension |
|
Q |
Discharge |
$L^3 T^{-1}$ |
|
B |
Gate width |
L |
|
w |
Gate opening |
L |
|
y₁ |
Upstream water depth |
L |
|
yt |
Tailwater depth |
L |
|
g |
Gravitational force |
$L T^{-2}$ |
|
Ρ |
Density |
$\mathrm{M} \mathrm{L}^{-3}$ |
$\begin{gathered}f_2\left(\pi_1, \pi_2, \pi_3, \pi_4\right)=0 \\ \pi_1=y_1^{a_1} g^{b_1} \rho^{c_1} Q \\ \pi_2=y_1^{a_2} g^{b_2} \rho^{c_2} w \\ \pi_3=y_1^{a_3} g^{b_3} \rho^{c_3} b \\ \pi_4=y_1^{a_4} g^{b_4} \rho^{c_4} y t\end{gathered}$
By following the dimensional analysis approach for estimating the value of $\pi_1$
$$
\begin{gathered}
\pi_1=y_1^{a_1} g^{b_1} \rho^{c_1} Q \\
M^0 L^0 T^0=(L)^{a_1}\left(L T^{-2}\right)^{b_1}\left(M L^{-3}\right)^{c_1}\left(L^3 T^{-1}\right)^1
\end{gathered}
$$
For $M: c_1=0$
For $L: a_1+b_1-3 c_1+3=0 ; a_1+b_1+3=0$
For $T:-2 b_1-1=0 ; b_1=\frac{-1}{2} ; a_1=\frac{5}{2} ; \pi_1=\frac{Q}{y_1^{5 / 2} \sqrt{g}}$
Thus, the final functional relationship may be reduced to:
$C_d=f\left(\frac{y_t}{y_1}, \frac{w}{y_1}\right)$
Cd is influenced by several dimensionless hydraulic parameters, particularly the relative gate-opening ratio (w/y₁) and the submergence ratio (yt/y₁). The relative gate-opening ratio represents the geometric influence of the gate opening on flow contraction and discharge, whereas the submergence ratio describes the effect of downstream water depth on the flow beneath the gate [13]. Recent investigations have highlighted the importance of considering contraction and energy-loss coefficients when estimating discharge under submerged conditions [6, 8]. Furthermore, comprehensive flow models have demonstrated that section contraction, velocity distribution, and energy losses should be considered when predicting discharge under both free and submerged conditions [5]. Accordingly, these dimensionless parameters are considered in the present study to investigate their influence on the discharge coefficient under the tested hydraulic conditions.
Prior research has indicated that under completely turbulent flow conditions, the following equation is obtained:
$\frac{q}{\sqrt{2 g y_1^3}}=f\left(\frac{w}{y_1}, \frac{y_t}{y_1}\right)$
Gravitational acceleration (g) only affects the curve's displacement. As a result, it was eliminated to enable a broader representation, and US units were used for the analysis.
$\frac{q^2}{y_1^3}=f\left(\frac{w}{y_1}, \frac{y_t}{y_1}\right)$
This approach allows a direct comparison between experimental results, numerical simulations, and earlier research and offers a cohesive framework for assessing both free and submerged flow regimes.
4.1 Experimental facility
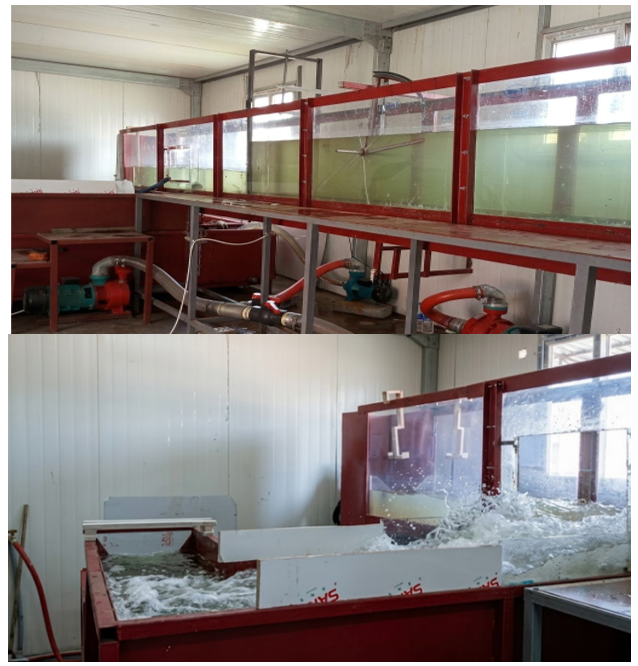
The experimental study was conducted in a laboratory open-channel flume to investigate the hydraulic features of vertical sluice gate flow under free and submerged flow. The flume was constructed of a rigid steel frame with side walls of tempered glass to allow for clear observation of the flow pattern and the jet contraction under the gate. The channel was 6 m in length, 0.5 m in width, and 0.8 m in depth, as shown in Figure 2.
Figure 2. Open-channel flume used in experimental work
The water was fed to the flume from a storage tank by two parallel pumps, and the discharge was regulated by a valve in the supply line. A vertical sluice gate was installed perpendicular to the channel axis, and the measurements were carried out under steady flow conditions.
4.2 Sluice gate model
The sluice gate used for the tests was made of toughened glass and was fixed in position spanning the entire width of the flume. The sluice gate dimensions were 0.50 m in width, 0.80 m in height, and 0.01 m in thickness, with a straight, sharp bottom edge. The sluice gate was positioned in a vertical orientation relative to the bed of the flume.
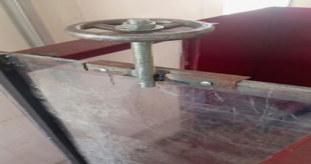
A model of a vertical sluice gate shown in Figure 3 was constructed and installed in the flume. Relative opening ratios were studied by manually varying the gate opening. Upstream water levels were maintained constant, and several opening conditions were tested in order to analyse the effect of gate opening upon contraction and discharge characteristics.
Figure 3. Vertical gate
4.3 Experimental procedure
4.3.1 Control of the experiment and measurements
Discharge control was done through adjustment of the valve located at the pump outlet, whereas the upstream and downstream water depths were measured by means of precision point gauges graduated at 0.1 mm scale. Discharge was measured using a calibrated triangular (V-notch) weir placed at the end of the main flume, along with another calibrated triangular weir placed at the end of the side channel. Steady-state conditions were first attained before recording data for gate opening, water depth, and discharge. The capacity of the main pump was 10 HP with maximum discharge of 2330 L/min and maximum head of 24.5 m, while another 5 HP pump was also used in the recirculating flow.
4.3.2 Free flow condition
Experiments of free flow were conducted by closing the side channel to prevent lateral discharge and to make sure the flow passed through the main channel under the vertical sluice gate. In this case, the downstream section was free of backwater effects, and the jet contraction could develop without the influence of submergence. With the flow conditions stabilized, measurements were taken at various gate openings (w) and for different upstream water depths (y₁). The discharge (Q) was established by the calibrated V-notch weirs at the end of the main channel and side, while the upstream water depth, gate opening, and jet depth at section (2) were measured using point gauges. The Cc was evaluated using the energy equation between (1) and (2), and the Cd was calculated using the obtained flow rate (Q) and other measurements.
4.3.3 Submerged flow conditions
With reference to the submerged flow in which the downstream water level was controlled to produce backwater behind the vertical sluice gate, the side channel was blocked to prevent flow interference from the lateral directions, to be able to measure the discharges in a precise way by the use of the calibrated V-notch weirs downstream of the main and the side channel, respectively, under variable water depths for the downstream conditions with the upstream steady flow conditions. The collected hydraulic data (depth of upstream flow, depth of downstream flow, depth of opening of the sluice gate, depth of vena contracta) and measured discharge, upstream depth, and downstream depth were used for the calculation of Cc by the use of the energy approach in sections (1) and (2) and thence the Cd. The contraction characteristics were also obtained from the calculated hydraulic information and the developed analytic correlation since it was not possible to observe the exact boundary of the vena contracta when water was overflowing below the gate.
4.4 Measuring hydraulic parameters
All hydraulic parameters necessary to calculate the contraction and Cd were measured under steady-state conditions. This typically included discharge (Q), water depth on the upstream and downstream sides (y1 and yt, respectively), gate opening (w), and contracted jet depth. The discharge was measured using calibrated V-notch weirs located at the discharge end of both the main and side channels.
The water depths and gate openings were recorded with point gauges; the range for these parameters is shown in Table 2.
Cc was measured directly based upon the contracted jet depth in the case of free flow, while the derived analytical solution was used under submerged flow as locating the contracted jet was difficult. The resulting values of Cc were then used to calculate Cd.
Table 2. Experimental conditions
|
Flow Condition |
Gate Opening Ratio w/y1 |
Upstream Depth y1 cm |
Downstream Depth yt cm |
|
Free flow |
0.1–0.9 |
6–50 |
- |
|
Submerged flow |
0.3–0.95 |
5–28 |
10–20 |
4.5 Repeatability of experiments
The repeatability of experiments was evaluated by repeating some tests under the same hydraulic conditions. Three different operating regimes were repeated, with three to four replicates taken for each one. The coefficient of variation of the measured unit discharge varied between 3.03% and 6.36%, showing that the experimental measurements had good reproducibility, as shown in Table 3, but at the same time the variations showed that the recirculating channel flow system is very sensitive to the hydraulic conditions.
Table 3. Repeatability of experiments
|
y (cm) |
w (cm) |
n |
Mean q (m²/s) |
SD (m²/s) |
CV (%) |
Relative Range (%) |
|
9.0 |
6.0 |
3 |
0.0153 |
0.0005 |
3.363 |
6.592 |
|
10.0 |
7.0 |
4 |
0.0158 |
0.0010 |
6.359 |
13.940 |
|
25.5 |
8.0 |
3 |
0.0375 |
0.0011 |
3.028 |
6.019 |
5.1 Free flow
5.1.1 Determination of contraction coefficient
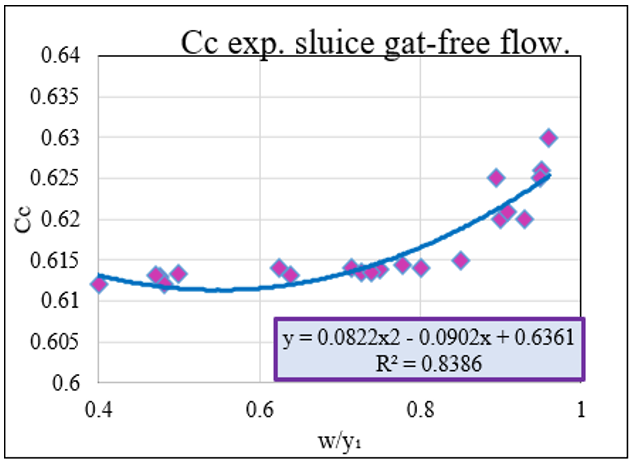
Under free-flow conditions, the Cc was determined experimentally by measuring the contracted jet depth (y₂) at the vena contracta immediately downstream of the sluice gate. The Cc was calculated as the ratio of the contracted jet depth to the gate opening (w), as expressed in Eq. (9).
Cc = y2/w
Figure 4 illustrates the variation of the experimentally determined Cc with the relative gate-opening ratio (w/y₁) under free-flow conditions. The measured values of Cc ranged from 0.6123 to 0.6300, with an average value of 0.62115. The results indicate that Cc increased as the relative gate-opening ratio increased.
Initially, the increased concentration of converging streamlines under the gate causes a highly contracted jet and a small value of Cc.
Figure 4. Relation between contraction coefficient (Cc) and w/y1 for sluice gate
But as the gate opening increases relative to the width of the sluice gate, it affects the contraction to a lesser extent, and Cc increases.
A second-order polynomial regression equation for experimental values was fitted to the data and obtained with an R² value of 0.8386, which is a reasonable correlation for the relative gate opening ratio and the Cc when free-flowing.
Regression analysis was conducted based on the experimentally measured values of Cc and (w/y₁), and Eq. (9) for prediction was obtained. The derived equation is a mathematical expression of the dependence of Cc for free-flow under a vertical gate and serves as an easy means of determining the value of Cc without measuring the vena contracta height directly at each flow condition. The equation is given below:
$C_{\mathrm{c}}=0.0822\left(w / y_1\right)+0.09\left(w / y_1\right)+0.6361$ (9)
The performance of the proposed equation was also further assessed using statistical measures, such as the coefficient of determination (R²), root mean square error (RMSE), and mean absolute percentage error (MAPE), which are represented in Table 4.
Table 4. Validation statistics of the proposed empirical formula for predicting the contraction coefficient (Cc)
|
Parameter |
Value |
Evaluation |
|
Regression equation |
Eq. (9) |
|
|
R² |
0.8386 |
Good agreement |
|
R |
0.740 |
Strong correlation |
|
RMSE |
0.00210 |
Very low prediction error |
|
MAE |
0.00172 |
Very low deviation |
Statistical analysis based on Table 4 shows that there is a good agreement between the values acquired using the suggested correlation and experimental data. Values of R², RMSE, MAE, and MAPE reflect the quality of calibration of the fitted correlation. Since Eq. (10) is developed using the fitted Cc correlation based on the same set of experimental data, these statistical parameters reflect the quality of the fit of the proposed correlation and cannot be treated as independent validation results.
5.1.2 Relationship between the (q²̸y₁³) and (w/y₁)
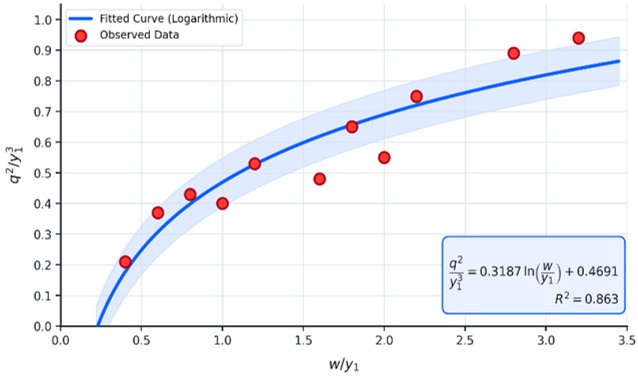
The main advantage of this parameter is the possibility of comparing the results of experiments carried out under different conditions (gate openings and upstream depths). Thus, this relationship helps in detecting deviations from the theory and evaluating the effect of contraction. Figure 5 illustrates the variation of the discharge parameter (q²̸y₁³) as a function of the relative gate opening ratio (w/y₁) for the vertical gate under free-flow conditions.
The increasing nature of the relationship between the dimensionless ratio and the w/y₁ ratio from the laboratory test is exhibited as in Figure 5. This is because any increase in discharge value leads to an increase in the kinetic energy of the flow, hence resulting in greater openings of the gate in order to release such discharge values. It should also be noted that the graph continues to flatten out steadily in order to reach a point where the increase in opening ratio leads to a smaller change in the hydraulic parameter value.
Figure 5. Relationship between the (q²̸y₁³) and (w/y₁) (free)
5.1.3 Calculation of the discharge coefficient
The Cd of the vertical gate in the case of free flow was determined based on the obtained Cc and the relative gate opening ratio (w/y₁) from Eq. (2). This method connects the discharge efficiency with both jet contraction and the hydraulic condition of the opening in every experimental test.
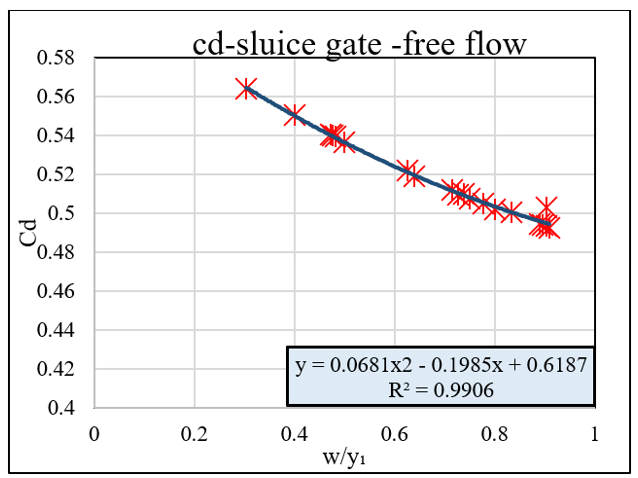
The relation between the value of Cd and the value of the relative gate opening (w/y₁) in the case of the vertical gate with free-flow condition is demonstrated in Figure 6. According to the experimental data, it can be noticed that there is a tendency for the value of Cd to decrease in proportion to the increase in the value of w/y₁; the value of Cd ranged from about 0.56 at smaller opening ratios to almost 0.49 at larger values of w/y1.
Figure 6. Relation between discharge coefficient (Cd) and w/y1 for sluice gate -free flow
The trend of the relation obtained can be expressed as a behavior connected to the previous Cc. In the zone of minimum opening, the streamlines suffer a stronger confinement, and then an important contraction, but the ratio of real contracted section to theoretical contracted section offers values comparatively higher for the Cd. When we approach the maximal opening, the weight of "jet contraction" ceases to be very important in relation to the loss and to the inequalities in velocity distributions in water flow. And Cd decreases progressively, giving a curve well described by a polynomial regression of order two:
$C_d=0.0681(w / y 1)^2-0.1985(w / y 1)+0.6187$ (10)
The quadratic regression model exhibits great validity statistically, since R² and adjusted R² are both greater than 0.98, MAPE is less than 0.25%, while the result of the F-test shows great statistical significance of the model (p < 0.001). Residuals are minimal, evenly distributed, and close to zero.
5.2 Submerged flow
5.2.1 Determination of contraction coefficient
In the case of submerged flow, the Cc could not be calculated directly since the contracted jet and vena contracta were obscured by the downstream water. Hence, the depth of the water above the submerged jet (y) was determined at the contracted portion during each experiment. The data collected, along with other hydraulic parameters such as the gate opening, upstream depth, downstream depth, and discharge, were used to compute the Cc using the developed hydraulic in Eq. (7).
Separate sets of experiments were performed for each of the three submergence ratios used (S = 0.80, 0.85, and 0.90). The Cd values were found to be similar and rather close for each submergence case. All experimental data were taken into consideration as a whole to derive the needed results.
Figure 7. Submerged flow under vertical gate for S = 0.8
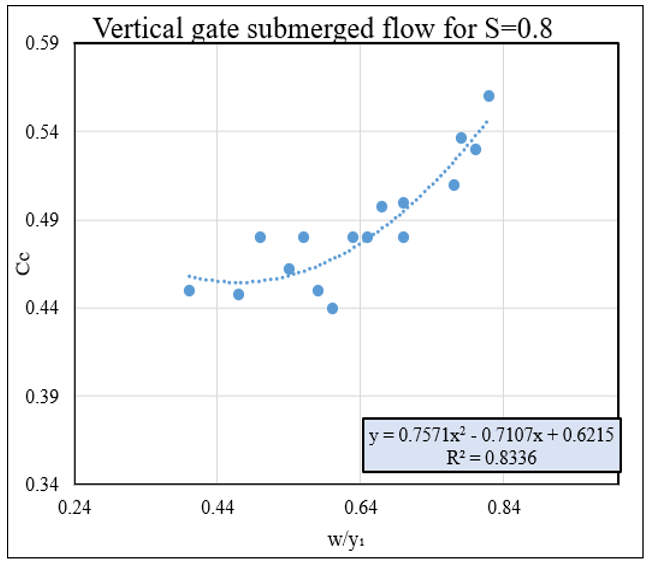
With a constant submergence ratio of S = yt/y₁ = 0.80, the computed Cc of the vertical gate exhibited a nonlinear increment with respect to the relative gate opening ratio (w/y₁). As shown in Figure 7, Cc varied from about 0.44 at the smaller values of relative opening to 0.56 at larger values of the relative opening ratio. The relation between Cc and the upstream water depth (y₁) reveals that the contraction mechanism occurring downstream of the vertical gate is affected by the amount of energy available upstream and the development of the jet formed after its passage through the gate opening. With an increase in the upstream water depth, both the pressure head and energy of the approaching flow increase, affecting the streamlines around the gate opening and hence the contraction of the jet. Higher water depth upstream decreases the importance of the gate opening in determining the Cc, thereby changing the value of Cc. This suggests that the value of Cc is not only determined by the geometry of the gate opening, but also by the upstream water depth.
$C_c=0.757\left(\frac{w}{y^1}\right)^2-0.7107\left(\frac{w}{y^1}\right)+0.6215$ (11)
5.2.2 Relationship between the discharge parameter and relative gate opening
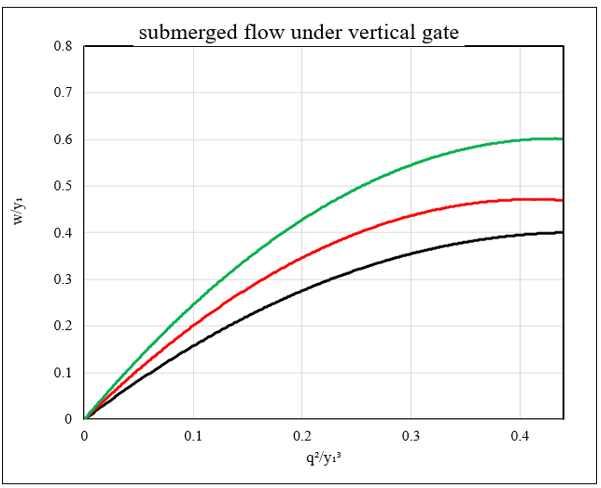
The behavior of the parameter (q²/y₁³) and the ratio (w/y₁) illustrates the impact of submergence on the performance of the vertical gate. As illustrated in Figure 8, (w/y₁) rises nonlinearly in proportion to an increase in (q²/y₁³), while higher submergence ratios need greater relative gate openings to pass a certain discharge intensity. The curve at yt/y₁ = 0.90 has the maximum opening ratios, followed by yt/y₁ = 0.85 and 0.80, since the deeper downstream water level leads to a reduction in the effective head difference across the gate. This rise in rate gradually becomes slower with increasing discharge intensities.
Figure 8. Relation between parameter q²/y₁³ and w/y₁
5.2.3 Calculation of the discharge coefficient
For evaluation of the Cd for submerged flow conditions, the Cd of the vertical gate under submerged flow conditions was estimated based on the energy-momentum approach, where Cc is the effective area reduction in the jet. But Cd cannot be determined based on Cc only since the level of water downstream alters the effective head and energy losses of the gate. Thus, Cd was treated as a function of Cc, gate opening ratio, and submergence ratio. For the vertical gate, the Cd was calculated based on the derived hydraulic equation using Cc, the measured water depth above the submerged jet y, and the submergence ratio. Since the contracted jet was hidden due to being submerged by the downstream water, Cc cannot be obtained directly. It was first estimated using the measured variables and then used along with y to calculate the Cd equation. The use of y means that the downstream backwater pressure affects the contracted jet, while Cc reflects the decrease in effective flow area.
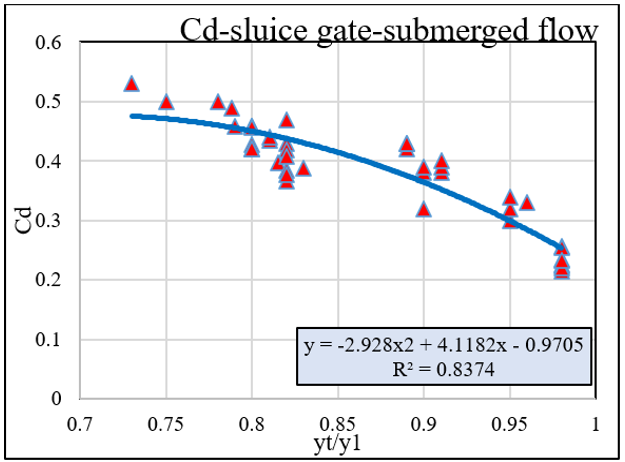
The Cd as a function of the submergence ratio (yt/y₁) of the vertical gate operating under the submerged flow regime is shown in Figure 9. It can be observed that there is a progressive decline in Cd with an increase in the value of the submergence ratio from approximately 0.52 for lower submergence ratios to almost 0.21 for the highest one studied. The decline can be primarily explained by the increased downstream water depth, which leads to a reduced head difference across the gate and the increased importance of backwater pressure and energy loss effects on the flow dynamics. The quadratic function fitted to the data provides R² = 0.8374, meaning that the submergence ratio is an important control parameter affecting the discharge properties of submerged gates.
$C_d=-2.928(y t / y 1)^2+4.1182\left(y t / y_1\right)-0.9705$ (12)
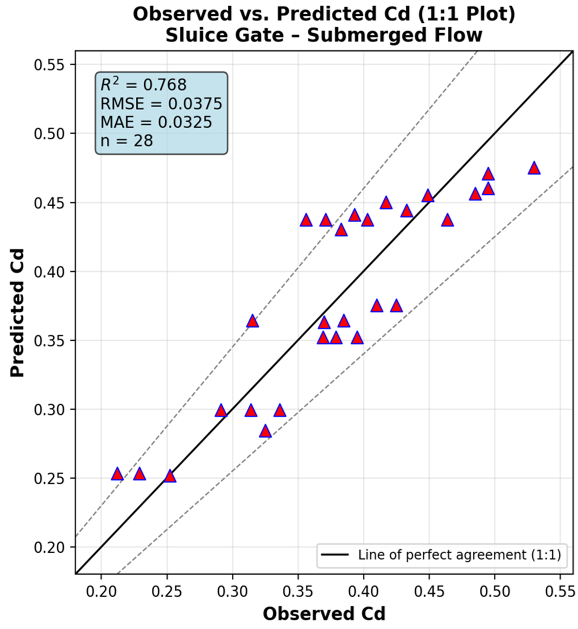
As can be seen from Figure 10, a large proportion of the points fall within the 15% band on either side of the line of perfect agreement, and there is slightly more scatter at the extremities (high Cd at yt/y₁ ~ 0.73 and low Cd at yt/y₁ ~ 0.98), as one would anticipate, with much fewer readings available there than in the middle and well-represented region between (yt/y₁ ~ 0.80 to 0.91). The statistical performance of the proposed regression equations was evaluated using the statistical indicators presented in Table 5.
Figure 9. Relation between discharge coefficient (Cd) and the submergence ratio (yt/y₁)
Table 5. Statistical indicator (Cd-submerged flow)
|
Statistical Indicator |
Value |
|
Number of observations (n) |
28 |
|
Coefficient of determination (R²) |
0.768 |
|
Adjusted R² |
0.750 |
|
Correlation coefficient (r) between observed and predicted |
0.878 |
|
Root mean square error (RMSE) |
0.0375 |
|
Mean absolute error (MAE) |
0.0325 |
Figure 10. The statistical parameters for estimating the accuracy of equations
Table 6. Equations of discharge coefficient (Cd) and contraction coefficient (Cc) by regression analysis
|
Condition |
Equation |
R² |
|
Free |
Cc = 0.0822 (w/y₁) + 0.09 (w/y₁) + 0.6361 |
0.8386 |
|
Free |
Cd = 0.0681 (w/y₁)² − 0.1985 (w/y₁) + 0.6187 |
0.98 |
|
Submerged |
Cc = 0.757 (w/y₁)² − 0.7107 (w/y₁) + 0.6215 |
0.833 |
|
Submerged |
Cd = −2.928 (yt/y1)² + 4.1182 (yt/y1) − 0.9705 |
0.837 |
Based on the experimental results obtained under free-flow and submerged-flow conditions, regression analysis was performed to establish empirical relationships for the Cd and Cc. The resulting equations are presented in Table 6, together with their corresponding R². These equations describe the relationships between the hydraulic parameters and the discharge and Cc within the experimental range investigated.
Measurement uncertainties were taken into consideration for all major experimental parameters like discharge, water depth at the upstream water depth at the downstream, gate opening and depth of the vena contracta. The water depths were measured using point gauges having graduations of 0.1 mm, whereas the discharges were measured using calibrated triangular V-notch weirs. Repeatability of experiments was established using repeat experiments carried out under similar hydraulic conditions, and the means, standard deviations, and coefficients of variation were calculated. These measurement uncertainties were then propagated to the computed values of contraction and Cd to check the reliability of the experimental results and derived equations. These measurement uncertainties were then propagated to the computed values of Cc and Cd.
A thorough experimental investigation was conducted for vertical sluice gate flow for free and submerged conditions, which concludes as follows:
The authors thank the College of Engineering at Tikrit University, Iraq, for supporting the laboratory work conducted for this study.
[1] Chaudhry, M.H. (2008). Open-Channel Flow. Springer US, Boston.
[2] Te Chow, V. (1959). Open Channel Hydraulics. McGraw-Hill, New York.
[3] Silva, C.O., Rijo, M. (2017). Flow rate measurements under sluice gates. Journal of Irrigation and Drainage Engineering, 143(6): 06017001. https://doi.org/10.1061/(ASCE)IR.1943-4774.0001177
[4] Yoosefdoost, A., Lubitz, W.D. (2022). Sluice gate design and calibration: Simplified models to distinguish flow conditions and estimate discharge coefficient and flow rate. Water, 14(8): 1215. https://doi.org/10.3390/w14081215
[5] Liu, Y.S., Hao, C.L., Zhang, X., et al. (2025). Sluice gate flow model considering section contraction, velocity uniformity, and energy loss. Journal of Hydrology, 656: 133020. https://doi.org/10.1016/j.jhydrol.2025.133020
[6] Shakouri, B., Ismail, I., Safari, M.J.S. (2023). Energy loss and contraction coefficients-based vertical sluice gate's discharge coefficient under submerged flow using symbolic regression. Environmental Science and Pollution Research, 30: 76853-76866. https://doi.org/10.1007/s11356-023-27388-1
[7] Montes, S. (1998). Hydraulics of Open Channel Flow. CRC Press.
[8] Vaheddoost, B., Safari, M.J.S., Zeynali, R.I. (2021). Discharge coefficient for vertical sluice gate under submerged condition using contraction and energy loss coefficients. Flow Measurement and Instrumentation, 80: 102007. https://doi.org/10.1016/j.flowmeasinst.2021.102007
[9] Dehghani, F., Hosseini, S.H., Najarzadeh, S. (2023). Experimental study of discharge coefficient of U-shaped sluice gate under free and submerged flow conditions. Journal of Hydraulic and Water Engineering, 1(1): 1-17. https://doi.org/10.22044/jhwe.2023.12315.1001
[10] Cang, Z., Jia, D., Wang, J., Yang, J., Hao, Y., Chen, X. (2024). Discharge coefficient of vertical sluice gates with broad-crested weir under free-submerged orifice flows using best subset regression. Water Science & Technology, 89(7): 1816-1830. https://doi.org/10.2166/wst.2024.102
[11] Jalil, S.A., Sarhan, S.A., Ibrahim, S.S. (2016). Effect of prismatic sill on the performance of free flow under sluice gate. Science Journal of University of Zakho, 4(1): 150-158. https://doi.org/10.25271/2016.4.1.353
[12] Belaud, G., Cassan, L., Baume, J.P. (2009). Calculation of contraction coefficient under sluice gates and application to discharge measurement. Journal of Hydraulic Engineering, 135(12): 1086-1091. https://doi.org/10.1061/(ASCE)HY.1943-7900.0000122
[13] Habib, A. (2011). Characteristics of free flow below sluice gate Belo radial stilling basin with negative step. The Egyptian International Journal of Engineering Sciences and Technology, 14: 349-360.