
Hanani Farhah Harun* | Zaminor Zamzamir Zamzamin
© 2026 The authors. This article is published by IIETA and is licensed under the CC BY 4.0 license (http://creativecommons.org/licenses/by/4.0/).
OPEN ACCESS
This study develops and implements an integrated simulation framework to examine how vaccination progress, government interventions, and banking sector support jointly influence the loan repayment performance of small and medium enterprises (SMEs). COVID-19 introduced large-scale disruptions to business operations, increasing SME vulnerability through cash-flow challenges, labour shortages, and supply chain interruptions. Governments responded with fiscal support, wage subsidies, and regulatory relief, while banks implemented moratoria and restructuring programmes. Vaccination rollouts played a central role in restoring operational continuity. Despite the significance of these factors, their joint dynamic effects on SME repayment performance remain under-theorised. This paper focuses exclusively on modelling and numerical simulation, without empirical estimation. It introduces (i) a dynamic micro-level panel model capturing persistence and firm heterogeneity; (ii) a Markov transition model describing movements between on-time repayment and delinquency states; and (iii) a continuous-time stochastic differential equation model describing aggregate repayment trajectories. The paper formalises boundary conditions, derives stability lemmas, establishes the existence and uniqueness of solutions, and specifies the simulation design. Numerical simulations showed that coordinated vaccination rollout, sustained government support, and active banking interventions accelerated repayment recovery, reduced volatility, and improved repayment stability relative to uncoordinated or prematurely withdrawn policies. Monte Carlo experiments further showed that these qualitative patterns were robust to stochastic shocks, indicating that they reflect structural features of the modelling framework rather than specific parameter realisations. The integrated modelling framework provides a rigorous analytical foundation for future empirical work using survey and administrative datasets.
SME loan repayment, dynamic panel modelling, stochastic differential equations, multi-layer modelling framework, credit risk dynamics, government support, banking interventions, vaccination effects
Small and medium enterprises (SMEs) form the backbone of most economies, contributing extensively to employment, supply chain stability, and long-term productivity. Their financial resilience, however, is often fragile, as SMEs typically operate with limited liquidity buffers and narrower access to credit compared to larger firms. SMEs typically hold much smaller cash and liquid asset cushions than large firms. As a result, they are more vulnerable to shocks and more dependent on bank credit [1]. Because SMEs cannot easily substitute external financing, banks often treat them as high-risk borrowers, leading to stricter collateral requirements and a higher incidence of credit rationing [2, 3]. Empirical work using the Survey on the Access to Finance of Enterprises (SAFE) showed that rejection rates for SME loan applications spiked during the European sovereign debt crisis and remained elevated relative to larger firms, especially when the banking sector was concentrated [3]. SMEs are highly exposed to systemic shocks due to limited liquidity buffers and strong dependence on continuous cash flows.
The COVID-19 pandemic exposed and amplified these vulnerabilities. Banks that entered the pandemic with “low capital headroom” above Basel III buffers cut SME loan commitments by about 10 percentage points and saw higher borrower exits, indicating that tighter bank capital amplifies the credit squeeze on smaller firms [4]. Recent analysis by the European Investment Bank (EIB) confirms that micro and small enterprises are the most exposed to deteriorating funding conditions, while larger firms experience less severe credit constraints [5]. Lockdowns, sudden demand contractions, labour shortages, and supply chain disruptions imposed unprecedented pressures on SMEs’ operational continuity and cash-flow stability, directly affecting their ability to meet loan repayment obligations.
In response, governments and banks implemented extensive support measures ranging from wage subsidies, grants, and tax relief to moratoria, restructuring schemes, and regulatory forbearance [6, 7]. Simultaneously, national vaccination campaigns played a pivotal role in reducing workforce absenteeism and enabling the gradual reopening of economic activity [8, 9]. While each of these factors (vaccination, government support, and banking interventions) has been studied in isolation, their combined, dynamic influence on SME loan repayment performance before and after the pandemic remains insufficiently understood. Existing empirical studies rarely integrate public health progress with fiscal and financial sector responses. Nor do they model how these determinants interact over time as SMEs transition across states of financial stress.
This paper addresses this gap by developing and applying an integrated simulation framework that links vaccination progress, government support, and banking sector interventions to SME loan repayment dynamics. The framework combines three complementary modelling layers: a micro-level dynamic panel model, a Markov transition model governing movements between on-time and delinquent states, and a macro-level stochastic differential equation (SDE) model describing economy-wide repayment trajectories. This structure enables the analysis of both firm-level persistence and aggregate adjustment under alternative policy configurations.
The primary objective of the study is not empirical estimation, but rather to evaluate the dynamic implications of coordinated and uncoordinated policy responses through numerical simulation. By conducting scenario-based simulations and Monte Carlo experiments, the paper examines how policy timing, intensity, and interaction effects influence repayment stability and recovery paths. In doing so, the study provides a computational foundation for future empirical work and offers policy-relevant insights into the design of crisis-response mechanisms for SME financing.
The remainder of the paper is structured as follows. Section 2 reviews the literature on SME financial resilience, government and banking interventions, and the emerging role of public health variables, and identifies the methodological gaps that motivate the present study. Section 3 presents the integrated modelling framework, detailing the micro-level dynamic panel, meso-level Markov transition, and macro-level SDE layers. The section also explains the conceptual rationale linking vaccination, fiscal policy, and banking support to repayment performance. Section 4 develops the extended theoretical framework, formalising the model assumptions, proving key lemmas, and establishing stability, identifiability, and convergence properties required for simulation and empirical application. Section 5 outlines the simulation design and scenario construction. Section 6 interprets the model results conceptually, examines threshold and nonlinear effects, and summarises cross-layer consistency of the model components. Section 7 presents numerical simulation results, including policy comparisons and Monte Carlo robustness analyses. Section 8 concludes the paper.
Understanding SME loan repayment performance requires integrating insights across financial economics, crisis management, public policy, and more recently, public health. The COVID-19 pandemic has renewed scholarly interest in how external shocks propagate through SME financing channels and how policy interventions can stabilise vulnerable firms. This section synthesises five major strands of literature: SME financial resilience, government support measures, banking sector interventions, vaccination and public health economics, and post-pandemic modelling approaches. It also highlights the methodological and conceptual gaps that motivate the present study.
2.1 Small and medium enterprise loan repayment, financial health, and cash-flow resilience
SME loan repayment behaviour has traditionally been examined through the lens of firm-level financial health and credit risk modelling. Late payment of invoices creates cash flow uncertainty that erodes creditworthiness and prompts banks to tighten lending, often through credit rationing and higher interest rates [10].
When banks begin a crisis with limited capital headroom, they cut SME loan commitments by roughly 10 percentage points and see a higher incidence of borrower exits, amplifying repayment pressure on already thin liquidity buffers [4]. Classical studies emphasise the role of cash-flow stability, profitability, leverage, and liquidity in determining a firm’s ability to meet debt obligations. SMEs, compared to large firms, tend to have weaker balance sheets, limited diversification, and greater exposure to market fluctuations. As a result, they exhibit higher sensitivity to shocks such as demand variation, supplier delays, and credit tightening.
Prior literature identifies repayment persistence as a robust empirical regularity: firms with strong repayment histories are statistically more likely to remain compliant, reflecting both behavioural consistency and lenders’ selection effects [11]. During the COVID-19 pandemic, SMEs with weak cash flow buffers experienced a 21 percent rise in insolvency risk, whereas firms that maintained innovation-driven cash reserves were more resilient and preserved access to bank credit [12].
However, SMEs’ dependence on short-term cash flow means even temporary disruptions can trigger delinquency or default. In environments where bank credit is constrained, SMEs turn to trade credit as an alternative source of financing, using supplier-provided credit to smooth payments and sustain operations [13]. Empirical evidence from the SAFE data shows that past credit restrictions increase the likelihood of future restrictions, but firms that have built stronger cash flow cushions can mitigate this state dependence and reduce the probability of later rationing [14].
Studies before COVID-19 show that liquidity shortages, working capital constraints, and unexpected operational interruptions are major predictors of repayment difficulties [15]. Overall, robust cash flow management, through diversified financing, prudent liquidity buffers, and innovation, enhances resilience and helps SMEs meet loan obligations and sustain financial health in turbulent periods. Taken together, these findings indicate that SME financial fragility is highly path-dependent and vulnerable to external shocks.
2.2 Government support as a stabilising mechanism in crisis periods
The role of government intervention has long been studied in financial crises, with research suggesting that fiscal support can serve as a buffer that prevents mass firm failures. During COVID-19, governments worldwide enacted unprecedented support packages that included direct grants, wage subsidies, tax deferrals, guarantee schemes, and low-interest credit programs.
Empirical evidence suggests that such support helped maintain employment, prevent liquidity collapses, and reduce bankruptcy filings [16]. However, the impacts varied significantly across firm size, industry classification, and pre-pandemic financial condition. Some studies argue that support was unevenly distributed, or that schemes may have induced moral hazard or extended the life of non-viable “zombie” firms [17, 18].
Crucially, most existing research treats government support as a static or exogenous variable. Very few studies model how its effectiveness interacts with behavioural dynamics (e.g., firms adapting strategies over time) or structural conditions that shifted throughout the pandemic. Existing reviews point out that studies of SME loan behaviour often ignore core financial mechanisms, such as credit rationing, moral hazard, and institutional economics, when assessing how state interventions affect stability [19, 20].
Even fewer integrate government support into a formalised mathematical modelling framework that incorporates pre- and post-pandemic structural shifts. This gap motivates the inclusion of government support as an explicitly modelled, time-varying determinant of loan repayment in the present study.
2.3 Banking sector interventions and credit market responses
Financial institutions played a central role during the pandemic, implementing moratoria, loan restructuring, grace periods, and flexible classification guidelines. Research shows that moratoria and restructuring helped prevent widespread SME defaults in the early phases of the pandemic by alleviating immediate repayment pressures [21]. These interventions also served broader macroprudential goals by ensuring stability in the banking system.
However, the literature warns of potential unintended consequences. Regulatory forbearance may obscure true credit risk, shift delinquency rates temporarily rather than structurally, and increase future non-performing loans if firms recover slowly [22]. Additionally, studies highlight variation in bank responses depending on risk appetite, customer portfolio composition, and expectations of post-pandemic recovery [23].
Importantly, existing work tends to evaluate banking interventions retrospectively or descriptively. Few studies incorporate these interventions into dynamic models capturing how repayment performance evolves over time under changing banking policies. Moreover, interactions between banking support and other crisis-related determinants, such as vaccination or government fiscal support, remain under-modelled. The present study addresses these gaps by situating banking interventions as a formal input in both micro-level and macro-level repayment models.
2.4 Vaccination, workforce continuity, and economic reopening
Vaccination is rarely explored in classical SME financing literature, yet the pandemic forced researchers to reconsider the relationship between public health and economic performance. Empirical evidence from Latin America showed that higher vaccination rates in 2021 were associated with a faster return to work, especially for disadvantaged groups whose lagging vaccine uptake had been an impediment to labour market recovery [24]. High vaccination rates reduce illness-related absenteeism, ease labour shortages, and support the reopening of retail, services, and manufacturing sectors. These effects restore business continuity and indirectly improve firms’ ability to generate cash flow and maintain loan repayments.
A panel data model covering 43 countries found that each additional 1% of the population vaccinated generated roughly 10 900 extra employed persons per quarter, offsetting the negative employment shock of COVID-19 infections [25]. Studies in public health economics highlight vaccination as a key mechanism enabling economic normalisation, but only a handful of papers explicitly link vaccination progress to firm-level financial outcomes. At the organisational level, a strong COVID-19 safety climate, shaped by clear policies and communication, boosted employees’ adherence to protective measures and increased willingness to be vaccinated, thereby reducing absenteeism and supporting smoother reopening [26]. Systematic reviews of the pandemic’s labour impact confirm that disruptions were most severe for workers in high-contact occupations, but that vaccination helped mitigate these disparities by lowering infection-related absences [27].
Some macroeconomic models incorporate vaccination into growth projections, but microeconomic studies remain scarce. There is virtually no modelling framework in the existing SME finance literature that integrates vaccination as a determinant of repayment dynamics or embeds it in a structural modelling architecture. The current study therefore advances the literature by treating vaccination as a quantifiable, time-varying influence on SME financial performance, integrated directly into the dynamic panel, Markov transition, and SDE models.
2.5 Post-pandemic modelling approaches and gaps in the literature
In the wake of COVID-19, researchers have employed a range of modelling approaches to study economic recovery, including general equilibrium models, agent-based simulations, and time-series forecasting [28-31], as well as a flood-related modelling study [32]. These models provide insights into macroeconomic trajectories, but they often overlook SME-specific repayment behaviour, or fail to integrate firm-level financial dynamics with public health variables.
Meanwhile, the credit risk literature predominantly relies on Markov models, dynamic panel models, and survival analysis to analyse default behaviour, yet each approach exhibits limitations when confronted with pandemic-induced disruptions. Dynamic panel models, while effective at capturing borrower heterogeneity and temporal persistence, rarely incorporate public health indicators or structural break mechanisms that reflect abrupt shifts in economic conditions [33]. Markov models, although widely used to represent transitions between repayment states, typically assume static probabilities or rely solely on financial ratios, thereby overlooking the influence of external interventions such as fiscal support or banking forbearance [34]. Continuous-time formulations, including SDE models, offer strong potential for depicting smooth macro-level repayment trajectories [35], but they remain largely absent in SME-focused applications and are seldom integrated with micro-level credit dynamics or crisis-responsive variables.
As a result, to the best of the author’s knowledge, no existing study unifies all three modelling layers into a single coherent framework that captures interactions between public health progress, fiscal support, and banking interventions.
2.6 Synthesis and research gap
The existing literature on SME loan repayment performance can be broadly classified into four methodological strands: (i) static econometric models of default or delinquency, (ii) dynamic firm-level repayment models, (iii) policy evaluation studies focusing on government or banking interventions, and (iv) macro-level or aggregate recovery models developed in response to the COVID-19 shock. While each strand contributes important insights, the strands remain fragmented in both scope and methodological structure.
First, traditional credit risk and repayment studies predominantly rely on static cross-sectional or short-panel econometric models, such as logit, probit, or hazard specifications, to estimate default probabilities based on firm characteristics and macroeconomic indicators. Although these models are well-suited for prediction, they typically abstract from repayment persistence, state dependence, and structural breaks, limiting their ability to capture crisis-driven dynamics and recovery paths.
Second, more recent studies employ dynamic panel models to account for repayment persistence and unobserved firm heterogeneity. These approaches improve upon static specifications by modelling intertemporal dependence in repayment outcomes. However, most dynamic models treat policy interventions as exogenous controls and rarely distinguish between pre- and post-pandemic structural regimes. Nor do they explicitly incorporate public health variables such as vaccination progress.
Third, policy-oriented analyses examine the effects of government fiscal support (e.g., grants, wage subsidies, guarantees) or banking sector interventions (e.g., moratoria, restructuring) in isolation. These studies often use reduced-form evaluation strategies or difference-in-differences designs, focusing on short-term survival or default outcomes. While informative, they do not model how multiple interventions interact dynamically over time, nor how firms transition between repayment states under evolving policy environments.
Fourth, emerging macroeconomic and recovery-focused models developed during and after the COVID-19 pandemic adopt aggregate or representative-agent frameworks, sometimes using stochastic processes to describe economic recovery. These models provide useful high-level insights but lack a clear linkage to micro-level firm repayment behaviour and do not account for heterogeneity in policy exposure across firms.
In contrast to these existing approaches, the proposed framework in this study offers a deliberately integrated, multi-layer modelling architecture that unifies micro-level dynamics, state transitions, and aggregate behaviour within a single analytical structure. Specifically, the framework differs from prior work in four key methodological dimensions.
First, it explicitly incorporates vaccination rates as a time-varying determinant of repayment performance, reflecting the role of public health in restoring operational continuity, an element largely absent from existing credit risk and SME finance models. Second, it jointly models government support and banking interventions, allowing their effects to vary dynamically across pre- and post-pandemic regimes rather than treating them as static covariates. Third, it combines three complementary modelling layers: a dynamic panel model, a Markov transition model, and a continuous-time SDE model, thereby capturing repayment persistence, discrete state changes, and aggregate trajectories within a coherent framework. Finally, the framework is explicitly designed for simulation-based policy analysis, with clearly defined boundary conditions, transition structures, and scenario pathways, rather than solely for retrospective estimation.
By synthesising insights from the credit risk, SME finance, policy evaluation, and macroeconomic recovery literatures, this study positions its contribution not as a substitute for existing models, but as a methodological bridge that connects these strands into a unified simulation-ready architecture. This positioning clarifies how the proposed framework extends the literature beyond sequential empirical findings toward a structurally coherent representation of SME loan repayment dynamics in crisis and recovery contexts.
The literature makes clear that SMEs remain acutely vulnerable to external shocks due to their structural financial fragility, and that government and banking interventions serve as crucial yet inherently dynamic stabilising forces during periods of disruption. At the same time, improvements in public health conditions, most notably through vaccination, play a decisive role in restoring operational continuity and, by extension, repayment capacity. Yet existing empirical and theoretical models consistently treat these determinants in isolation, failing to account for their interconnected and time-varying nature. No integrated modelling architecture has been developed to unify these factors across both pre- and post-pandemic contexts. This paper responds directly to this gap by advancing a comprehensive, multi-layer modelling framework that incorporates dynamic panel, Markov transition, and SDE models into a single analytical system. By formalising the interactions between vaccination progress, government policy, and banking interventions, the study situates itself at the intersection of financial economics, crisis management, and public health-driven modelling, offering a more holistic account of SME repayment dynamics.
Table 1 summarises the key methodological and conceptual differences between existing studies and the proposed framework.
Table 1. Comparative summary of existing literature on small and medium enterprise (SME) repayment and crisis modelling
|
Study |
Level of Analysis |
Core Methodology |
Policy / Intervention Focus |
Dynamic Structure |
Public Health Variable |
Main Limitation Relative to This Study |
|
Caglio et al. [1] |
Micro |
Panel regressions |
Monetary policy transmission |
Static / short-run |
✗ |
Focuses on credit supply; no repayment dynamics or crisis regime shifts |
|
Aristei and Angori [2] |
Micro |
Dynamic panel |
Credit access constraints |
Dynamic persistence |
✗ |
Models persistence but excludes crisis-era policy and health variables |
|
Kaya [10, 12] |
Micro |
Econometric default models |
Insolvency risk |
Reduced-form |
✗ |
Predictive focus; no structural or transition modelling |
|
Berrospide et al. [4] |
Bank–SME |
Panel + stress analysis |
Bank capital buffers |
Comparative static |
✗ |
Banking channel only; no firm-level repayment states |
|
Ferrando and Pál [5] |
Micro |
Survey-based analysis |
Financing conditions |
Descriptive |
✗ |
Lacks formal dynamic modelling |
|
Pelosi et al. [18] |
Micro |
Policy take-up analysis |
Government support |
Static |
✗ |
Evaluates support uptake, not repayment dynamics |
|
Chen and Wheeler [22] |
Portfolio |
Time-series forecasting |
Loan forbearance |
Short-term dynamics |
✗ |
Focus on model error, not behavioural dynamics |
|
Chamboko and Bravo [34] |
Micro–Meso |
Multi-state Markov |
Mortgage outcomes |
State transitions |
✗ |
No policy or health determinants |
|
Barboni et al. [11] |
Micro |
Behavioural experiments |
Repayment behaviour |
Static |
✗ |
Behavioural focus; no financial system integration |
|
Olivieri et al. [24] |
Macro |
Panel macro model |
Vaccination & recovery |
Aggregate dynamics |
✓ |
No linkage to SME credit or repayment |
|
Mosbah and Dharmapala [25] |
Macro |
Cross-country panel |
Vaccination & employment |
Dynamic |
✓ |
Labour focus; no firm-level financial outcomes |
|
Agent-based models (Axtell and Farmer [29]) |
Macro |
ABM simulation |
Crisis propagation |
Fully dynamic |
✗ |
High complexity; lacks tractable credit risk structure |
|
This study |
Micro–Meso–Macro |
Dynamic panel + Markov + SDE |
Joint fiscal, banking & health policy |
Fully integrated |
✓ |
Unified, simulation-ready architecture |
This section presents the modelling architecture used to represent the determinants of SME repayment performance.
This study proposes a three-layer modelling framework:
1. Dynamic Panel Econometric Model—capturing firm-level repayment performance and structural changes pre- vs post-pandemic.
2. Discrete-Time Markov State Transition Model—modelling the probability of moving between repayment states (on-time vs delinquent).
3. Continuous-Time SDE Model—modelling aggregate repayment performance as a continuous dynamic process influenced by the vaccination, government support, and banking support variables (V, G, and B; defined below).
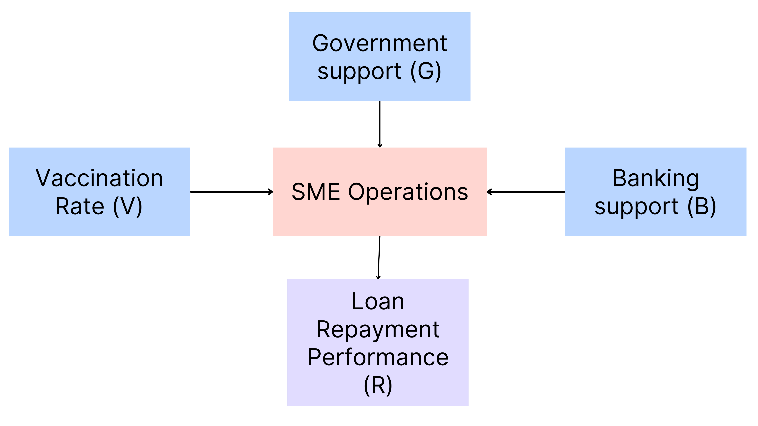
Figure 1 presents a conceptual causal diagram that visualises the interconnected determinants of SME loan repayment performance. The diagram identifies three primary exogenous factors, vaccination progress (V), government support (G), and banking support (B), each represented as a distinct box. Vaccination progress directly affects SME operations by enhancing workforce availability, reducing absenteeism, and supporting the reopening of production, service, and retail activities. Government support, in the form of grants, subsidies, guarantees, and tax deferrals, mitigates liquidity constraints and stabilises working capital, thereby directly strengthening firms’ operational capacity. Banking interventions, such as moratoria, loan restructuring, and flexible classification guidelines, provide both immediate relief from repayment pressures and long-term resilience by lowering the probability of deterioration while increasing the likelihood of recovery.
Figure 1. Conceptual causal framework
These three channels converge on SME operations, depicted as an intermediate node, which acts as the key mechanism translating external inputs into firm-level financial outcomes. SME operations, in turn, drive loan repayment performance (R), represented as the terminal node in the diagram. By explicitly mapping these causal pathways, Figure 1 clarifies how public health progress, fiscal policy, and banking-sector measures interact dynamically to influence repayment trajectories. Moreover, the diagram provides the conceptual foundation for the multi-layer modelling framework. It guides the specification of dynamic panel regressions, Markov transition probabilities, and SDE that collectively capture both micro-level and macro-level repayment dynamics under crisis and post-crisis conditions.
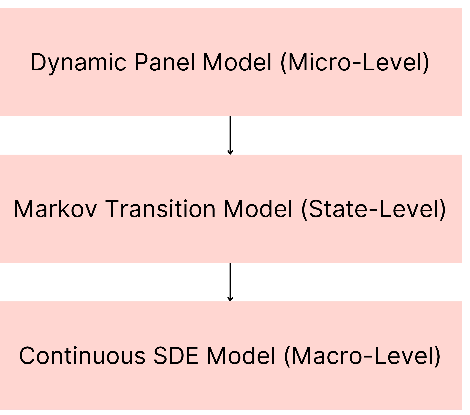
Figure 2 illustrates the multi-layer modelling architecture employed in this study, highlighting the flow of information across micro-, meso-, and macro-level representations of SME repayment dynamics. At the foundational layer, the dynamic panel model captures micro-level borrower behaviour, representing the impact of vaccination (V), government support (G), and banking interventions (B) on firm-level repayment outcomes (R) over time.
These effects are then used to parameterise the Markov transition model at the meso-level, where discrete-state transitions between repayment categories reflect the probability of deterioration or recovery for individual SMEs. Finally, aggregated transition dynamics from the Markov layer inform the continuous-time SDE model at the macro level, representing smooth economy-wide repayment trajectories under evolving policy, health, and banking conditions. This hierarchical integration ensures that firm-level heterogeneity and policy responsiveness are explicitly propagated through to system-level outcomes, allowing the framework to capture both short-term shocks and long-run trends in repayment performance.
Figure 2. Modelling architecture
While the primary objective of this study is to develop a theoretically coherent and internally consistent modelling architecture, the framework is also assessed numerically to demonstrate its feasibility and practical relevance. The paper includes a numerical simulation component based on theoretically calibrated parameters and stylised policy trajectories. The simulation is not intended to provide empirical inference or causal estimation, but rather to illustrate the dynamic behaviour of the proposed system under alternative vaccination, government support, and banking intervention scenarios. This approach aligns with standard practice in computational economics and policy modelling, where simulation serves as a validation and interpretation tool prior to empirical implementation.
3.1 Variable definitions
Let:
$R_{i, t} \in[0,1]$: repayment performance of SME $i$ at time $t$.
$V_{i, t} \in[0,1]$: vaccination index.
$G_{i, t} \in[0,1]$: government support index.
$B_{i, t} \in[0,1]$: banking support index.
$X_{i, t}$: control variables (firm size, sector, business age, location).
$Post_t$: indicator for the post-pandemic period.
All indices are assumed to be normalised within [0,1] and may be constructed in future empirical work from survey items or administrative variables.
3.2 Dynamic panel model specification
To model persistence, heterogeneity, and policy effects, the following dynamic panel model is specified:
$R_{i, t}=\alpha_i+\rho R_{i, t-1}+\beta_V V_{i, t}+\beta_G G_{i, t}+\beta_B B_{i, t}+\gamma^{\prime} X_{i, t}+\varepsilon_{i, t}$ (1)
3.2.1 Structural change component
To capture differences between pre- and post-pandemic eras:
$\begin{aligned} & R_{i, t}=\alpha_i+\rho R_{i, t-1}+\left(\beta_V^0+\delta_V \text { Post }_t\right) V_{i, t}+\left(\beta_G^0\ + \delta_G \text { Post }_t\right) G_{i, t}+\left(\beta_B^0+\delta_B \text { Post }_t\right) B_{i, t}+\gamma^{\prime} X_{i, t}+\varepsilon_{i,t}\end{aligned}$ (2)
where, $\delta_V, ~\delta_G, ~\delta_B$ measure changes in effects after COVID-19. Boundary is set by ensuring $R_{i, t} \in[0,1]$; in which fractional logit or logit-transformation may be used. No estimation is conducted yet; this presents the theoretical model.
3.3 Markov transition model
We assume each SME can be in either state at time t:
S: on-time repayment
D: delinquent/default
Transition probabilities depend on V, G, B, X.
The two-state specification (on-time versus delinquent/default) is adopted deliberately to preserve analytical tractability and to align the Markov layer with the binary repayment indicators commonly observed in supervisory and bank-level datasets. This abstraction captures the primary economic distinction relevant for credit risk assessment, whether an SME is meeting its contractual obligations or has entered financial distress. It also allows transition probabilities to respond flexibly to vaccination progress, government support, and banking interventions. Importantly, the objective of this study is not to replicate detailed loan servicing classifications, but to embed repayment deterioration and recovery within a multi-layer modelling architecture that links micro-level behaviour to aggregate dynamics. Nevertheless, the framework is readily extensible to a multi-state formulation (e.g., on-time, early arrears, restructured, default). In such a formulation, the transition matrix and recovery dynamics generalise naturally, and the continuous-time SDE can be driven by the stationary distribution of the expanded state space. Such extensions are left for future empirical work, where richer administrative data on arrears severity and restructuring status are available.
3.3.1 Transition from on-time to delinquent
$p_{S D}(t)=\Lambda\left(\theta_0+\theta_V\left(1-V_t\right)+\theta_G\left(1-G_t\right)+\theta_B\left(1-B_t\right)+\theta_X X_t\right)$ (3)
where, $\Lambda(\cdot)$ denotes the logistic function.
3.3.2 Recovery (delinquent to on-time)
$p_{D S}(t)=\Lambda\left(\phi_0+\phi_V V_t+\phi_G G_t+\phi_B B_t+\phi_X X_t\right)$ (4)
3.3.3 Transition matrix
$P_t=\left[\begin{array}{cc}1-p_{S D}(t) & p_{S D}(t) \\ p_{D S}(t) & 1-p_{D S}(t)\end{array}\right]$
Let $\pi_t$ denote the proportion of SMEs in state $S$:
$\pi_{t+1}=\pi_t\left[1-p_{S D}(t)\right]+\left(1-\pi_t\right) p_{D S}(t)$
Boundary conditions:
•All transition probabilities $\in$ [0,1].
•Probabilities are clipped to prevent degenerate behaviour.
3.4 Continuous-time stochastic differential equation model (aggregate dynamics)
Aggregate repayment performance $R(t)$ is modelled as:
$d R(t)=a(R, t) d t+b(R, t) d W_t$ (5)
where, $W_t$ is a Wiener process.
Mean-reversion drift term
$a(R, t)=\kappa(\bar{R}(V(t), G(t), B(t))-R(t))$ (6)
where,
$\kappa>0$ : speed of adjustment
$\bar{R}(\cdot)$: equilibrium repayment rate under given policy conditions
Boundary conditions
•Reflective boundaries at $R(t)=0$ and $R(t)=1$.
•Drift must point inward at boundaries.
This section formalises the mathematical structure underlying the modelling framework. Each model layer (dynamic panel, Markov transitions, and SDEs) is clarified through a set of assumptions, lemmas, and propositions ensuring internal coherence, identifiability, and dynamic stability.
4.1 Assumptions for the dynamic panel model
The analysis begins with the repayment function:
$R_{i, t}=\alpha_i+\rho R_{i, t-1}+\beta_V V_{i, t}+\beta_G G_{i, t}+\beta_B B_{i, t}+\gamma^{\prime} X_{i, t}+\varepsilon_{i, t}$ (7)
The extended specification, which incorporates structural breaks, is given in Eq. (2).
Assumption 1 (Bounded Repayment Performance)
For all firms $i$ and time periods $t$:
$0 \leq R_{i, t} \leq 1$
Because repayment performance is measured as a proportion or index, it must reside within this closed interval. If repayment is modelled as a latent continuous variable, this assumption motivates transformations such as logit or probit link functions.
Assumption 2 (Control Variable Exogeneity)
Control variables do not respond to contemporaneous shocks:
$E\left[\varepsilon_{i, t} \mid X_{i, t}\right]=0$
This rules out reverse causality from sudden repayment shocks to contemporaneous firm characteristics such as size or sector.
Assumption 3 (Weak Exogeneity of Policy Indicators)
Vaccination rates, government support, and banking measures may depend on past repayment but not future shocks:
$E\left[\varepsilon_{i, t} \mid V_{i, s}, G_{i, s}, B_{i, s}\right]=0, \forall s \leq t$
This assumption preserves internal validity while recognising that distressed firms might receive targeted interventions.
Assumption 4 (Pre-Pandemic Stationarity)
Before COVID-19:
$R_{i, t}=\alpha_i+\rho R_{i, t-1}+u_{i, t},|\rho|<1$
This ensures stable repayment behaviour. After the pandemic, the structural break terms $\delta_V, ~\delta_G, ~\delta_B$ capture shifts in the data-generating process.
4.2 Lemma and proof for dynamic stability
Lemma 1 (Dynamic Stability)
The repayment process converges to a long-run equilibrium if and only if:
$|\rho|<1$
Proof:
Starting with:
$R_{i, t}=\alpha_i+\rho R_{i, t-1}+Z$
where, $Z$ is constant (policy conditions fixed). Assume convergence:
$\lim _{t \rightarrow \infty} R_{i, t}=R^*$
Thus:
$R^*=\alpha_i+\rho R^*+Z$
Solving:
$R^*(1-\rho)=\alpha_i+Z$
$R^*=\frac{\alpha_i+Z}{1-\rho}$
A finite equilibrium exists if and only if the denominator is non-zero and bounded, implying $|\rho|<1$. Q.E.D.
4.3 Additional lemmas for identifiability and regularity
Lemma 2 (Identifiability of Structural Break Parameters)
Structural break parameters $\delta_V, ~\delta_G, ~\delta_B$ are identifiable if the pandemic period introduces non-zero variation in policy variables relative to pre-pandemic means.
(Proof omitted; based on full-rank conditions.)
Lemma 3 (Uniqueness of FE-GMM Estimator)
Under assumptions (1)–(4), the System GMM estimator is consistent and asymptotically normal. (The result follows from the standard Arellano–Bover and Blundell–Bond assumptions).
4.4 Markov transition model: Theory and proofs
SMEs transition between two repayment states:
• S: On-time payer
• D: Delinquent/default
The model is:
$p_{S D}(t)=\Lambda\left(\theta_0+\theta_V\left(1-V_t\right)+\theta_G\left(1-G_t\right)+\theta_B\left(1-B_t\right)+\theta_X X_t\right)$
$p_{D S}(t)=\Lambda\left(\phi_0+\phi_V V_t+\phi_G G_t+\phi_B B_t+\phi_X X_t\right)$
4.4.1 Assumptions
Assumption 5 (Markov Property)
The next state depends only on the current state and policy conditions:
$P\left(S_{t+1} \mid S_t, S_{t-1}, \ldots\right)=P\left(S_{t+1} \mid S_t\right)$
Assumption 6 (Strictly Positive Transition Probabilities)
For all $t$:
$0<p_{S D}(t), p_{D S}(t)<1$
This ensures non-absorbing behaviour unless otherwise specified.
4.5 Lemma on stationary distribution
Lemma 4 (Stationary Proportion of SMEs in the On-Time State)
If the transition matrix is time-invariant, the stationary proportion is:
$\pi^*=\frac{p_{D S}}{p_{D S}+p_{S D}}$
Proof:
A stationary Markov chain satisfies:
$\pi^*=\pi^*\left(1-p_{S D}\right)+\left(1-\pi^*\right) p_{D S}$
Solving yields:
$\pi^*=\frac{p_{D S}}{p_{D S}+p_{S D}}$
This ratio has policy implications:
•Higher vaccination → increases $p_{D S}$, thus raises $\pi^*$.
•Higher government and banking support → decreases $p_{S D}$, thereby increasing $\pi^*$.
4.6 Continuous-time stochastic differential equation model: Mathematical foundations
At the aggregate level, SME repayment evolves according to:
$d R(t)=a(R, t) d t+b(R, t) d W_t$
$a(R, t)=\kappa(\bar{R}(V(t), G(t), B(t))-R(t))$
4.6.1 Assumptions
Assumption 7 (Lipschitz Continuity)
Drift and diffusion satisfy:
$\left|a(R, t)-a\left(R^{\prime}, t\right)\right|+\left|b(R, t)-b\left(R^{\prime}, t\right)\right| \leq L\left|R-R^{\prime}\right|$
This ensures that no explosive paths occur.
Assumption 8 (Reflective Boundaries)
At boundaries:
$a(0, t)>0, a(1, t)<0$
This prevents the process from leaving [0, 1].
4.7 Proofs and propositions
Proposition 1: Asymptotic Stationarity of the Dynamic Panel with Exogenous Inputs
Statement.
Under Assumptions 1-4 and if $|\rho|<1$, and if $V_{i, t}, G_{i, t}, B_{i, t}, X_{i, t}$ converge to deterministic limits (or ergodic stochastic processes with finite mean), then $R_{i, t}$ is covariance-stationary in the sense that its mean and autocovariances converge to finite limits.
Proof (Sketch).
The AR(1) representation in companion form:
$R_{i, t}-\mu_{i, t}=\rho\left(R_{i, t-1}-\mu_{i, t-1}\right)+\varepsilon_{i, t}$
where, $\mu_{i, t}=\alpha_i+\beta_V V_{i, t}+\beta_G G_{i, t}+\beta_B B_{i, t}+\gamma^{\prime} X_{i, t}$.
If $V, G, B, X$ converge to finite limits (or have stationary distributions with finite means), then $\mu_{i, t}$ converges to $\mu_i$. For $|\rho|<1$, the homogeneous AR operator is stable, so deviations decay geometrically and the mean of $R_{i, t}$ tends to $\mu_i /(1-\rho)$ (consistent with Lemma 1). Autocovariances are geometric sequences multiplied by finite variances of $\varepsilon$. Hence covariancestationary.
Proposition 2: Ergodicity of Time-Homogeneous Two-State Markov Chain
Statement.
Consider the two-state Markov chain with transition matrix (time-homogeneous):
$P=\left[\begin{array}{cc}1-p_{S D} & p_{S D} \\ p_{D S} & 1-p_{D S}\end{array}\right], 0<p_{S D}, p_{D S}<1$
Then $P$ is irreducible and aperiodic; there exists a unique stationary distribution $\pi=\left(\pi_S, \pi_D\right)$ and the chain converges to $\pi$ irrespective of the starting state.
Proof.
•Irreducible: nonzero probabilities both ways imply every state is reachable from every other state.
•Aperiodic: with self-loop probabilities $1-p_{S D}>0$ and $1-p_{D S}>0$, the gcd of return cycle lengths is 1.
•Existence/uniqueness of stationary distribution follows from standard Markov chain theory. Solve $\pi=\pi P$ with $\pi_S+\pi_D=1$ to get $\pi_S=p_{D S} /\left(p_{D S}+p_{S D}\right), \pi_D=p_{S D} /\left(p_{D S}+p_{S D}\right)$. Convergence holds by ergodic theorem.
Proposition 3: Convergence of Euler–Maruyama to SDE Strong Solution (for Lipschitz coefficients)
Statement.
Let $d R(t)=a(R, t) d t+b(R, t) d W_t$ with $a, b$ Lipschitz in $R$ and satisfying linear growth. Then the Euler-Maruyama discretisation with step $\Delta t$ converges strongly to the true solution as $\Delta t \rightarrow 0$.
Proof (Sketch).
This is a standard result in numerical SDE theory (Kloeden \& Platen, 1992). Under globally Lipschitz and linear-growth conditions, Euler-Maruyama has strong order 0.5: the mean-square error is $O(\Delta t)$. The proof uses Grönwall's inequality applied to the mean-square difference between numerical and exact solutions. (In implementation, the drift and diffusion terms should be modified near the reflecting boundaries to keep the process within $[0,1]$.)
Proposition 4: Consistency of System GMM under Standard Conditions
Statement.
Under the moment conditions implied by the dynamic panel and assuming no second-order serial correlation in the idiosyncratic errors and valid instruments (lags of the dependent variable and predetermined/strictly exogenous instruments), the System GMM estimator is consistent and asymptotically normal.
Proof (Sketch).
The result follows from Arellano–Bond (1991) and Blundell–Bond (1998): the level equations are instrumented by differences, and the difference equations are instrumented by levels. Validity requires the absence of AR(2) serial correlation in the differenced residuals and a Hansen test that does not reject the instrument set. The number of instruments should remain small relative to the number of cross-sectional units $N$.
Proposition 5: Existence and Uniqueness
Under Assumptions 7–8, the SDE has a unique strong solution and satisfies:
$0 \leq R(t) \leq 1, \forall t$.
Proof (Sketch).
•The Lipschitz condition ensures local existence (Itô theory).
•The linear growth condition yields global existence.
The reflective drift makes the boundaries inaccessible. Thus, the process is well-defined for all time.
To assess the internal consistency and practical relevance of the proposed modelling framework, this section presents a numerical simulation of SME loan repayment dynamics based on theoretically calibrated parameters. The objective is to demonstrate how vaccination progress, government support, and banking interventions jointly shape repayment trajectories over time, rather than to estimate parameters from observed data.
5.1 Simulation design
The simulation integrates the three modelling layers introduced earlier:
•Micro-level dynamic panel repayment evolution
•Discrete repayment state transitions
•Aggregate repayment dynamics in continuous time
A population of $N$ SMEs was simulated over $T$ discrete periods. Each firm was characterised by heterogeneous repayment capacity and evolved according to the dynamic panel equation:
$R_{i, t}=\alpha_i+\rho R_{i, t-1}+\beta_V V_t+\beta_G G_t+\beta_B B_t+\varepsilon_{i, t}, R_{i, t} \in[0,1]$
Firm-specific fixed effects $\alpha_i$ were drawn from a bounded distribution to capture heterogeneity in baseline repayment ability, while idiosyncratic shocks $\varepsilon_{i, t}$ introduced stochastic variation.
5.2 Calibration strategy and assumptions
Given the absence of empirical estimation at this stage, parameters were calibrated according to three principles:
•Signs and magnitudes were chosen to reflect established economic intuition (e.g., higher vaccination and policy support improve repayment capacity).
•Parameters satisfied stationarity and boundedness conditions (e.g., $0<\rho<1$).
•Parameter scales were normalised to allow meaningful comparison across policy scenarios.
Formally, the following conditions were imposed:
$0<\rho<1, \beta_V, \beta_G, \beta_B>0, \sigma_{\varepsilon}^2<\infty$
Aggregate dynamics followed a mean-reverting SDE:
$d R(t)=\kappa(\bar{R}(V(t), G(t), B(t))-R(t)) d t+\sigma(R(t)) d W_t$,
where, $\bar{R}(\cdot)$ represents the policy-dependent long-run repayment benchmark. Reflecting boundaries at $R(t)=0$ and $R(t)=1$ ensured feasibility.
5.3 Simulation parameters and assumptions
The numerical simulations were conducted using theoretically calibrated parameters chosen to satisfy stability, boundedness, and economic plausibility conditions. Repayment persistence was constrained to lie within the unit interval $(0<\rho<1)$, ensuring dynamic stability. Policy effect coefficients were restricted to be strictly positive, reflecting the assumption that higher vaccination rates and stronger policy support improve repayment capacity.
All repayment measures are bounded within the interval [0, 1], with reflecting boundaries imposed in the aggregate dynamics to maintain feasibility. Stochastic shocks are assumed to be mean-zero with finite variance.
Policy scenarios differed only in vaccination rollout speed, government support intensity, and the duration of banking interventions. All other parameters were held constant across scenarios to isolate policy effects.
The main parameter values and simulation settings are reported in Table 2. Parameter values were chosen for illustrative purposes and do not represent empirical estimates.
Table 2. Simulation parameters
|
Parameter |
Description |
Value/ Range |
|
$\rho$ |
Repayment persistence |
0.5 |
|
$\beta_{\mathrm{V}}$ |
Vaccination effect |
0.15 |
|
$\beta_{\mathrm{G}}$ |
Government support effect |
0.12 |
|
$\beta_{\mathrm{B}}$ |
Banking support effect |
0.1 |
|
$\sigma_{\varepsilon}$ |
Firm-level shock Standard Deviation (SD) |
0.03 |
|
$\kappa$ |
Aggregate mean-reversion speed |
0.2 |
|
$\sigma$ |
Aggregate volatility |
0.05 |
|
$N$ |
Number of SMEs |
3,000 |
|
$T$ |
Simulation horizon (periods) |
60 |
5.4 Policy scenario specification
Three illustrative scenarios were considered:
•High-intervention scenario: Rapid vaccination rollout, sustained government support, extended banking moratoria.
•Moderate-intervention scenario: Gradual vaccination, declining fiscal support, partial restructuring.
•Low-intervention scenario: Slow vaccination, early withdrawal of policy measures.
Vaccination trajectories were modelled as logistic growth curves:
$V(t)=\frac{1}{1+e^{-\left(\lambda_0+\lambda_1 t\right)}}$
Government and banking support were modelled as piecewise-constant or smoothly decaying functions over time.
This section interprets the modelling results conceptually and lays the foundation for empirical application.
6.1 Policy channels and parameter interpretation
The effects of vaccination progress, government support, and banking interventions discussed above correspond directly to the sign and magnitude of the policy coefficients in the dynamic panel model (Eqs. (1) and (2)). In particular, positive coefficients on vaccination $\left(\beta_V\right)$, government support ($\beta_G$), and banking support ($\beta_B$) increase contemporaneous repayment performance $R_{i t}$, while the post-pandemic interaction terms ($\delta_V, \delta_G, \delta_B$) capture structural changes in policy effectiveness following COVID-19. A larger $\beta_V$ shifts the conditional mean of $R_{i t}$ upward by improving operational continuity, whereas higher $\beta_G$ and $\beta_B$ relax liquidity and repayment constraints through fiscal and financial channels. Repayment persistence, governed by $\rho$, determines the speed with which these policy-induced improvements propagate over time. A higher $\rho$ implies stronger path dependence and slower adjustment toward the new equilibrium identified in Lemma 1.
6.2 State transitions, recovery, and nonlinear effects
At the meso level, the conceptual discussion of deterioration and recovery maps directly to the transition probability functions in Eqs. (3) and (4). Increases in vaccination, government support, and banking interventions reduce the probability of moving from on-time to delinquent status by lowering the logit index in $p_{S D}$, while simultaneously increasing the recovery probability $p_{D S}$. The nonlinear nature of the logistic link implies threshold behaviour: once the combined policy index $\left(V_t, ~G_t, ~B_t\right)$ crosses a critical level, small additional policy improvements generate disproportionately large reductions in delinquency risk. These threshold effects explain the sharp improvements observed in the high-intervention scenario. These effects are reflected analytically in the stationary distribution of the Markov chain (Lemma 4), where higher $p_{D S}$ and lower $p_{S D}$ increase the long-run proportion of on-time SMEs.
6.3 Aggregate dynamics and stability mechanisms
The macro-level repayment trajectories discussed in the simulation results are governed by the parameters of the SDE in Eqs. (5) and (6). The mean-reversion speed $\kappa$ controls how quickly aggregate repayment $R_t$ converges toward the policy-dependent equilibrium $\mu\left(V_t, ~G_t, ~B_t\right)$, while the diffusion parameter $\sigma$ captures residual uncertainty arising from unobserved shocks. Coordinated policy interventions raise $\mu(\cdot)$, shifting the long-run repayment benchmark upward, whereas weak or withdrawn support lowers $\mu(\cdot)$ and may induce prolonged fragility. The reflective boundary conditions ensure feasibility ($R_t \in[0,1]$) and formalise the stabilising role of policy interventions in preventing systemic collapse or unrealistic overshooting. Together, these parameters explain the observed convergence, volatility reduction, and divergence across policy scenarios.
6.4 Cross-layer consistency
Crucially, the discussion highlights that the same policy variables operate consistently across all model layers. Coefficients $\left(\beta_V, ~\beta_G, ~\beta_B\right)$ determine firm-level responsiveness, transition probability sensitivities shape repayment state dynamics, and the equilibrium function $\mu(\cdot)$ aggregates these effects into macro-level trajectories. This parameter coherence ensures that conceptual interpretations are not ad hoc but arise directly from the mathematical structure of the framework.
Table 3 summarises how the key conceptual insights discussed in this section map directly to specific model parameters and equations across the micro-, meso-, and macro-level components of the framework.
Table 3. Mapping of key discussion insights to model parameters and equations
|
Discussion Insight |
Model Layer |
Key Parameters |
Governing Equations |
Formal Interpretation |
|
Repayment exhibits strong persistence and path dependence |
Micro (Dynamic Panel) |
$\rho$ |
(1), (2) |
Higher ($\rho$) implies slower adjustment and stronger dependence on past repayment performance |
|
Vaccination improves operational continuity and repayment capacity |
Micro / Meso / Macro |
$\beta_V, \delta_V$ |
(1)–(2), (3)–(4), (6) |
Positive coefficients raise firm-level repayment, reduce deterioration probability, and increase long-run equilibrium $(R(\cdot))$ |
|
Government support mitigates liquidity constraints |
Micro / Meso / Macro |
$\beta_G, \delta_G$ |
(1)–(2), (3)–(4), (6) |
Fiscal support shifts repayment distribution upward and increases recovery likelihood |
|
Banking interventions reduce delinquency and promote recovery |
Micro / Meso |
$\beta_B, \delta_B$ |
(1)–(2), (3)–(4) |
Moratoria and restructuring lower transition to delinquency and increase recovery probability |
|
Structural differences exist between pre- and post-pandemic regimes |
Micro |
$\delta_V, ~\delta_G, ~\delta_B$ |
(2) |
Interaction terms capture regime-dependent policy effectiveness |
|
Nonlinear threshold effects in repayment dynamics |
Meso (Markov) |
Logistic slopes in $p_{S D}, p_{D S}$ |
(3), (4) |
Small policy changes near thresholds generate large shifts in transition probabilities |
|
Long-run repayment outcomes depend on coordinated policy |
Macro (SDE) |
$\bar{R}(V, G, B)$ |
(5), (6) |
Joint policy effects determine the steady-state repayment benchmark |
|
Speed of recovery depends on adjustment intensity |
Macro (SDE) |
$\kappa$ |
(6) |
Higher ($\kappa$) leads to faster convergence to equilibrium |
|
Residual uncertainty persists despite policy support |
Macro (SDE) |
$\sigma$ |
(5) |
Captures stochastic shocks not explained by policy variables |
|
System-wide stability is maintained |
Macro (SDE) |
Reflective boundaries |
(5) |
Ensures repayment remains within feasible bounds ([0,1]) |
|
Cross-layer coherence of policy effects |
All layers |
$\beta ,~\delta ,~\bar{R}(\cdot)$ |
(1)–(6) |
Guarantees conceptual interpretations align with mathematical structure |
This section presents numerical simulation results generated from the proposed integrated modelling framework. The purpose of the simulation is not empirical estimation, but rather to illustrate the dynamic implications of the model under theoretically consistent parameterisations and alternative policy scenarios. All simulations were conducted using Monte Carlo techniques, with parameters chosen to satisfy stability and boundedness conditions.
7.1 Baseline simulation
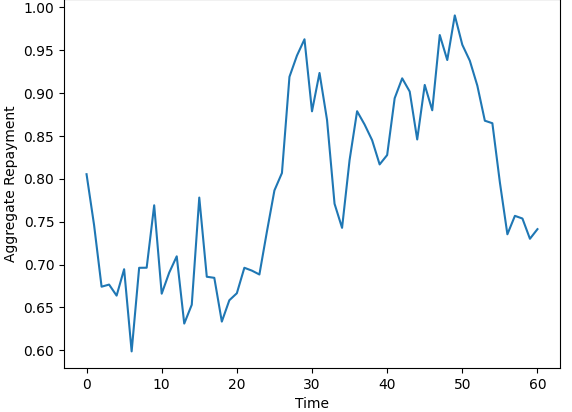
Figure 3 illustrates the simulated trajectory of aggregate SME loan repayment over time under a baseline scenario characterised by gradual vaccination rollout, sustained government support, and temporary banking moratoria. The aggregate repayment measure remained bounded within the unit interval, confirming the feasibility of the model’s structural constraints.
Figure 3. Simulated small and medium enterprise (SME) repayment dynamics
The repayment trajectory exhibited three distinct phases. In the early periods, repayment performance was volatile and relatively subdued, reflecting heightened uncertainty and firm-level shocks following the pandemic onset. In the intermediate phase, aggregate repayment improved substantially as vaccination rates increased and policy support mechanisms mitigated liquidity constraints. In the later periods, aggregate repayment declined from its peak and remained sensitive to stochastic disturbances and the gradual withdrawal of support measures.
These dynamics emerged endogenously from the interaction between micro-level repayment persistence, state transitions between delinquency and recovery, and aggregate mean-reverting behaviour.
7.2 Policy scenario comparison
To assess the role of policy coordination, the model was simulated under two contrasting scenarios defined in Section 5.4:
•High-intervention scenario, characterised by rapid vaccination rollout, sustained government support, and extended banking moratoria.
•Low-intervention scenario, characterised by slower vaccination progress, early withdrawal of fiscal support, and limited banking intervention.
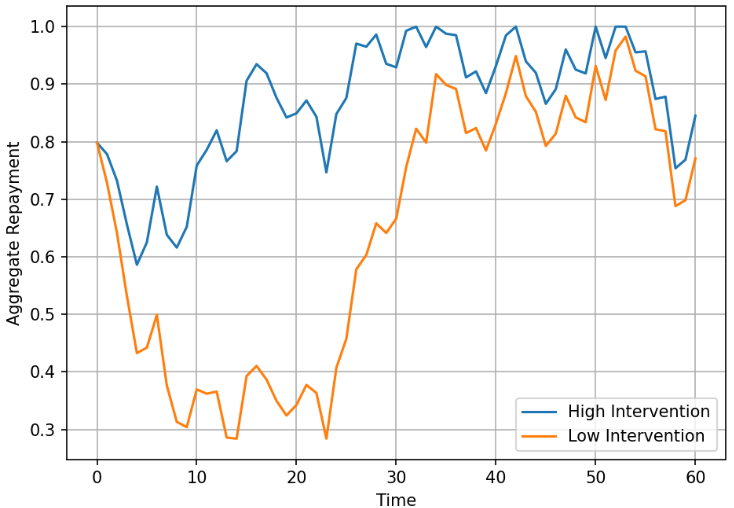
Figure 4. Aggregate small and medium enterprise (SME) loan repayment dynamics under alternative policy scenarios
Figure 4 compares simulated aggregate SME loan repayment trajectories under high- and low-intervention scenarios. The high-intervention scenario combines rapid vaccination rollout, sustained government support, and extended banking moratoria, while the low-intervention scenario reflects slower vaccination progress and early withdrawal of policy support. The results showed faster recovery, higher repayment levels during the early and intermediate periods, and reduced volatility under coordinated policy interventions.
This comparison is consistent with nonlinear and complementary effects of public health measures, fiscal policy, and banking sector interventions. Improvements in repayment performance appear to arise not from any single policy instrument in isolation, but from their coordinated implementation over time.
7.3 Monte Carlo robustness
To assess the robustness of the simulated dynamics, the baseline scenario was replicated across multiple Monte Carlo runs with independent stochastic shocks. Figure 5 presents Monte Carlo simulation results for aggregate SME loan repayment under the baseline scenario. The solid line represents the median repayment path across simulations, while the shaded regions denote the 25–75 and 5–95 percentile bands. Although individual realisations varied due to stochastic shocks, the overall repayment dynamics remained robust, exhibiting convergence and stabilisation over time.
Figure 5. Monte Carlo uncertainty bands for aggregate small and medium enterprise (SME) repayment dynamics
The results indicate that the qualitative features of the repayment dynamics (early volatility, mid-period recovery, and later stabilisation) remained consistent across simulations. The narrowing of the interquartile range over time indicates convergence of repayment dynamics as policy effects accumulate. This robustness suggests that the observed patterns are structural properties of the model rather than artefacts of a particular random realisation.
Taken together, Figures 4 and 5 show that the qualitative features of the simulated repayment dynamics are robust to alternative policy configurations and stochastic variation. The persistence of recovery patterns across Monte Carlo replications indicates that the observed dynamics arise from the structural properties of the proposed framework rather than from specific random realisations or parameter choices.
This study develops and applies an integrated simulation framework to examine how vaccination progress, government support, and banking sector interventions jointly shape SME loan repayment dynamics during crisis and recovery periods. By combining micro-level repayment persistence, discrete repayment state transitions, and aggregate stochastic adjustment within a unified architecture, the framework captures nonlinear and path-dependent repayment behaviour that cannot be adequately represented by static or single-layer models.
Three main findings follow. First, SME repayment dynamics are strongly path-dependent, implying that early shocks and early interventions have persistent effects. Second, within the simulated scenarios, policy impacts appear nonlinear and complementary: vaccination progress, government support, and banking interventions interact to reduce delinquency risk and accelerate recovery, with coordinated responses producing substantially more stable outcomes than the low-intervention scenario. Third, the simulation results confirm the internal consistency of the framework by showing how micro-level behavioural responses and state transitions propagate into distinct aggregate repayment trajectories under alternative policy scenarios.
The analysis is intentionally modelling- and simulation-focused. Parameters are theoretically calibrated rather than empirically estimated, and repayment outcomes are represented using a simplified two-state structure to preserve analytical clarity. As such, the results should be interpreted as illustrative rather than predictive. Future research may extend the framework through empirical calibration using survey and administrative loan data, as well as by incorporating sectoral differentiation and endogenous policy responses.
Overall, the paper contributes a computational foundation for analysing SME loan repayment under systemic shocks, offering a flexible tool for scenario-based policy evaluation and a platform for subsequent empirical investigation.
This work is supported by the Universiti Malaysia Terengganu under the Matching Grant Scheme (Ref: MG/53588).
[1] Caglio, C.R., Darst, R.M., Kalemli-Özcan, Ṣ. (2021). Collateral heterogeneity and monetary policy transmission: Evidence from loans to SMEs and large firms. National Bureau of Economic Research. https://doi.org/10.3386/w28685
[2] Aristei, D., Angori, G. (2022). Heterogeneity and state dependence in firms’ access to bank credit. Small Business Economics, 59: 47-78. https://doi.org/10.1007/s11187-021-00545-x
[3] Ghulam, Y., Hakro, A.N., Naumani, O. (2025). SMEs’ access to bank financing during the financial crises in Europe. Journal of Small Business Strategy, 35(1): 74-96. https://doi.org/10.53703/001c.124820
[4] Berrospide, J.M., Gupta, A., Seay, M.P. (2024). The usability of bank capital buffers and credit supply shocks at SMEs during the pandemic. International Journal of Central Banking, 20(3): 185-255.
[5] Ferrando, A., Pál, R. (2024). Do financing conditions pose a threat to the performance and transformation of SMEs? EIB Working Papers. https://doi.org/10.2867/1358340
[6] Payne, J. (2021). An assessment of the UK restructuring moratorium. Lloyd's Maritime and Commercial Law Quarterly, 454-475. https://doi.org/10.2139/ssrn.3759730
[7] Dimri, A. (2025). Non-Performing Loans. A Cross Country Comparison of Regulatory and Policy Responses. Springer Cham. https://doi.org/10.1007/978-3-031-92952-6
[8] Yoganandham, G., Kabeer, C.S.A., Kalaivani, M., Usha, G. (2024). Economic impacts of Covid-19 vaccination campaigns in India-A comprehensive analysis. The Seybold Report, 963-974.
[9] Verelst, F., Beutels, P., Hens, N., Willem, L. (2021). Workplace influenza vaccination to reduce employee absenteeism: An economic analysis from the employers’ perspective. Vaccine, 39(14): 2005-2015. https://doi.org/10.1016/j.vaccine.2021.02.020
[10] Kaya, O. (2024). The impact of late payments on SMEs’ access to finance: Evidence from credit rationing and loan terms. Economic Modelling, 141: 106896. https://doi.org/10.1016/j.econmod.2024.106896
[11] Barboni, G., Cárdenas, J.C., de Roux, N. (2022). Behavioral messages and debt repayment. Documento CEDE No. 22. https://doi.org/10.2139/ssrn.4156675
[12] Kaya, O. (2022). Determinants and consequences of SME insolvency risk during the pandemic. Economic Modelling, 115: 105958. https://doi.org/10.1016/j.econmod.2022.105958
[13] Arcuri, M.C., Pisani, R. (2024). Access to external credit during COVID-19: Evidence from green SMEs in Italy. Review of Managerial Science, 18: 1-30. https://doi.org/10.1007/s11846-023-00654-9
[14] Aristei, D., Angori, G. (2022). Heterogeneity and state dependence in firms’ access to bank credit. Small Business Economics, 59: 47-78. https://doi.org/10.1007/s11187-021-00545-x
[15] Reyad, H.M., Zariyawati, M.A., Ong, T.S., Muhamad, H. (2022). The impact of macroeconomic risk factors, the adoption of financial derivatives on working capital management, and firm performance. Sustainability, 14(21): 14447. https://doi.org/10.3390/su142114447
[16] Casey, A.J. (2021). Bankruptcy & bailouts, subsidies & stimulus: The government toolset for responding to market distress. University of Chicago Legal Forum, 63-91. https://doi.org/10.2139/ssrn.3783422
[17] Bowman, J. (2024). The working dead: The dynamics, causes and consequences of zombie businesses. https://doi.org/10.25911/R2PJ-FF97
[18] Pelosi, M., Rodano, G., Sette, E. (2021). Zombie firms and the take-up of support measures during Covid-19. Bank of Italy Occasional Paper No. 650. https://doi.org/10.2139/ssrn.4032687
[19] Soremekun, Y.M., Udeh, C.A., Oyegbade, I.K., Igwe, A.N., Ofodile, O.C. (2024). Strategic conceptual framework for SME lending: Balancing risk mitigation and economic development. International Journal of Multidisciplinary Research and Growth Evaluation, 5(1): 1056-1063. https://doi.org/10.54660/.IJMRGE.2024.5.5.1053-1060
[20] Ogunmokun, O.C., Mafimisebi, O., Obembe, D. (2024). Bank lending behaviour and small enterprise debt financing. Journal of Entrepreneurship in Emerging Economies, 16(3): 675-697. https://doi.org/10.1108/JEEE-02-2022-0043
[21] Araujo, J.D., Garrido, J.M., Kopp, E., Varghese, R., Yao, W. (2022). Policy options for supporting and restructuring firms hit by the COVID-19 crisis. International Monetary Fund, 2022(002). https://doi.org/10.5089/9781513593463.087
[22] Chen, Q., Wheeler, C. (2022). Forecasting non-performing retail loans during the Covid-19 pandemic: The effect of forbearance on model error. Available at SSRN 4120046. https://doi.org/10.2139/ssrn.4120046
[23] Hlawiczka, R., Tung, H.T. (2024). Qualitative changes in commercial banking in the context of the impact of the COVID-19 pandemic. Ekonomicko-Manazerske Spektrum, 18(1): 102-120. https://doi.org/10.26552/ems.2024.1.102-120
[24] Olivieri, S., Ortega, F., Rivadeneira, A. (2024). COVID-19 vaccination and economic recovery in Latin America: Evidence from the 2021 HFPS. Economía LACEA Journal, 23(1): 259-282. https://doi.org/10.31389/eco.402
[25] Mosbah, E.B., Dharmapala, P.S. (2022). Evaluating the effects of COVID-19 and vaccination on employment behaviour: A panel data analysis across the world. Sustainability, 14(15): 9675. https://doi.org/10.3390/su14159675
[26] Abdul Wahab, H., Abdul Rahim, A., Abdullah, N.A. (2023). Safeguarding the rights and welfare of the health-care workers amid the pandemic: A social protection approach. International Journal of Human Rights in Healthcare, 16(3): 264-276. https://doi.org/10.1108/IJHRH-05-2021-0120
[27] Abugamza, A., Kaskirbayeva, D., Charlwood, A., Nikolova, S., Martin, A. (2024). Impact of the COVID-19 pandemic on employment and inequalities: A systematic review of international evidence and critical appraisal of statistical methods. Perspectives in Public Health, 13: 17579139241231910. https://doi.org/10.1177/17579139241231910
[28] Cincotti, S., Raberto, M., Teglio, A. (2022). Why do we need agent-based macroeconomics? Review of Evolutionary Political Economy, 3: 5-29. https://doi.org/10.1007/s43253-022-00071-w
[29] Axtell, R.L., Farmer, J.D. (2025). Agent-based modeling in economics and finance: Past, present, and future. Journal of Economic Literature, 63(1): 197-287. https://doi.org/10.1257/jel.20221319
[30] Hommes, C.H., Poledna, S. (2023). Analyzing and forecasting economic crises with an agent-based model of the euro area. Available at SSRN 4381261. https://doi.org/10.2139/ssrn.4381261
[31] Pangallo, M., del Rio-Chanona, R.M. (2024). Data-driven economic agent-based models. arXiv preprint arXiv:2412.16591. https://doi.org/10.48550/arXiv.2412.16591
[32] Tunas, I.G., Harsanto, P., Arafat, Y. (2024). Flood mitigation scenario using structural equation modelling (SEM) based on public participation and local wisdom. Mathematical Modelling of Engineering Problems, 11(12): 3209-3220. https://doi.org/10.18280/mmep.111201
[33] Fathy, M., Tarek, H. (2025). Exploration of lag structures, hysteresis effects, and the long-term health consequences of sustained macroeconomic adversity. Journal of Data Science, Predictive Analytics, and Big Data Applications, 10(3): 1-15.
[34] Chamboko, R., Bravo, J.M. (2020). A multi-state approach to modelling intermediate events and multiple mortgage loan outcomes. Risks, 8(2): 64. https://doi.org/10.3390/risks8020064
[35] Dang, N. (2025). Modeling of transmission mechanisms linking macroeconomic fluctuations interface with public health system functioning. Advances in Computational Social Behavior and Simulation Studies, 15(1): 1-20. https://heisenpub.com/index.php/ACSBSS/article/view/2025-01-04.