
Ali S. Noori | Raed K. Mohammed | Omar Mohammed Rashid | Kadhim K. Resan | Mohammed Ali Abdulrehman*
© 2026 The authors. This article is published by IIETA and is licensed under the CC BY 4.0 license (http://creativecommons.org/licenses/by/4.0/).
OPEN ACCESS
Rapid paper waste accumulation and the depletion of raw materials have led to the creation of sustainable recycling techniques. However, paper waste is known to be mechanically inferior to natural fibers because of fiber degradation during repetitive recycling processes. This work aims to study the properties of reinforced recycled paper by incorporating cornstarch, cotton mesh, and 3D-printed polylactic acid-carbon fiber (PLA-CF) mesh. Five groups were produced: recycled paper was used as a control, whereas the other samples included recycled paper reinforced with cornstarch, fine and coarse cotton mesh, and PLA-CF mesh. The mechanical and surface properties were evaluated using tensile strength, Taber stiffness, contact angle, water absorption, density, elongation at break, and Young’s modulus. In addition, scanning electron microscopy was performed to investigate the properties of the obtained samples and the underlying mechanisms of the reinforcement. It was found that all reinforcement systems positively affected the recycled paper performance. Specifically, the best performance among mechanical parameters, such as tensile strength (12.6 MPa) and Young's modulus (640 MPa), was provided by coarse cotton mesh and PLA-CF mesh, respectively. The Taber stiffness was measured as 61 mN·m for the PLA-CF reinforcement, whereas a maximum contact angle of 68° was observed for PLA-CF. Simultaneously, an increase in water absorption was achieved owing to the hydrophilic characteristics of the cotton mesh.
recycled paper, polylactic acid-carbon fiber, fused deposition modeling, 3D printing, cotton mesh, bio-based composites, surface wettability
Environmental problems, such as deforestation, energy use, greenhouse gas emissions, and solid waste generation, have been created owing to the constant rise in paper usage worldwide [1]. Paper recycling has proven to be an efficient solution for minimizing environmental pollution and saving natural resources. Recycling leads to a reduction in the amount of waste in landfills, lower energy and water consumption, and conservation of forestry resources, as revealed by Monte et al. [1].
Although recycled paper material is environmentally friendly, it typically exhibits mechanical degradation compared to paper produced using new materials. Multiple processing cycles tend to shorten the length of cellulose fibers and degrade the efficiency of hydrogen bonding between the fibers, resulting in lower tensile strength, stiffness, and durability [2, 3]. As reported by Hubbe et al. [2], one of the major factors causing the mechanical degradation of recycled fibers is hornification, which is the irreversible stiffening of cells during drying. In addition, the researchers stated that typical laboratory tensile strength values of recycled papers are between 3-5 MPa. Čabalová et al. [4] also confirmed the effect of multiple recycling cycles on the decreasing capability of cellulose fibers to form strong bonds. Hubbe and Gill [3] and Vishtal and Retulainen [5] provided further insights into the influence of fiber packing, filler dispersion, and bonding efficiency on paper strength. Consequently, the enhancement of the properties of recycled paper through different techniques has become a popular direction of study.
A number of reinforcing strategies have been developed to improve the strength of recycled paper materials, including the utilization of natural fibers, starches, nanomaterials, and synthetic polymers [6-9]. Natural cotton fibers represent an ideal reinforcing material owing to their hydrophilicity and similarity to cellulose [10, 11]. The architecture of the mesh formed by cotton fibers allows the transfer of loads over a larger area and reduces cracking of the paper matrix, as discussed in the natural fiber composite reviews by Faruk et al. [11] and Pickering et al. [12].
Recently, various forms of additive manufacturing processes, such as fused deposition modeling (FDM), have been increasingly gaining recognition in sustainable material development [13-15]. Polylactic acid (PLA) is one of the most common bio-derived thermoplastics used as a raw material for FDM printing because of its minimal effect on the environment, renewability, and good mechanical properties [16, 17]. The composite obtained from the mixture of polylactic acid and carbon fibers is partially bio-derived, meaning that polylactic acid acts as a bio-derived matrix and carbon fibers act as fossil-based reinforcements. Using a polylactic acid-carbon fiber (PLA-CF) mesh structure in3D printing can help produce a paper composite with improved properties [18].
While a number of studies have been conducted to examine the impact of starch modifiers, natural fibers, and nanocellulosic compounds to enhance the performance of recycled paper products, no significant focus has been directed toward employing continuous reinforcement schemes for the improvement of their performance characteristics. Specifically, no study has ever attempted the use of 3D-printed PLA-carbon fiber mesh architecture as reinforcement elements in recycled papers. In most cases, past research has relied on either randomly distributed fiber systems or surface modification techniques that lack control over the load transmission and reinforcement capacity. Moreover, there have been few comparative studies comparing natural fibrous reinforcement systems with additive manufacturing-based polymeric mesh architectures under the same fabrication conditions. The idea of using a continuously structured 3D-printed mesh as a reinforcing phase in a relatively weak matrix has recently become more popular in related research. Zeng et al. [19] and Cai et al. [20], in particular, proved that a reinforcing phase of FRP grids introduced during the process may enhance the flexural properties of 3D-printed cementitious plates, and 3D-printed constructs obtained from a waste-paper-based feedstock may exhibit acceptable mechanical performance and thermal stability, respectively. These investigations validated the use of structured reinforcing phases but did not use recycled paper as a matrix material, which makes the current investigation more relevant. Thus, it is necessary to conduct a comprehensive study on the mechanical, physical, and surface characteristics of recycled paper containing both natural fiber reinforcements and 3D-printed mesh reinforcements.
Hence, the objective of this research is to study the effects of using cornstarch, cotton mesh, and 3D-printed PLA-CF mesh structures on improving the mechanical properties and surface characteristics of recycled paper composites. This research project stands out in that there will be a comparison between a natural fiber material and a 3D-printed polymer mesh incorporated in recycled paper. The properties tested included tensile strength, stiffness, wettability, water absorption, density, elongation, and Young’s modulus, while scanning electron microscopy (SEM) was used to understand the mechanics behind the reinforcement of the matrix.
The key novel contributions of this research can be outlined as follows:
•Development of the first technique to utilize 3D-printed PLA-carbon fiber mesh as reinforcement for recycled paper, replacing common techniques that use randomly distributed fibers or surface coatings.
•Comparison of the effect of natural fiber reinforcement (cotton mesh) versus additive manufacturing-reinforced polymer mesh (PLA-CF) in recycled paper under identical conditions.
•Analysis of mechanical, morphological, and surface properties, accompanied by statistical significance testing (Section 3), to discern the impact of the type of reinforcement from that of the geometry of the reinforcement on the final properties.
2.1 Materials
Office waste paper was sourced and used as the raw material for making recycled paper. Cornstarch was employed as a binding agent to improve the cellulose fiber bond strength. Both fine and coarse cotton meshes were used as reinforcing agents. Thread diameter of 0.8 mm, a 0.3 mm thread diameter, and areal density (grams per square meter (GSM)) of 45 g/m². The coarse mesh had a mesh opening of 2.5 mm, a thread diameter of 0.5 mm, and a GSM of 80 g/m² (Table 1). A semi-bio-based filament made up of a PLA-carbon fiber composite (eSUN PLA-CF, 1.75 mm diameter and 1.21 g/cm³ density) was utilized for forming the reinforcement meshes using the FDM 3D printing technique; the PLA is derived from bio-sources, while the carbon fiber is not. A hard steel tip was used for the entire process to avoid carbon fiber abrasion.
Table 1. Physical characteristics of fine and coarse cotton mesh reinforcements
|
Property |
Fine Cotton Mesh |
Coarse Cotton Mesh |
|
Mesh aperture (mm) |
0.8 |
2.5 |
|
Thread diameter (mm) |
0.3 |
0.5 |
|
Areal density GSM (g/m²) |
45 |
80 |
|
Weave type |
Plain weave |
Plain weave |
Recycling of the paper pulp was performed in the following steps. First, the paper waste was shredded into small fragments and soaked in water for three hours. Subsequently, the soaked waste was ground into a homogeneous slurry for 10 min. A sieving process was conducted to filter the slurry. The slurry was poured onto a cloth and dried in a well-ventilated oven at 70 ℃ until a constant weight was attained, indicating complete drying.
2.2 Sample preparation and polylactic acid-carbon fiber mesh fabrication
The preparation methods for the five groups are presented in Table 2. In Groups C and D, the layers of cotton mesh were sandwiched between two layers of pulp. In contrast, in Group E, a PLA-CF mesh fabricated using FDM with a thickness of 1 mm was placed between the two layers of pulp.
Table 2. Sample groups and their compositions
|
Group |
Composition |
|
A |
Pure recycled paper pulp |
|
B |
Recycled paper pulp + Cornstarch |
|
C |
Recycled paper pulp + Fine cotton mesh |
|
D |
Recycled paper pulp + Coarse cotton mesh |
|
E |
Recycled paper pulp + 3D-printed PLA-CF mesh |
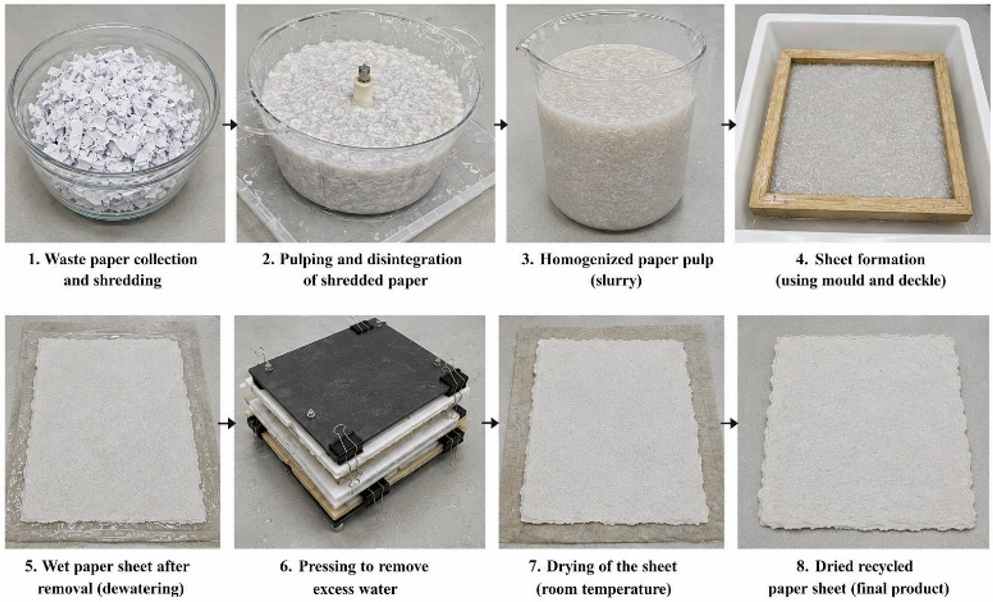
The PLA mesh structures were modeled using SolidWorks 2022 (Dassault Systèmes, France) and printed using an FDM 3D printer called Creality Ender-3 V2 (Creality, China). A composite filament made of PLA and carbon fiber material (manufacturer: eSUN PLA-CF; diameter: 1.75 mm) was chosen for its stiffness and dimensional stability. Printing was performed using Ultimaker Cura 5.3 (Table 3). It is known that the behavior of composite materials obtained by the FDM process is highly dependent on both the printing conditions and properties of the filament used [21]. The overall procedure used to produce recycled paper sheets from waste office paper is illustrated in Figure 1.
Observation: The value of the reinforcement fraction in Group B (cornstarch) is stated in mass percent in relation to the dry pulp, whereas in Groups C, D, and E, it is stated as an approximate cross-sectional area fraction of the mesh reinforcement. These are the different units of measurement. In order to establish the comparability of these two reinforcement systems, the fraction of cornstarch mass was converted to an estimate of the fraction of its volume under the assumption of equal true density of 1.5 g/cm³ for both starch and cellulose fibers (values commonly cited in the literature for these two materials):
Vstarch = (mstarch/ρstarch)/[(mstarch/ρstarch) + (mpulp/ρpulp)] × 100 ≈ 5 vol%, which is nearly identical to its mass-fraction value because the two densities are similar. This shows that the cornstarch content (5 vol%, dispersed within an inter-fiber layer) is indeed substantially smaller than the mesh reinforcement content (18–22 area%, discrete layer), and therefore these two reinforcements can only be compared in terms of their different kinds of content; this is done by using the subscript “Group B” for all mass fractions (Groups C-E for areas).
Figure 1. Recycling process of recycled paper sheets made from office waste papers: (1) collection and tearing of waste paper, (2) pulping and disintegration of the waste paper, (3) homogeneous paper slurry preparation, (4) paper sheet formation by means of mold and deckle, (5) dewatering of the wet paper sheet, (6) excess water elimination through pressing, (7) sheet drying, and (8) recycled paper sheet production
Table 3. Fused deposition modeling (FDM) printing parameters used for polylactic acid-carbon fiber (PLA-CF) mesh fabrication
|
Parameter |
Value |
|
Nozzle Temperature |
210 ℃ |
|
Bed Temperature |
60 ℃ |
|
Printing Speed |
50 mm/s |
|
Layer Height |
0.2 mm |
|
Nozzle Diameter |
0.4 mm (hardened steel) |
|
Infill Density |
100% |
|
Raster Angle |
0°/90° alternating |
|
Line Width |
0.4 mm |
|
Mesh Thickness |
1.0 mm |
2.3 Characterization methods
For each property, three samples were analyzed, and the data are presented as the mean ± standard deviation (SD) (with such a small sample size of n = 3 considered a limitation of the exploratory study). The tensile strength, elongation at break, and Young’s modulus were determined in the same test based on ASTM D828-22 [22], where tensile tests were performed at a rate of 25 mm/min using specimens that were 200 mm long (100 mm gauge length) and 25 mm wide. This test was conducted on a universal testing machine after 24-hour conditioning of samples at 23 ± 1 ℃ and 50 ± 2% relative humidity. Both reducing the gauge length and fixing the crosshead speed are considered limitations of the study methods compared to the original gauge length of 180 ± 5 mm and proportionally scaled crosshead speed. The specimen thickness was calculated based on five readings, with one micrometer per specimen (Table 4). As the tensile strength (MPa) and Young’s modulus (MPa) have been determined on the basis of force divided by the actual cross-sectional area (product of width × measured thickness), the values already account for the effect of difference in thickness in the two sets of specimens (0.85–1.20 mm, Table 4), and hence the differences seen here represent change in material properties rather than a geometric artifact. The Taber stiffness, on the other hand, is a geometric property that increases as the cube of the thickness for a homogeneous plate under bending conditions, and thus some of the rise in stiffness due to reinforcement is geometric in nature; this is handled quantitatively in Section 3.2.
Table 4. Specimen thickness and reinforcement area fraction per group
|
Group |
Mean Thickness (mm) |
Reinforcement Fraction (area% or mass%) |
|
A — Pure Recycled Paper |
0.85 ± 0.05 |
0 |
|
B — Cornstarch |
0.88 ± 0.06 |
~5% (by mass, not area fraction — see note below) |
|
C — Fine Cotton Mesh |
1.10 ± 0.07 |
~18 |
|
D — Coarse Cotton Mesh |
1.15 ± 0.08 |
~22 |
|
E — PLA-CF Mesh |
1.20 ± 0.06 |
~20 |
The in-plane bending resistance of the sheets was determined using the Taber testing method (TAPPI T 489), where the bending moments required to produce a 15° deflection of a 38 mm specimen were reported in g·cm and then converted to mN·m (1 g·cm–0.098 mN·m). Wetting ability was measured using the contact angle goniometry technique, where water droplets were applied on the sheet surfaces, with angles less than 90° indicating hydrophilic character and those larger than 90° indicating hydrophobic character [23]. The apparent density was calculated as the weight-to-volume ratio (ρ = m/V).
The water uptake was determined after immersing the specimen in distilled water for 24 h using Equation 1. The elongation at failure and modulus of elasticity were calculated from the tensile results using Equations 2 and 3, respectively, where the modulus was determined by taking the slope of the linear region of the stress-strain graph (0.1%–0.3% strain).
Water Absorption (%) = [(W2 − W1) / W1] × 100 (1)
where, W₁ is the initial dry weight and W₂ is the weight after immersion.
Elongation (%) = [(Lf − L0) / L0] × 100 (2)
where, L₀ is the original length, and Lf is the final length after fracture.
E = Δσ / Δε (3)
where, E is the Young’s modulus, σ is the stress, and ε is the strain.
The properties of all five groups of composites are summarized in Table 5 and serve as a starting point for discussing the results presented in the following sections. All values are expressed as the mean ± standard deviation for three specimens per group (n=3). As the sample size was considered exploratory, no formal hypothesis testing was performed on the observed tendencies. However, to compensate for this weakness, a one-way ANOVA accompanied by Tukey’s honestly significant difference (HSD) post hoc test (α = 0.05) was also conducted for each property using directly calculated replicate data (n = 3 samples per group; raw data can be obtained upon request). For all seven properties, the effect of the group was found to be statistically significant (F(4,10) = 19.2 – 649.9, p ≤ 1.1 × 10⁻⁴), while the values of the Tukey HSD tests are presented as letter superscripts in Table 5, where the groups that share a letter are not significantly different from each other at the 5% level. Despite the low number of samples per group, which requires careful interpretation of the results (see Section 3.10), these results provide statistical proof for the trends presented below. The properties are discussed individually in the following sections according to the reinforcement mechanism responsible for the differences between the five studied groups (unreinforced Group A, starch paste-reinforced Group B, cotton mesh-reinforced Groups C and D, and PLA-CF mesh-reinforced Group E).
Table 5. Summary of all measured mechanical, surface, and physical properties across the five composite groups (mean ± standard deviation, n = 3)
|
Group |
Tensile Strength (MPa) |
Taber Stiffness (mN·m) |
Contact Angle (°) |
Water Absorption (%) |
Density (g/cm³) |
Elongation (%) |
Young’s Modulus (MPa) |
|
A — Pure Recycled Paper |
4.2 ± 0.3a |
18 ± 2a |
31 ± 2.1b |
82 ± 4b |
0.68 ± 0.02a |
1.8 ± 0.2a |
220 ± 15a |
|
B — Cornstarch |
5.8 ± 0.4b |
24 ± 3a |
38 ± 2.4c |
74 ± 3b |
0.71 ± 0.03a |
2.1 ± 0.2a |
290 ± 18b |
|
C — Fine Cotton Mesh |
8.9 ± 0.5c |
38 ± 4b |
27 ± 1.8a |
91 ± 5c |
0.74 ± 0.02a |
3.4 ± 0.3b |
410 ± 20c |
|
D — Coarse Cotton Mesh |
12.6 ± 0.7d |
52 ± 5c |
22 ± 1.5a |
98 ± 6c |
0.77 ± 0.03b |
4.8 ± 0.4c |
580 ± 25d |
|
E — PLA-CF Mesh |
11.4 ± 0.6d |
61 ± 4c |
68 ± 3.2d |
49 ± 3a |
0.83 ± 0.02b |
3.1 ± 0.3b |
640 ± 30e |
Note: Letters in superscript indicate Tukey honestly significant difference (HSD) group designations (α = 0.05) calculated based on the data of individual replicates (n = 3 per treatment); different letters within a column indicate a significant difference between groups (p < 0.05), polylactic acid-carbon fiber (PLA-CF).
3.1 Tensile strength
The results for the tensile strength of all groups are shown in Table 5. The current study needs to be treated as preliminary and exploratory. With regard to the very small sample size of n = 3 per group, the values of standard deviations need to be interpreted with great caution; the observed trends are correct but have not been statistically tested. All samples experienced a positive effect on the tensile strength with the inclusion of reinforcing agents. Group D had the best value of tensile strength because of effective stress transfer and mechanical bonding between coarse cotton fibers and the cellulose matrix, which resulted in approximately doubling the strength compared with control Group A (4.2 ± 0.3 MPa). As noted earlier, this result is in accordance with previous reports on enhanced load-carrying capability owing to the use of structural reinforcement agents [6, 7]. The mesh reinforcement of PLA-CF (Group E) provided a significant improvement because of its rigid structural properties. The better tensile strength in Group D compared to that in Group E proves that the plasticity and bridging properties (which are characteristic of cotton fiber reinforcement) are decisive in determining the tensile characteristics, as discussed in Section 3.7.
3.2 Taber bending stiffness
The Taber stiffness values showed an increasing trend as more reinforcement was added, as listed in Table 5. The stiffness obtained for the PLA-CF reinforced mesh (61 ± 4 mN·m) was higher than that for the coarse cotton mesh (52 ± 5), fine cotton mesh (38 ± 4), cornstarch (24 ± 3), and control without reinforcement (18 ± 2). These results agree with the findings of the tensile modulus in section 3.7, showing that PLA-CF exhibits the maximum stiffness among the tested materials. Cornstarch (Group B) serves only as a binder material and not as a reinforcing material because it only binds fibers together; hence, the low increase in stiffness values from 18 to 24 mN·m. Because the stiffness in the Taber test is proportional to the cube thickness (D $\propto$ E·t³) for a homogeneous plate under bending conditions, there should be some geometric effect behind this relationship. Normalizing the results of the Taber test by dividing them by t³ (according to the data provided in Table 4) results in approximate normalized stiffness factors of 29.3 (A), 35.2 (B), 28.5 (C), 34.2 (D), and 35.3 (E) mN·m/mm³. This means that samples B, D, and E have an increased stiffness compared to samples A and C, not because of the geometric factor, but because of the real increased stiffness, whereas coarse cotton mesh (D) has some advantage due to its increased thickness compared to fine mesh (C).
3.3 Contact angle
From the obtained contact angle values, different wettability behaviors were observed for the reinforcing materials. As illustrated in Table 5, the PLA-CF reinforcement (Group E) yielded a maximum contact angle of 68° ± 3.2°, which was higher than those of the other groups. In particular, it should be mentioned that in accordance with the classification of Law [23], a contact angle of less than 90° is considered within the hydrophilic range. Thus, the surface of PLA composite material can be referred to as "reduced wettability" in relation to the others, but it is hydrophilic from the standpoint of science (contact angle < 90°); hydrophobic behavior requires a contact angle above 90°, which was not reached in any group under study. In this regard, a value of 68° should not be considered hydrophobic behavior. This is explained by the fact that the obtained results correspond to the surface of a hybrid interface between cellulose and PLA; therefore, owing to the presence of partially exposed hydrophilic cellulose fibers, the contact angle in question is significantly lower than the corresponding values for dense and consolidated PLA (more than 80–90°) [8]. Simultaneously, the decrease in the contact angle to 27 ± 1.8° (Group C) and 22 ± 1.5° (Group D) can be attributed to the hydrophilic properties of the cellulose fibers [16].
3.4 Water absorption
The results of the water absorption of the composite material are provided in Table 5. The lowest water absorption values were achieved with the use of PLA-CF reinforcement (49 ± 3%). As mentioned above, the surface of the composite was considered hydrophilic (contact angle = 68° < 90°, Section 3.3); thus, the observed effect could not result from the mechanism of water repulsion. Instead, it resulted from the mechanical blockage of capillary water paths caused by the continuous reinforcing network created by PLA-CF. In an order-of-magnitude calculation (without the ability to directly measure porosity via porosimetry at this stage), a relative porosity index was estimated using the measured densities (Table 5) and the theoretically estimated void-free density of a mixture using the “rule of mixtures,” assuming cellulose/cotton at ≈1.5 g/cm³ and the PLA-CF filament at 1.21 g/cm³ (Section 2.1), based on the respective area fractions in Table 4. The resulting porosities were thus estimated to be ≈55% (A), ≈53% (B), ≈51% (C), ≈49% (D), and ≈42% (E), indicating a consistent reduction in the estimated porosity from the unreinforced control to the PLA-CF sample. While this result is qualitatively consistent with, and quantitatively supports, the proposed mechanism, it should be noted that this is an indirect, order-of-magnitude estimate (not direct porosimetry) and should not substitute for the latter for verification of this hypothesis, which is recommended in future research. Although direct measurement of the porosity would be more accurate and preferable (such as mercury intrusion or X-ray micro-computed tomography porosimetry), it was not available during this preliminary investigation and was therefore omitted. The insignificant drop in water absorption for the composites with added cornstarch (group B) was due to an improvement in inter-fiber binding and partial blockage of the pore space. In contrast, cotton fiber reinforcements (groups C and D) exhibited higher water absorption than the control sample (group A) (82 ± 4%). The water absorption reached 91 ± 5% and 98 ± 6% for groups C and D, respectively. This phenomenon can be explained by the inherent properties of cotton cellulose fibers (hydrophilicity and water retention ability). It should be noted that the results obtained for groups C and D refer to water absorption by the entire composite sample; as partial encapsulation of the cotton mesh occurred in the process of fabrication in the pulp matrix, the amount of absorbed water was significantly higher for the pure cotton sample [24].
3.5 Density
The density values increased with the inclusion of reinforcements, as illustrated in Table 5. The PLA-CF reinforced composite obtained the greatest apparent density of 0.83 ± 0.02 g/cm³ among all samples tested. The PLA-CF filament density is estimated at 1.21 g/cm³ (eSUN). However, the actual density of the composites is less than that of the PLA-CF filament because cellulose constitutes the major part of the structure, with only 20% occupied by the PLA-CF filament mesh per cross-section. Even though there was an increase in specimen thickness with reinforcement inclusion (Group A: 0.85 mm; Group E: 1.20 mm), the gains in stiffness and tensile strength were far beyond those resulting from the increases in specimen thickness alone. They demonstrated the actual influence of the reinforcements on the mechanical properties of the composites. Density does not seem to be the reason for the increase in elastic stiffness (Section 3.7). The architectural design of reinforcements, quality of interfaces, and effectiveness of stress-transfer methods are other determining factors for the obtained values.
3.6 Elongation at break
Mesh reinforcement with cotton increased the ductility, which resulted in maximum elongation, as shown in Table 5. The coarse cotton mesh exhibited the highest elongation value at 4.8 ± 0.4%, while the fine cotton mesh elongated by 3.4 ± 0.3%. Elongation for PLA-CF was 3.1 ± 0.3%, indicating its semi-rigid nature. The higher elongation of the cotton mesh specimens compared to that of PLA-CF could be attributed to the principles outlined in Section 3.7.
3.7 Young’s modulus
The values of Young’s modulus are displayed in Table 5. The maximum value of Young’s modulus was attained in the PLA-CF reinforcement, amounting to 640 ± 30 MPa. In addition, the coarse cotton mesh demonstrated good results, exhibiting an increased Young’s modulus (580 ± 25 MPa). The ranks of the two parameters considered, Young's modulus and Taber stiffness, are identical in all five groups; however, this does not mean that Young's modulus and Taber stiffness are equivalent since the first one is the intrinsic property of material stiffness regardless of its geometry, whereas the second parameter is a structure property of material dependent on its geometry (see Section 3.2). Therefore, the coincidence in rank order could be just a coincidence, especially considering that only five means of groups were available (insufficient for statistical correlation). In order to compare Young's modulus of our paper, let us mention that standard industrial production of kraft paper without recycling leads to much higher values of the parameter up to 2-4 GPa. In the case of laboratory production by hand and, consequently, recycling, we obtained much lower values of the parameter because of the manufacturing process. Namely, in the absence of mechanical pressing and hot calendaring of the sheet, there was not enough fiber packing and contact of fibers, which is the most important criterion in evaluating the elasticity of paper composites [2, 3, 5]. The values of Young's modulus obtained in our experiment (220-640 MPa) fit this range.
It is imperative to understand the differences in stiffness and tensile properties in this context. Reinforcement with PLA increases the elastic stiffness and resistance to deformation, or increases the Young’s modulus. However, reinforcement with cotton mesh enhanced the ductility, strain energy absorption, and crack bridging (greater tensile strength and elongation, but a smaller modulus). Both reinforcement approaches focus on the distinct mechanical attributes of the composites. The good tensile strength noted for the coarse cotton mesh (12.6 MPa, representing about a 200% improvement relative to the control sample) can be attributed to the continuous mesh structure, thus making it possible to better transfer the stresses, bridge cracks, and distribute loads in the composite. This is confirmed by other studies, where cellulose-containing fibers were shown to improve the mechanical characteristics of recycled paper through reinforced fiber bonding [7, 11, 12].
3.8 Scanning electron microscopy analysis
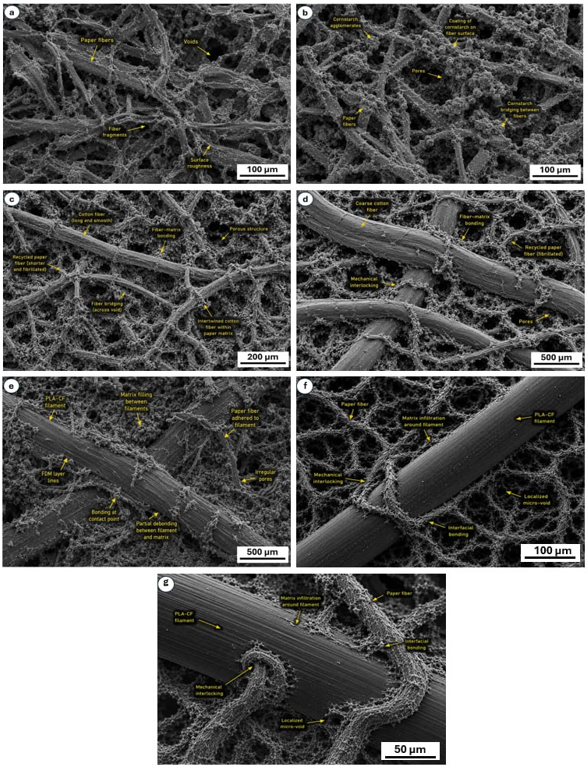
SEM analysis showed that the Group A sample had many pores and weaker bonding areas between fibers, as shown in Figure 2(a), which can be attributed to the manual manufacturing process and the absence of industrial compression. This is the main reason for the poor mechanical behavior of the base material without reinforcement. The cornstarch-reinforced material (Group B), which can act as an adhesive rather than a reinforcement material, improved fiber binding by filling some of the gaps between the fibers, leading to higher cohesion in the matrix due to the presence of starch clumps and fiber-bonding areas, as seen in Figure 2(b). Similar void-filling mechanisms have been reported for nanocellulose additives in recycled fiber networks [6, 25].
The inclusion of cotton mesh reinforced with fibers (Groups C and D) increased the ability of the material to resist cracking by virtue of the mechanisms of fiber bridging and stress transfer within the composite. The coarse mesh had a better interlocking capability than the fine mesh, leading to greater load transfer efficiency and thus greater tensile strength. Figures 2(c) and 2(d) depict the fiber bridging, fiber/matrix interaction, and mechanical interlocking in the cellulose composite, which explain the high values of tensile strength and elongation obtained for group D. These fiber-bridging and stress-redistribution mechanisms are well documented in the natural fiber composite literature [11, 12].
The PLA-CF mesh reinforced material (Group E) exhibited a relatively dense microstructure with fewer paths for crack formation and excellent dimensional stability. The SEM image in Figure 2(e) shows a well-connected fiber network with strong interface adhesion between the PLA-CF mesh and the cellulose matrix. This minimized the amount of moisture that could penetrate the material, thereby explaining the low water absorption and high stiffness values. This is further explained by the study conducted by Siro and Plackett [25] on how microfibrillated cellulose interfaces can control composite porosity and mechanics.
These micrographs, shown in Figures 2(a-d) below, were taken at magnifications appropriate for the observation of the porosity and fiber structure and provide confirmation of the above interpretations of the material’s properties. In order to identify the interface between the PLA-CF filament and paper, special high-magnification observations of the material from Group E were taken at 500 µm, 100 µm, and 50 µm magnification (Figures 2(e-g)). The images show that the main mechanism of bonding is interlocking and not adhesion. Fibers from the recycled paper were wrapped around and infiltrated into the surface of the PLA-CF filament (matrix infiltration around the filament, Figure 2(f)), with visible bonding and anchoring of fibers at the points of contact (Figures 2(e), (g)). In addition, at the highest magnification (Figure 2(g)), micro-voids and partial debonding of the filament from the matrix can be seen at certain points of contact, along with the FDM layer lines on the filament surface (Figure 2(e)); these micro-voids are consistent with the estimated porosity trend in section 3.4, and show that although interlocking works, the interfacial bonding is not continuous at the micro-level, which is one of the reasons behind the relatively low tensile strength of Group E compared to Group D (section 3.1).
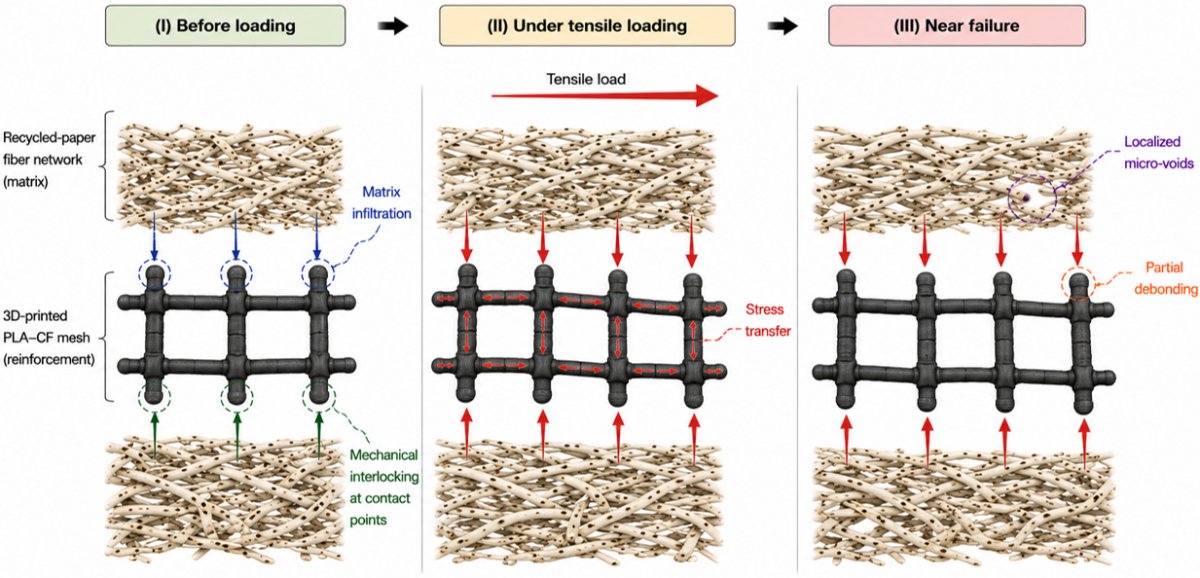
To explain the load transfer process for the material-focused reader, Figure 3 schematically illustrates the process of transferring loads between the PLA-CF mesh and paper-fiber interfaces through three stages: prior to loading, under tensile loading, and close to failure. When there is an applied tensile load, the stress is transferred from the cellulose-fiber matrix to the more rigid PLA-CF struts mainly by mechanical interlocking due to the fiber wraps around the intersections of struts deposited in the wet-pulp process that partially enter the openings of the mesh, and friction/adhesive interactions at the polymer-fiber interface. The dominant mechanical interlocking nature of this process is evident based on the magnified SEM images shown in Figures 2(e-g) (Section 3.8), revealing the fiber wraps, partial infiltration into the surface of the filaments, presence of micro-voids, and limited debonding, which results in the significantly increased stiffness of the composite material (in terms of Taber stiffness, Young’s modulus) dependent on efficient load transfer through the discreet junctions, whereas its tensile strength is inferior to that of the coarse cotton mesh (Group D, Section 3.1).
Figure 3. Schematic of the proposed interfacial load-transfer mechanism between the polylactic acid-carbon fiber (PLA-CF) mesh and paper fibers: (I) before loading, (II) under tensile loading, and (III) near failure, showing progressive debonding consistent with Figures 2(e-g)
3.9 Comparison with previous studies
The findings of this study are corroborated by similar results documented in the literature concerning reinforcements using recycled paper fibers and sustainability-based composite materials. Hubbe et al. [2] evaluated the mechanical characteristics of laboratory-made sheets from recycled cellulose fibers and documented tensile strength values between 3 and 5 MPa for recycled office paper fibers, similar to the control group value recorded here (4.2 ± 0.3 MPa). Čabalová et al. [4] verified the progressive reduction in the ability of recycled fibers to bond and maintain strength following successive recycling processes, thus accounting for the weak tensile strength observed in Group A.
For natural fiber reinforcements, it can be observed from studies conducted by Hu et al. [7] that the inclusion of discontinuous agricultural natural fibers within recycled paper matrix systems resulted in an enhancement in tensile strength of approximately 80–120%. Even though such comparisons might need to be interpreted carefully due to differences in sample preparation, reinforcement structure, and manufacturing procedures, it must be acknowledged that, within the current investigation, a 200% tensile strength enhancement ratio was recorded (namely, threefold of the initial one; Group D: 12.6 MPa compared with Group A: 4.2 MPa). Such enhanced performance is attributed to one key structural characteristic, namely the use of continuous mesh structures of cotton reinforcement as opposed to the randomly distributed short fibers in the work by Hu et al. [7], which is in line with the fiber reinforcement principles described by Faruk et al. [11] and Pickering et al. [12], as well as previous studies reporting the beneficial effects of cellulose-based fibrous reinforcements and recycled cellulosic materials on the mechanical performance of paper products [26, 27].
As far as starch-based reinforcement is concerned, according to Hubbe [9], starch-based additives at the wet-end increase the bond between fibers owing to the formation of hydrogen bonds; however, owing to the nature of starch (hydrophilic), there will be some limitations to the effect. Several investigations have shown the benefits of using starch-based additives in strengthening the adhesion between fibers and enhancing the physical properties of paper-based materials [8, 9]. In this investigation, Group B, which contains cornstarch, showed a small increase in tensile strength, from 4.2 MPa in the control group to 5.8 MPa, as a result of the improved adhesion between the fibers due to the presence of the starch matrix.
The use of PLA-CF composites as reinforcement in a 3D printing technique is considered an emerging method. According to Gkartzou et al. [13], Young's modulus values of 500 and 700 MPa were obtained from FDM-formed composite structures made from PLA-based materials, which is in line with the Young's modulus of 640 ± 30 MPa obtained in Group E reinforced with PLA-CF. Farah et al. [17] demonstrated the role of PLA semi-crystallinity and thermal history in controlling its stiffness, a fact applicable to FDM-manufactured parts. The contact angle value of Group E (68 ± 3.2°, hydrophilic as stated in Section 3.3) lies in the range described in the literature as an intermediate range of polymer-treated cellulosic surfaces by Lim et al. [16] and Samyn [28], which confirms the cellulose-PLA interaction theory.
With regard to water absorption, Vilarinho et al. [29] indicated a water absorption of above 80% for unreinforced recycled paper materials, which corresponds to the result of Group A (82 ± 4%). PLA-CF showed an exceptionally low value of (49 ± 3%, a ~40% drop from Group A) in accordance with the capillary blockage concept and porosity calculation explained in Section 3.4, and similar to that exhibited by the moisture resistance of composites reinforced with natural fibers having a hydrophobic polymer matrix [22]. For Group C and D composites reinforced with cotton, higher values of water absorption are expected because cellulosic materials have high inherent water absorbency [2, 9].
In terms of sustainability considerations from a more general point of view, the FDM printing method using the PLA-CF mesh material falls within the scope of recently published works related to the fabrication of sustainable composites via additive manufacturing [14, 15, 30]. In this regard, it is noteworthy that according to Ngo et al. [15], one of the major advantages offered by the FDM process is the capability to control the geometry of the reinforcing material fibers, which can be considered one of the shortcomings of random fiber dispersion. In an attempt to go beyond qualitative sustainability considerations, a rough calculation of the bio-based content of the composites belonging to group E was made. The chopped-carbon-fiber PLA filaments in such cases usually consist of roughly 15–20 wt% carbon fibers (non-bio-based) in a PLA matrix (bio-based), while the mesh occupies approximately 20 vol% of the composite cross-section (Table 4), and the recycled cellulose pulp, which accounts for the remaining 80 vol%, is completely bio-based. Therefore, one can conclude that the total bio-based content of the composite is approximately 95–97%. This number is only a rough estimate and does not include any data about the carbon footprint or biodegradation rate. A complete life-cycle assessment (LCA), including energy consumption and emissions during manufacturing as well as biodegradation rates, has not yet been conducted, and this is recognized as the most important task to be completed in the future (Section 3.10).
However, even with such advances in the water uptake rate of PLA-CF, none of the composites would be suitable for prolonged exposure to water unless further modification of the surface is made. This aspect of composites should be considered when they are used in humid packaging or structures. Generally, the techniques used for reinforcing the studied composites have shown competitive results compared to the other techniques described in previous studies; some of them have been proven to be better than any previous technique.
3.10 Study limitations
This study can be treated as a preliminary and exploratory analysis, which is subject to the following limitations. (1) Power analysis: While the one-way ANOVA analysis with Tukey’s HSD test was conducted (See Section 3 and Table 5), showing that the effects among the groups were statistically significant for all the properties, yet with sample sizes of n = 3 per group, the sample size is relatively small for inferential statistics, which makes the statistical power relatively low. In the future, the number of samples should be increased to n ≥ 10. (2) Deviation in gauge length: The gauge length (100 mm) deviates from the ASTM D828-22 [22] guidelines (180 ± 5 mm), which may affect the accuracy of the results obtained for elongation. (3) Directional anisotropy: Neither the MD nor the CD properties of the composite materials were evaluated separately; hence, some degree of directional anisotropy was expected for the hand-cast samples. (4) Coincidence in ranking of stiffness measurements: The ranking of sample stiffness by both Taber stiffness and Young’s modulus was the same; however, because only five group averages could be obtained, the similarity in ranking of the two variables does not imply equivalence (Section 3.7) and should be regarded as an observation rather than a verified correlation. (5) Validation of sustainability: Only a rough and composition-based estimation of bio-based content (≈95–97 vol%, Section 3.9) is given in this case. Although the current research primarily includes bio-based ingredients, its environmental sustainability can be calculated accurately only through a life-cycle assessment (ISO 14040/14044 [31]), and biodegradability is defined by the environment and testing conditions (e.g., ASTM D5338 [32] or ISO 14855 [33]). Both the above-mentioned tests have specific procedures and system boundaries and fall outside the scope of the current research objectives. Therefore, the reported results should be considered preliminary and require validation using larger sample populations and statistical analyses.
In this study, a reinforcement strategy for recycled paper based on the usage of cornstarch binder, cotton mesh reinforcement fiber, and 3D-printed partially bio-based PLA-CF mesh reinforcement material was proposed and explored. Rather than reiterating every result, the three main takeaways are summarized below.
(1) Main finding: all three reinforcement strategies statistically significantly improved the mechanical performance of recycled paper (Table 5), but the two mesh-type reinforcements optimize different attributes: coarse cotton mesh (Group D) maximizes tensile strength and elongation through fiber bridging and load redistribution, whereas the 3D-printed PLA-CF mesh (Group E) maximizes stiffness (Taber, Young’s modulus) and reduces water absorption by ≈40% through mechanical interlocking and capillary blockage (Sections 3.1–3.8).
(2) Practical implication: The choice of reinforcement should therefore be application-driven – cotton mesh where tensile toughness dominates the design requirement, PLA-CF mesh where stiffness and moisture resistance dominate – and the PLA-CF route offers a geometrically controllable, partially bio-based (≈95–97 vol%, Section 3.9) alternative to random-fiber reinforcement, achieved without industrial pressing or calendaring.
(3) Main limitation: The exploratory sample size (n = 3) and manual, non-industrial fabrication route (residual porosity, no hot pressing) limited the absolute values reported here, and the sustainability estimate was compositional rather than a measured life-cycle assessment (Section 3.10). Future studies should combine cotton and PLA-CF reinforcement, increase n for stronger statistical power, and add biodegradability/LCA testing.
Raw replicate measurements
The individual readings at the specimen level (n = 3 in each group) and their mean ± SD are presented in Tables A1a-A1b. This information is the foundation for the means, standard deviations, and compact-letter grouping according to the Tukey HSD test presented in Table 5 and applied to the one-way ANOVA described in Section 3.
Table A1a. Raw replicate values: tensile strength, Taber stiffness, and contact angle
|
Grp |
Rep. |
Tensile (MPa) |
Taber (mN·m) |
Contact (°) |
|
A |
1 |
4.55 |
18.60 |
32.08 |
|
A |
2 |
4.02 |
19.19 |
31.69 |
|
A |
3 |
4.02 |
16.21 |
29.22 |
|
A |
Mean ± SD |
4.20 ± 0.31 |
18.00 ± 1.58 |
31.00 ± 1.55 |
|
B |
1 |
6.18 |
23.95 |
36.37 |
|
B |
2 |
5.86 |
25.92 |
36.99 |
|
B |
3 |
5.36 |
22.13 |
40.64 |
|
B |
Mean ± SD |
5.80 ± 0.41 |
24.00 ± 1.90 |
38.00 ± 2.31 |
|
C |
1 |
9.24 |
33.94 |
28.28 |
|
C |
2 |
8.73 |
43.76 |
24.48 |
|
C |
3 |
8.73 |
36.30 |
28.24 |
|
C |
Mean ± SD |
8.90 ± 0.29 |
38.00 ± 5.13 |
27.00 ± 2.18 |
|
D |
1 |
13.56 |
49.14 |
21.65 |
|
D |
2 |
12.05 |
58.54 |
21.21 |
|
D |
3 |
12.19 |
48.32 |
23.14 |
|
D |
Mean ± SD |
12.60 ± 0.83 |
52.00 ± 5.68 |
22.00 ± 1.01 |
|
E |
1 |
11.31 |
65.94 |
70.10 |
|
E |
2 |
11.04 |
57.27 |
69.78 |
|
E |
3 |
11.84 |
59.79 |
64.12 |
|
E |
Mean ± SD |
11.40 ± 0.41 |
61.00 ± 4.46 |
68.00 ± 3.36 |
Table A1b. Raw replicate values: water absorption, density, elongation at break, and Young’s modulus
|
Grp |
Rep. |
Water (%) |
Density (g/cm3) |
Elong (%) |
Young (MPa) |
|
A |
1 |
79.43 |
0.70 |
1.88 |
212 |
|
A |
2 |
81.99 |
0.65 |
1.87 |
221 |
|
A |
3 |
84.57 |
0.69 |
1.65 |
227 |
|
A |
Mean ± SD |
82.00 ± 2.57 |
0.68 ± 0.03 |
1.80 ± 0.13 |
220 ± 8 |
|
B |
1 |
69.44 |
0.71 |
2.19 |
286 |
|
B |
2 |
75.47 |
0.74 |
1.95 |
294 |
|
B |
3 |
77.10 |
0.68 |
2.15 |
290 |
|
B |
Mean ± SD |
74.00 ± 4.04 |
0.71 ± 0.03 |
2.10 ± 0.13 |
290 ± 4 |
|
C |
1 |
88.48 |
0.73 |
3.27 |
410 |
|
C |
2 |
93.86 |
0.73 |
3.72 |
403 |
|
C |
3 |
90.65 |
0.76 |
3.21 |
417 |
|
C |
Mean ± SD |
91.00 ± 2.71 |
0.74 ± 0.02 |
3.40 ± 0.28 |
410 ± 7 |
|
D |
1 |
91.62 |
0.78 |
5.13 |
584 |
|
D |
2 |
97.66 |
0.75 |
5.00 |
570 |
|
D |
3 |
104.72 |
0.78 |
4.26 |
586 |
|
D |
Mean ± SD |
98.00 ± 6.56 |
0.77 ± 0.02 |
4.80 ± 0.47 |
580 ± 9 |
|
E |
1 |
50.86 |
0.83 |
2.84 |
646 |
|
E |
2 |
48.65 |
0.85 |
2.87 |
614 |
|
E |
3 |
47.49 |
0.81 |
3.59 |
660 |
|
E |
Mean ± SD |
49.00 ± 1.71 |
0.83 ± 0.02 |
3.10 ± 0.42 |
640 ± 24 |
[1] Monte, M., Fuente, E., Blanco, A., Negro, C. (2009). Waste management from pulp and paper production in the European Union. Waste Management, 29(1): 293-308. https://doi.org/10.1016/j.wasman.2008.02.002
[2] Hubbe, M.A., Venditti, R.A., Rojas, O.J. (2007). What happens to cellulosic fibers during papermaking and recycling? A review. BioResources, 2(4): 739-788.
[3] Hubbe, M.A., Gill, R.A. (2016). Fillers for papermaking: A review of their properties, usage practices, and their mechanistic role. BioResources, 11(1): 2886-2963. https://doi.org/10.15376/biores.11.1.2886-2963
[4] Cabalova, I., Kacik, F., Geffert, A., Kacikova, D. (2011). The effects of paper recycling and its environmental impact. In Environmental Management in Practice. InTech. https://doi.org/10.5772/23110
[5] Vishtal, A., Retulainen, E. (2012). Deep-drawing of paper and paperboard: The role of material properties. BioResources, 7(3): 4424-4450. https://doi.org/10.15376/biores.7.3.4424-4450
[6] Viana, L.C., Potulski, D.C., de Muniz, G.I.B., de Andrade, A.S., da Silva, E.L. (2018). Nanofibrillated cellulose as an additive for recycled paper. Cerne, 24(2): 140-148. https://doi.org/10.1590/01047760201824022518
[7] Hu, F., Zeng, J., Cheng, Z., et al. (2021). Cellulose nanofibrils (CNFs) produced by different mechanical methods to improve mechanical properties of recycled paper. Carbohydrate Polymers, 254: 117474. https://doi.org/10.1016/j.carbpol.2020.117474
[8] Singh, K.K., Kumar, D. (2026). A review on biobased barrier coating and its challenges for sustainable paper packaging. Polymers for Advanced Technologies, 37(4): e70581. https://doi.org/10.1002/pat.70581
[9] Hubbe, M.A. (2019). Nanocellulose, cationic starch and paper strength. Appita Journal, 72(2): 82-94. https://search.informit.org/doi/10.3316/informit.591826137919535.
[10] Thomas, S., Paul, S.A., Pothan, L.A., Deepa, B. (2011). Natural fibres: Structure, properties and applications. In Cellulose Fibers: Bio- and Nano-Polymer Composites, Springer, Berlin, Heidelberg, pp. 3-42. https://doi.org/10.1007/978-3-642-17370-7_1
[11] Faruk, O., Bledzki, A.K., Fink, H., Sain, M. (2012). Biocomposites reinforced with natural fibers: 2000-2010. Progress in Polymer Science, 37(11): 1552-1596. https://doi.org/10.1016/j.progpolymsci.2012.04.003
[12] Pickering, K.L., Efendy, M.G.A., Le, T.M. (2016). A review of recent developments in natural fibre composites and their mechanical performance. Composites Part A: Applied Science and Manufacturing, 83: 98-112. https://doi.org/10.1016/j.compositesa.2015.08.038
[13] Gkartzou, E., Koumoulos, E.P., Charitidis, C.A. (2017). Production and 3D printing processing of bio-based thermoplastic filament. Manufacturing Review, 4: 1-14. https://doi.org/10.1051/mfreview/2016020
[14] Turner, B.N., Strong, R., Gold, S.A. (2014). A review of melt extrusion additive manufacturing processes: I. Process design and modeling. Rapid Prototyping Journal, 20(3): 192-204. https://doi.org/10.1108/rpj-01-2013-0012
[15] Ngo, T.D., Kashani, A., Imbalzano, G., Nguyen, K.T., Hui, D. (2018). Additive manufacturing (3D printing): A review of materials, methods, applications and challenges. Composites Part B: Engineering, 143: 172-196. https://doi.org/10.1016/j.compositesb.2018.02.012
[16] Lim, L., Auras, R., Rubino, M. (2008). Processing technologies for poly(lactic acid). Progress in Polymer Science, 33(8): 820-852. https://doi.org/10.1016/j.progpolymsci.2008.05.004
[17] Farah, S., Anderson, D.G., Langer, R. (2016). Physical and mechanical properties of PLA, and their functions in widespread applications-A comprehensive review. Advanced Drug Delivery Reviews, 107: 367-392. https://doi.org/10.1016/j.addr.2016.06.012
[18] Ranjan, N., Singh, R., Ahuja, I. (2019). Investigations for mechanical properties of PLA-HAp-CS based functional prototypes. Materials Today: Proceedings, 18: 2329-2334. https://doi.org/10.1016/j.matpr.2019.07.016
[19] Zeng, J., Li, P., Yan, Z., Zhou, J., Quach, W., Zhuge, Y. (2023). Behavior of 3D-printed HPC plates with FRP grid reinforcement under bending. Engineering Structures, 294: 116578. https://doi.org/10.1016/j.engstruct.2023.116578
[20] Cai, C., Zhang, P., Wang, Y., et al. (2024). Sustainable three-dimensional printing of waste paper-based functional materials and constructs. Advanced Composites and Hybrid Materials, 7(5): 1-12. https://doi.org/10.1007/s42114-024-00970-y
[21] Mazzanti, V., Malagutti, L., Mollica, F. (2019). FDM 3D printing of polymers containing natural fillers: A review of their mechanical properties. Polymers, 11(7): 1094. https://doi.org/10.3390/polym11071094
[22] ASTM D828-22. (2022). Standard Test Method for Tensile Properties of Paper and Paperboard Using Constant-Rate-of-Elongation Apparatus. ASTM International, West Conshohocken, PA.
[23] Law, K. (2014). Definitions for hydrophilicity, hydrophobicity, and superhydrophobicity: Getting the basics right. The Journal of Physical Chemistry Letters, 5(4): 686-688. https://doi.org/10.1021/jz402762h
[24] Dhakal, H., Zhang, Z., Richardson, M. (2007). Effect of water absorption on the mechanical properties of hemp fibre reinforced unsaturated polyester composites. Composites Science and Technology, 67(7-8): 1674-1683. https://doi.org/10.1016/j.compscitech.2006.06.019
[25] Siró, I., Plackett, D. (2010). Microfibrillated cellulose and new nanocomposite materials: A review. Cellulose, 17(3): 459-494. https://doi.org/10.1007/s10570-010-9405-y
[26] Balea, A., Merayo, N., Fuente, E., et al. (2018). Cellulose nanofibers from residues to improve linting and mechanical properties of recycled paper. Cellulose, 25(2): 1339-1351. https://doi.org/10.1007/s10570-017-1618-x
[27] Yalcin-Enis, I., Kavak, N., Sezgin, H. (2026). Reviving cellulose-based industrial textile wastes into recycled papers. Cellulose Chemistry and Technology, 60(1-2): 163-173. https://doi.org/10.35812/CelluloseChemTechnol.2026.60.14
[28] Samyn, P. (2013). Wetting and hydrophobic modification of cellulose surfaces for paper applications. Journal of Materials Science, 48(19): 6455-6498. https://doi.org/10.1007/s10853-013-7519-y
[29] Vilarinho, I.S., Gameiro, T., Capela, M.N., et al. (2022). Review of recycling alternatives for paper pulp wastes. Frontiers in Materials, 9: 1006861. https://doi.org/10.3389/fmats.2022.1006861
[30] Tian, X., Liu, T., Yang, C., Wang, Q., Li, D. (2016). Interface and performance of 3D printed continuous carbon fiber reinforced PLA composites. Composites Part A: Applied Science and Manufacturing, 88: 198-205. https://doi.org/10.1016/j.compositesa.2016.05.032
[31] ISO 14040:2006. (2006). Environmental Management — Life Cycle Assessment — Principles and Framework. International Organization for Standardization. https://www.iso.org/standard/37456.html.
[32] ASTM D5338-15:2021. (2021). Standard Test Method for Determining Aerobic Biodegradation of Plastic Materials Under Controlled Composting Conditions. ASTM International. https://doi.org/10.1520/D5338-15R21
[33] ISO 14855-1:2012. (2012). Determination of the Ultimate Aerobic Biodegradability of Plastic Materials Under Controlled Composting Conditions — Method by Analysis of Evolved Carbon Dioxide. International Organization for Standardization. https://www.iso.org/standard/57902.html.