
Ali Taha Mohammed* | Diana Abed Alkareem Noori Kattab | Zainab Hussein Mohsein | Asaad Kadhim Eqal | Abass Ali Saleh | Samir Ali Amin
© 2026 The authors. This article is published by IIETA and is licensed under the CC BY 4.0 license (http://creativecommons.org/licenses/by/4.0/).
OPEN ACCESS
Macroscopic deformation, kinetic, and structural formability of copper, aluminum (AA6061), and Monel 400 have been investigated in the cold deep-drawing process. The study uses a modified Lagrangian finite element formulation in ANSYS Explicit Dynamics to quantify punch force, the von Mises stress distribution, and localized thinning along the cup wall. A computational continuum is modeled as a non-linear elastoplastic body to capture the actual physics of deep drawing. With this method, the simulation can accurately identify macroscopic formability constraints and highlight regions highly susceptible to localized thinning and necking. The model simulates von Mises plasticity for these particular alloys and uses isotropic strain-hardening laws to accurately account for yielding, material flow, and load redistribution during the forming process, under high levels of multi-axial stresses. Numerical benchmarking demonstrates how distinct strain-hardening behaviors dictate the macroscopic formability limits. Pure copper exhibits a high strain-hardening capacity and exceptional ductility, continually redistributing the mechanical load and avoiding localized thinning. This provides superior structural drawability, minimizes dimensional springback, and achieves a uniform maximum von Mises stress of 262.82 MPa at low press tonnage. In contrast, AA6061 aluminum alloy has a very limited operating range. With lower work-hardening capability, stresses are hyper-localized at the point where the steel punch's profile radius touches the parabola, resulting in a predicted high-risk zone for cup-bottom tearing without strong tribological control. Moreover, the extreme flow resistance observed in the high-strength Monel 400 superalloy is 568.16 MPa at the die radius. Because of its inherent structural rigidity, higher blank-holder pressures are required to prevent the flange from wrinkling; these higher pressures result in greater springback and significant geometric deviation.
elastoplastic kinematics, structural formability, dynamic strain hardening, macroscopic drawability, macroscopic failure susceptibility
This deep-drawing process has become a significant element of the growing trend in metallurgical research, driven by the ever-increasing need for lightweight, high-reliability components in new production. In current research, there is growing hope for a combination of robust finite element analysis (FEA) and lab validation, with the aim of establishing the correct sequence of complex form parameters for most high-performance metals, especially aluminum, copper, and nickel alloys.
Shamso et al. [1] examined the deep drawing process of aluminum blanks by combining LS-DYNA finite element simulations with Taguchi and response surface approaches. The statistical analysis they conducted found punch velocity to be the key factor in critical deformation events, such as maximum thinning, forming force, and effective plastic strain. At the same time, the bulk thickness of initial blanks has a secondary effect. Bahanan et al. [2] conducted an in-depth experimental and computational study of the cold deep drawing of 3104-H32 aluminum alloys, with particular emphasis on the geometric effects of the quarter-corner plunger design and on different tribological settings. Using their FEA, they suggested a plunger radius of 3 mm and a coefficient of friction of 0.1 as a good fit to achieve homogeneous strain and address localized thinning. A research study conducted by Pan and Cai [3] on hydromechanical deep drawing of the alloy (AA6013) cylindrical components in the shape of a cylinder was carried out. A response surface design was used in the numerical model to optimize the selection of many important variables of the work. The authors concluded that the quality curve is highly sensitive to the combination of fluid pressure rate, interfacial friction coefficient, and die fillet radii, and identified a set of parameters that minimized the maximum thinning rate
Leelaseat et al. [4] proposed a new formability measurement method that uses the Q-value, the optimized formability value based on thinning limit diagrams, to optimize deep drawing of automotive aluminum alloy sheets. They showed that manufacturers can greatly reduce sidewall wrinkling and localized material thinning by simply varying initial blank sizes and redesigning tool shapes, e.g., by adding optimized semicircular draw beads. In a study by Khazaal and Szabolcs [5], the tribological and mechanical effects of using punches made from a hybrid iron-based metal matrix composite (MMC) produced by powder metallurgy during deep drawing were examined. Highly comparative tests conducted by the authors of the current paper showed that conventional steel tooling produced a constant effect: an increase in the required pulling force and a decrease in the total energy required to create, as set by the MMC punch nose. The study by Ulibarri et al. [6] examined the mechanics of deep drawing of Inconel 718 superalloy, with particular attention to how intermediate annealing treatments affect the material's structural response. Together with experimental validation, their numerical simulations showed that strategic thermal processing can reduce degradation of elastic modulus and greatly enhance overall formability.
Kotkunde et al. [7] studied the warm deep-drawing behavior of Inconel 625 by combining the constitutive equations of Sellars with the improved anisotropic yield criteria, namely, the Hill 48 and Barlat 89 formulations. Their detailed finite element simulations and tensile tests have shown that the limiting drawing ratio (LDR) increases significantly with rising forming temperature, and, at the same time, these experiments have reduced the forces required for drawing. Ulibarri et al. [8] conducted a detailed study of multi-stage deep-forming operations at room temperature to determine the harsh conditions for post-forming springback and the formability of the Inconel 718 alloy. The researchers concluded that it is important to apply intermediate heat treatments between sequential forming steps to mitigate residual stresses and alter the material's hardening behavior. Morchhale et al. [9] examined the formability of the IN625 superalloy by analyzing the relationships between critical process parameters (i.e., temperature, punch velocity, and blank-holding pressure) and its deep-drawing behavior. They have plotted operating limits for safe forming, and they have suitably observed the thermo-mechanical conditions for safe forming beyond which they have transitioned to wrinkling or fracture flaws. Finally, the study provides a valuable parameter to consider when tweaking the production of Inconel 625 parts to prevent structural failures, whether due to complex drawing procedures or material breakdown. To achieve active product formation in the deep drawing of copper-nickel alloy sheets, Deng et al. [10] developed a simple friction model for ultrasonically vibration-assisted deep drawing. By combining the dynamic interactions between the slide's velocity and vibration amplitude, their numerical experiments in ABAQUS and subsequent experimental tests showed that ultrasonic assistance significantly reduces interfacial friction. Kosti et al. [11] conducted a systematic review of the formability of pure copper sheets, using a combination of hydraulic press tests and FEA in Abaqus. Their tests set a maximum LDR of 1.82 for 1 mm-thick blanks, indicating that they can readily be formed with good structural formability. Phanitwong and Thipprakmas [12] have addressed the restriction in the formability of materials due to their anisotropy by designing a new Multi-Draw Radius (MDR) die. Their specialized design, using larger draw radii perpendicular to the rolling direction and smaller radii perpendicular to the 0° and 90° directions, was effective in reducing non-axisymmetric material flow and minimizing defects in the earnings by approximately 40%. The great interest in the article by Qin et al. [13] lies in the microstructural mechanics of the C10200 copper plate, arising from changes in crystallographic texture, and in the deep-drawability of the material developed during rolling reductions and annealing. The researchers showed that creating a dominant Cube texture (001)100 induces extreme planar anisotropy and promotes an imbalanced strain distribution, leading to catastrophic fracture during forming. The paper by Chen et al. [14] presents an advanced 3D FEA using an updated Lagrangian formulation to simulate micro deep drawing of square-hole flanges in copper sheets. By applying a specialized model for micro-elastoplastic materials, the researchers showed that a further increase in the punch fillet radius dilutes the peak stress and strain localized in the workpiece during deformation. Gong et al. [15] made a contribution to the sphere of micro-manufacturing by experimentally testing the deep drawing of C1100 pure copper (50-micron-thick) to produce miniature conical-cylindrical cups. Using a specially designed multi-operation compound mold, the team produced multi-part complex micro-elements with internal bottom diameters as small as 0.4 mm.
The direct intent of this work is thus to compare the deep drawing behavior of the three alloys—pure copper, AA6061 aluminum, and Monel 400, as these three classes of alloy are deep-drawn under the same geometric conditions. Most of the literature that examines the effect of a draw punch would deal with a single material, but the novelty of this paper is the quantification of the responses of two completely different crystallographic structures to the same macroscopic tooling geometry (a 40 mm diameter draw punch and a 1 mm blank thickness). The process input parameters include non-linear elastoplastic material models, defined differential friction boundaries, and mathematically tuned blank-holder forces. The main output parameters being measured are temporal reaction forces/press tonnage, von Mises equivalent stress topologies, and the spatial distribution of equivalent plastic and elastic strain.
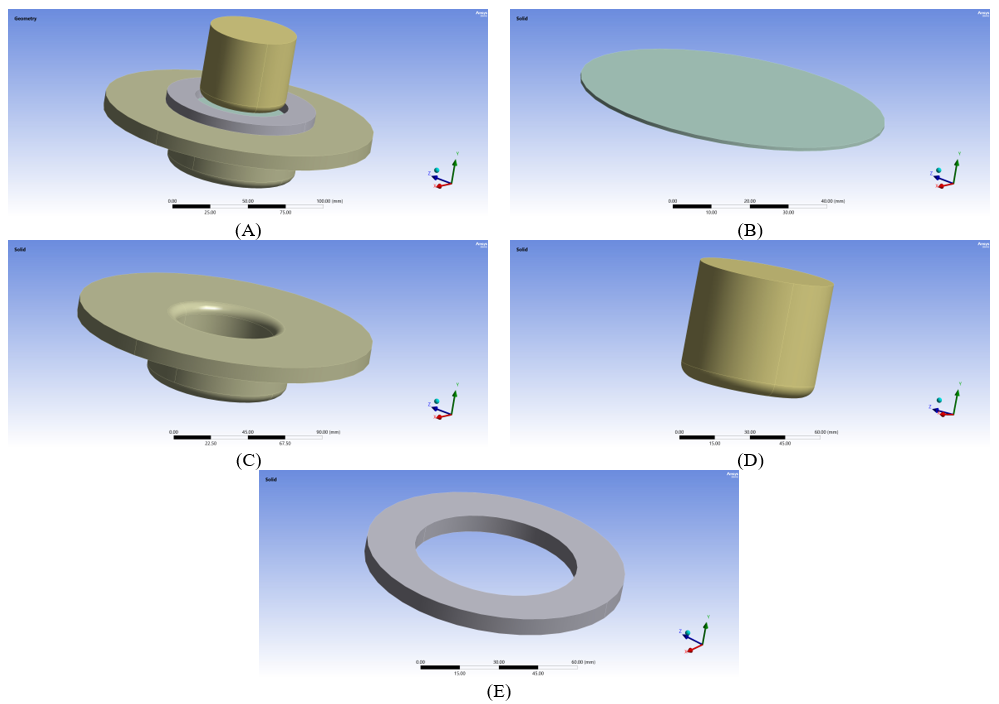
The assembly of the deep drawing was mathematically modeled in the parametric computer-aided design (CAD) program SOLIDWORKS (3D version). The choice of this environment was aimed at achieving high-dimensional fidelity and at precisely determining the spatial relations between the tooling and the workpiece before an FEA. The physical area of the simulation comprises four assemblies: the forming punch, the lower die, the blank holder, and the initial sheet metal blank, as illustrated in Figures 1(A), (B), (C), (D), and (E). The design of all components was carried out sequentially to simulate the physical conditions under which deep drawing was performed.
An 80 mm diameter circular blank (Figure 1(B)) is 1 mm thick. Optimization of material flow and minimization of localized stresses are addressed using a profile with a 40 mm diameter and a 5 mm radius with respect to the punch (Figure 1(C)). The die (Figure 1(D)) has an interior diameter of 42 mm, a corner radius of 5 mm for smooth drawing and to avoid fracture initiation, and radial clearance. To avoid wrinkling caused by compressive hoop forces, a ring-shaped blank holder (Figure 1(E)) is used. To ensure continuity of surface geometry across the platform, it was decided to export the SOLIDWORKS assembly as a STEP file [16] and then import it into ANSYS Workbench. The tooling (punch, die, and holder) was treated as a rigid body because its strength was very high, and this approach was used for computational efficiency. However, the blank made of sheet metal was modeled as an elastoplastic deformable body to accurately describe the kinematics of deep drawing and permanent shape changes. The solver uses the von Mises and isotropic hardening criteria to dynamically model plastic strain, producing formability behavior that is both realistic and practical and providing accurate failure localization predictions for the selected alloys [17].
Figure 1. The ANSYS model parts design: (A) the complete model, (B) the sheet blank, (C) the punch die, (D) the die, and (E) the blank sheet holder
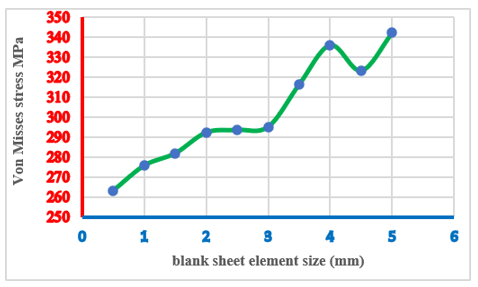
The finite element model (FEM) consists of 160325 elements and 37539 nodes. To obtain the hexahedral layers, the sheet was discretized using a strict sweep with an element size of 2 mm to avoid shear locking [18]. This results in a very fine 2 mm mesh capturing – extremely localized – strain and stress gradients at the die and punch corners. The rigid punch, die, and blank holder were discretized at 3 mm using the ANSYS Automatic Meshing algorithm. This larger mesh can efficiently represent surface curvature for contact algorithms without over-consuming computational power since there will be no internal stresses to resolve in rigid bodies. A mesh convergence study was conducted to ensure that this particular sizing choice achieved grid independence and was mathematically optimal. The deep drawing simulation was performed 10 times sequentially, each time reducing the element size by 0.5 mm (blank 0.5-10 mm and tooling 1-11 mm). The maximum von Mises stress was used to determine the optimum mesh size, as the output magnitudes flattened, resulting in a low variance of 2–5% between iterations. The results of these convergence tests are summarized in Table 1.
The mesh convergence study is a trade-off between numerical accuracy and computational efficiency. Large-scale stress singularities resulting from penalty-based contact were prevented using Peak Punch Force as the global convergence metric. As shown in Table 1 and Figure 2, a size of 2–3 mm is optimal, with a blank of 2 mm and tooling of 3 mm. As shown in Table 1, only 160,325 elements are needed, which is approximately 84% fewer than the number required to be left at extreme refinement (0.5-1.5 mm). In so doing, the number of nodal degrees of freedom is drastically diminished while accuracy of the nodal structure is preserved. Moreover, this chosen mesh size serves as an additional mechanical filter that attenuates high-frequency contact noise while still clearly displaying plastic flow or local thinning at the die radius. Finally, a Grid Convergence Index (GCI) was computed using Richardson Extrapolation (mathematically detailed in Appendix A) to rigorously confirm the solution's grid independence.
Table 1. The simulation model mesh independence test results
|
Elements Size (mm) |
Elements No. |
Nodes No. |
Max. Von Mises Stress |
|
0.5-1.5 |
1010935 |
308026 |
263.16 MPa |
|
1-2 |
407634 |
112475 |
275.72 MPa |
|
1.5-2.5 |
213490 |
62191 |
281.84 MPa |
|
2-3 |
160325 |
37539 |
292.31 MPa |
|
2.5-3.5 |
78186 |
24787 |
293.53 MPa |
|
3-4 |
52611 |
16893 |
295.14 MPa |
|
3.5-4.5 |
38649 |
12947 |
316.42 MPa |
|
4-5 |
28500 |
10083 |
336.06 MPa |
|
4.5-5.5 |
21841 |
8571 |
323.27 MPa |
|
5-6 |
17221 |
6819 |
342.18 MPa |
Figure 2. Simulation model von Mises stress convergence with the mesh element size
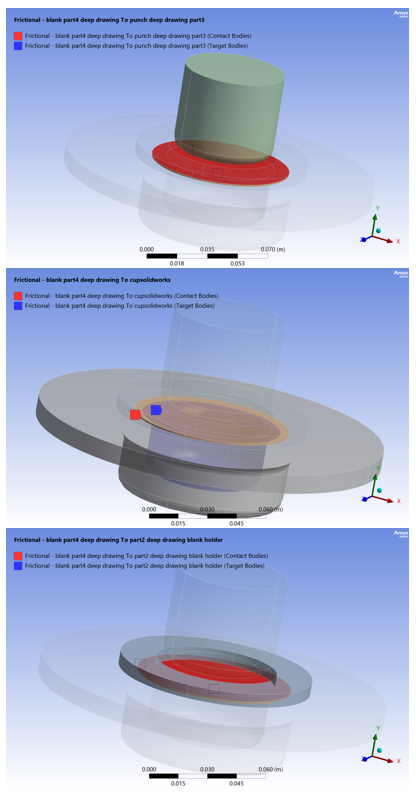
The challenge in accurate FEA of sheet metal forming lies in accurately defining physical parameters. The deep-drawing process was simulated using ANSYS Explicit Dynamics, and three materials (AA6061 Aluminum, Copper, and Monel (400) Ni-Cu) were considered. Considering the nonlinear contact relationship as a highly nonlinear load-deformation mechanism, contact pairs were created between the flexible elastoplastic blank and the rigid tooling (punch, die, and holder block) [18]. These interfaces were modeled using a penalty-based frictional contact formulation, which prevents numerical penetration and simulates resistance to sliding. This special friction model is particularly important because it governs the material flow into the cup, local thinning, and plastic strain buildup in the cup wall. Figure 3 shows the entire ANSYS simulation model, with parts and contact locations.
The tooling, in order to simulate the mechanical press, was carefully limited in its degrees of freedom (DOF):
• Die Formulation: A die completely immobilized in all three directions, X, Y, and Z, was used as a fixed geometric die for the deforming material.
• Punch Kinematics: The punch was only moved along the vertical (Y-axis). All the lateral and rotational movements were blocked to obtain precise concentricity. The stroke depth and a uniform deformation rate were set by prescribing a downward displacement profile.
Figure 3. ANSYS model parts, contacts, points, types, and locations
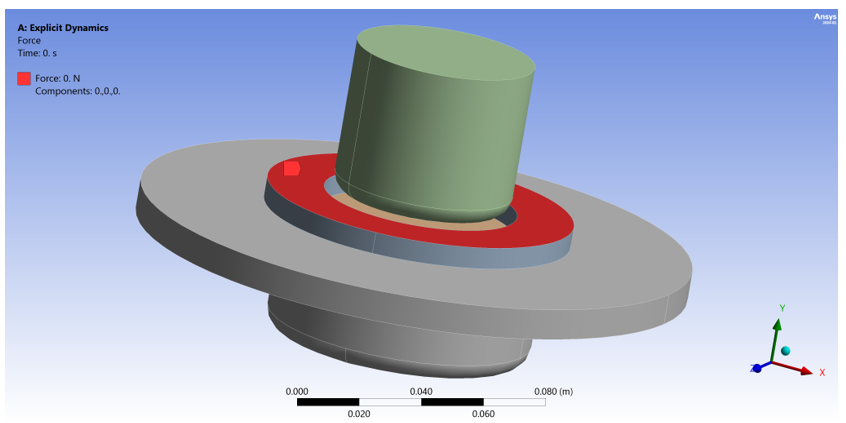
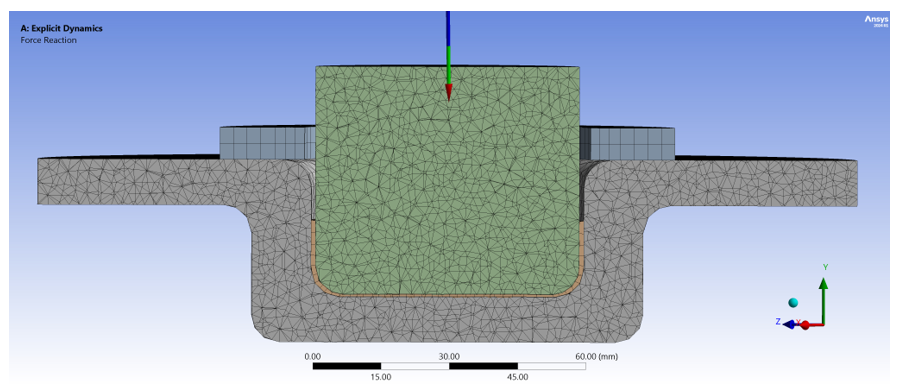
Figure 4. The force location on the blank sheet holder
Moreover, a blank holder was used to control material flow, thereby preventing flange wrinkling under compressive stress and flange tearing under tensile stress. A clamping force of 200 N was applied at the flange of the sheet, as shown in Figure 4; this is a constant clamping force. This active pressure system ensures effective friction with a controlled flow rate precisely set for the drawing operation, achieved through dynamic control of the material flow rate over the die corner radius.
The simulation involved a three-phase quasi-static mathematical sequence due to the complexity of the non-linearities of geometric deformations and material hardening:
Phase 1: Tool Engagement & Clamping: Frictional contacts are established, and the blank holder force is ramped linearly from 0 (stress-free state of the blank) to the maximum force to avoid dynamic shock to the blank.
Phase 2: (Deep Drawing Stroke): The blank is held in place, and the punch pushes the blank into the die. The solver can continuously compute von Mises stresses and effective plastic strains in the deforming material and calculate local thinning, accounting for strain hardening.
Phase 3: (Elastic Recovery/Springback): Tooling forces are removed, allowing the system to assess the extent of any elastic strains and the accuracy of the finished cup's dimensions.
The blank holder was not purely geometrically controlled but instead governed by a force-controlled penalty function to ensure that no wrinkling or tearing would occur. It was pinned in all directions except the vertical (Y-axis), allowing only vertical (Y-axis) translation. By doing so, the holder was able to gradually adjust to changes in the sheet's initial thickness of 1.0 mm caused by flow within the sheet. Most importantly, Blank Holder Force (BHF) was optimized by matching the crystallographic structure type and yield strength of each material. With high lattice mobility, Face-Centered Cubic (FCC) Copper required the least force. A slightly greater clamping pressure was needed to control flow through the precipitation-hardened AA6061 aluminum. Finally, it required the maximum clamping force to tightly fit the stiff flange of the Monel 400 superalloy, which would otherwise buckle under very high clamping hoop tensions. The BHF magnitudes that are used for each alloy are given at the macro scale in Table 2.
Table 2. Tuned Blank Holder Force (BHF) magnitudes and effective flange clamping pressures
|
Material Model |
Blank Holder Force (kN) |
Effective Clamping Pressure (MPa) |
Loading Schedule |
|
Pure Copper |
6.5 kN |
1.8 MPa |
Ramped, then held constant |
|
AA6061 Aluminum |
10.0 kN |
2.7 MPa |
Ramped, then held constant |
|
Monel 400 Superalloy |
35.0 kN |
9.4 MPa |
Ramped, then held constant |
The ANSYS Explicit Dynamics solver was used to simulate the deep-drawing process using a modified Lagrangian approach, in which the mesh moves through the deforming material continuously. Computational stability depends on the ability to solve nonlinear partial differential equations at each time step. At the macro scale, the primary factor governing macroscopic deformation is the dynamic equation of linear momentum conservation, which can be written as [19].
$∇. \sigma+\rho b=\rho$ (1)
In this context, (σ) denotes the Cauchy stress tensor, (ρ) the density, (b) the body force, and (u) the acceleration. The equations of elastoplasticity relate external strain to internal stress, as the Plasticity created by punch harvesting is irreversible. Simulation results show the real-time plastic start based on J2 theory and the von Mises criterion. The von Mises equivalent stress (σvm), based on deviatoric stress components (Sij), is defined as [19]:
$\sigma_v m=\sqrt[2]{\frac{3}{2} S_{i j} S_{i j}}$ (2)
According to von Mises' criterion, yielding occurs when the energy of deformation in the material reaches a critical value equal to the yield strength in plain tension. Such a phenomenological model works perfectly well for ductile metals such as aluminum, copper, and nickel alloys, since it assumes that these metals cannot undergo plastic deformation under hydrostatic pressure. In contrast, shear stresses cause the material to flow. The solver uses an isotropic hardening rule when deforming the material (which is often considered a power law or prescribed by the power law: σ = K εN). This guarantees that the equivalent plastic strain can continuously increase the yield surface as the strain increases dynamically, thereby continually forecasting the additional force required to draw the strain-hardened cup walls. The equations governing the resistance to the flow of material over the die corner and under the blank holder are determined by interfacial friction. This interaction is developed based on a modified Coulomb friction model, where the shear frictional stress (Tf) due to friction between two bodies at the interface is [20]:
$T_f=\mu p$ (3)
where, µ is the coefficient of friction and p is the normal contact pressure exerted by the rigid tooling. In the formulation of the contact penalty employed in this work, the normal pressure is not a constant value. Still, a dynamic penalty reaction is given by p = kn δ, where kn is the normal contact stiffness, and δ is the penetration depth between the finite elements. If the calculated shear stress exceeds a critical shear yield limit (often exceeded by localized thinning), the software switches to a sticking-friction model. It is this mathematical boundary condition that will ultimately determine what happens to the blank: whether it will be drawn into the die cavity without catastrophically fracturing under tensile stress due to excessive frictional drag. The geometric deformation during deep drawing is extremely high, rendering traditional small-strain engineering formulas invalid. ANSYS Explicit solver employs a large-strain (finite-strain) formulation based on the deformation gradient tensor. The instantaneous rate of deformation represents the spatial rate of deformation of the material, the spatial rate of deformation tensor Dij, which is the symmetric part of the velocity gradient [21]:
$D_{i j}=\frac{1}{2}\left(\frac{\partial v_i}{\partial x_j}+\frac{\partial v_j}{\partial x_i}\right)$ (4)
where, ∂vi and ∂vj represent the velocity vectors of the material points, xi and xj are their spatial coordinates in the current configuration. The updated Lagrangian formulation, in contrast to linear static analyses, which quantify the strain with respect to the original undeformed shape, is a dynamic reference frame. That is, mathematically, integrating the time-dependent version of the tensors Dij yields the actual (logarithmic) strain in the material. The derivation is key to predicting localized necking and sheet thinning because it accounts for the material matrix's constant reorientation due to bending around the die corner and stretching of the cup wall. Whereas the von Mises yield criterion is applicable to determine when the material will yield, the plastic flow rule is applicable to determine how the material will behave once the yield point has been surpassed. The associated flow rule (also known as the von Mises equation in isotropic materials) is used in the simulation, which is mathematically formulated as [21]:
$d \varepsilon_{i j}^p=d \lambda \frac{\partial f}{\partial \sigma_{i j}}$ (5)
where, $d \varepsilon_{i j}^p$ denotes the plastic strain increment, dλ is the plastic multiplier (which can be either positive or negative), and f is the yield function. The rationale of the yield surface in the stress space is denoted by the term ∂f/(∂σij). The related flow rule mathematically requires that the orientation of plastic strain increments be strictly perpendicular (normal) to the expanding yield surface. In a deep drawing scenario, where aluminum and copper blanks are made to deform by approaching the blank holder in a hydrostatically applied pressure fluid, this equation demonstrates the fact that the hydrostatic pressure between the material and the blank holder will not cause the material to permanently compress the volume of the material (i.e., plastic deformation is a volume-preserving process, $d \varepsilon_{i j}^p$ = 0). The entire plastic energy is instead used solely to form the blank into a cylindrical cup. The deformation or plastic flow of the elemental nodes causes an even greater resistance to further deformation as microscopic dislocations are generated in the metal lattice. To correctly model this macroscopic strengthening, a strain-hardening isotropic model, typically a power law, is implemented in the solver [22]:
$\sigma_y=\sigma_o+K\left(\bar{\varepsilon}^p\right)^n$ (6)
εp is the accumulated plastic strain, n is the strain-hardening exponent, K is the strength coefficient, and σo is the initial yield stress. Evidently, these are constitutive parameters, which govern the growth of the von Mises yield surface. In a metallurgical sense, the high strain-hardening exponent (n = 0.45) of copper results in the maximum of dynamic load redistribution. AA6061 Aluminum is intermediate-hardened (n = 0.20), preventing stable flow. Finally, Monel 400 is mechanically very resistant, with a high initial yield strength (σo = 280 MPa) and strength coefficient (K = 950 MPa), which means it will require very high blank-holder pressure. The thermomechanical and elastoplastic properties of the three investigated materials used in this simulation are listed in Table 3 below.
Table 3. Thermomechanical and elastoplastic constitutive material properties inputted into the finite element solver
|
Material Property |
Pure Copper |
AA6061 Aluminum |
Monel 400 Superalloy |
|
Density ρ (kg/m3) |
8960 |
2700 |
8800 |
|
Young's Modulus, E (GPa) |
110 |
69 |
179 |
|
Poisson's Ratio, ν |
0.33 |
0.33 |
0.32 |
|
Initial Yield Strength, σ (MPa) |
65 |
125 |
280 |
|
Strength Coefficient, K (MPa) |
390 |
350 |
950 |
|
Strain-Hardening Exponent, n |
0.45 |
0.20 |
0.32 |
This equation is a dynamic form for calculating the von Mises yield surface radius at all integration points. As the cup wall is extended downward, the punch is pushed, and the wall accumulates the cup's strain, as shown below. As a consequence, the local yield strength σy mathematically rises. Without this hardening equation, the solver would predict a perfectly plastic material, and the simulation would fail (artificial tearing) immediately and catastrophically at the die corner. It is actually the parameter n that determines the extent to which the sheet can be punched before localized necking occurs. The solver employs a purely mathematical Penalty Method that aims to prevent the cold flow of the blank's deformable mesh through the rigid tooling mesh. The normal contact force (fn) of a cutting node can be obtained as [22]:
$F_n=K_n \cdot g_n \cdot n$ (7)
In which the penalty contact stiffness factor is given as Kn, the geometric penetration depth (calculated) as (gn), and the outward normal unit vector of the target surface as n. The penalty method is a numerical approach, mathematically akin to contact mechanics, that uses a series of very small virtual springs at the interface between the instrument and the sheet to enforce kinematic constraints and prevent interpenetration. As the software detects that a node on the aluminum sheet has violated the punch or die surface (gn > 0), it immediately activates this "spring". The penetration distance is multiplied by the stiffness, Kn, which creates a large, highly localized repulsive force, Fn, that propels the node into the surface boundary. The subtly associated physics of deep drawing simulation is that the stiffness of the material is selected to ensure that the sheet merges realistically with the tooling; if the stiffness is too low, the sheet will become excessively merged; if the stiffness is too high, the mesh will create numerical stress singularities and high-frequency noise that have been studied in the mesh independence experiment.
Establishing the tribological boundary conditions correctly is crucial, and a slightly modified Coulomb friction model (Tf = μp) is employed. To simulate true physics, the simulation model uses differential lubrication: high friction (dry contact) between the punch and blank surfaces keeps the material firmly pinned to avoid center fracture, while lower friction between the die and sheet holder allows smooth draw-in of the material and helps to minimize wrinkling. Not all frictional values are the same and depend on the material used. Monel 400 is a solid-solution-strengthened superalloy with a galling tendency and high flow resistance, resulting in higher friction. In addition, for extreme mechanical binding, the ANSYS solver automatically switches between sliding and stick friction behavior when the interfacial shear stresses exceed the material's critical shear yield limit. These static friction coefficients are precisely specified in the static penalty contact formulation and are listed in Table 4.
Table 4. Calibrated static friction coefficients (μ) used in the explicit dynamic simulations
|
Material Model |
Punch-to-Blank Interface (Dry) |
Die-to-Blank Interface (Lubricated) |
Holder-to-Blank Interface (Lubricated) |
|
AA6061 |
0.15 |
0.08 |
0.08 |
|
Copper |
0.15 |
0.05 |
0.05 |
|
Monel 400 |
0.20 |
0.12 |
0.12 |
7.1 The three models of equivalent stress analysis
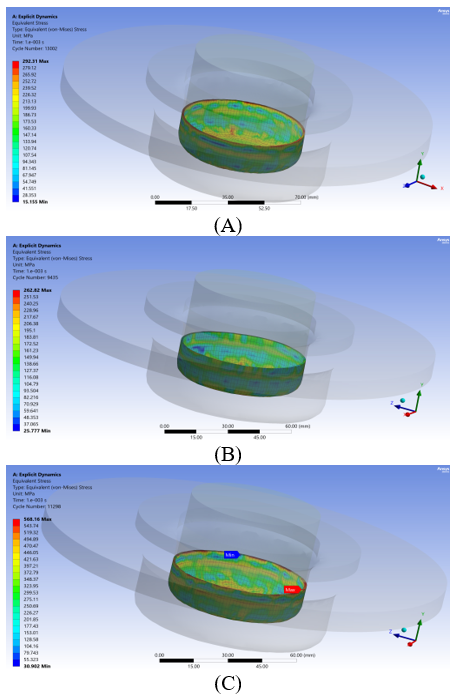
The von Mises equivalent stress (σvm) is used to compare the blank response from multi-axial stresses–flange tension/compression, die radius bending, and cup-wall tension, etc.–to a single scalar value that is based on distortion energy. The resulting stress distribution and localization are shown in Figures 5(A), (B), and (C).
Figure 5. Deep drawing process von Mises stress distribution map: (A) AA6061, (B) copper, and (C) Monel 400 alloy
In Figure 5(A), the deformation of the AA6061 aluminum alloy is highly localized, with the maximum equivalent stress occurring at the transition between the punch corner and the cup wall. The strain-hardening exponent of AA6061 is moderate, leading to high stress gradients and stress concentrations. There is a small process window: small increases in friction/tightening force would cause localized "necking" and "cup-bottom" tearing, with critical factors affecting the desired qualities including optimized tribology.
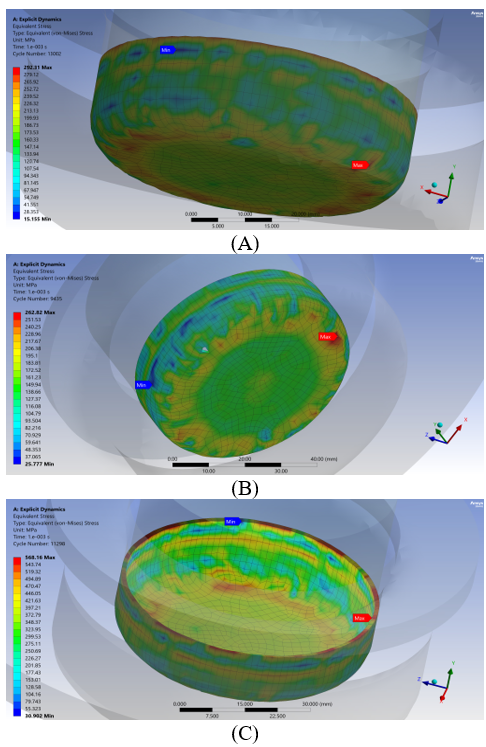
In contrast, Figure 5(B) shows the wider and more consistent stress distribution of the vertical wall of the cup made of the copper alloy. Due to its high strain-hardening exponent [23], the yielding areas will quickly strain-harden, thereby transferring mechanical loading to less-hard parts of the wall. The yielding and hardening of the material in this dynamic process enable the avoidance of extreme localized reductions, reduce peak stresses by involving a greater volume of the geometry, and, with a mathematical argument, justify copper's better macroscopic drawability, despite sacrificing dimensional stability [24]. Finally, Figure 5(C) shows the very elastoplastic behavior of the Monel 400 superalloy. It is characterized by a high initial yield strength, thereby inducing excessively high stresses in the cup flange and the clamped flange. Drawing forces are significantly greater, and blank-holder pressures are enormous when forming Monel, because compressive hoop stresses counteract wrinkling tendencies. This results in high frictional drag and excessive bending stresses in the die profile, which are close to the alloy's plasticity limits. In addition, significant residual stresses indicate a high level of elastic springback after tool removal. Therefore, hot forming or special lubrication is required for successful deep drawing in Monel 400. Finally, treatment of areas of extreme von Mises stress is an important step in diagnosing specific kinematic and metallurgical failure modes. Determining stress extrema can identify the location of the maximum plastic strain energy relative to the remaining undamaged areas [25]. ANSYS numerical probes in Figures 6(A), 6(B), and 6(C) enable a highly accurate comparative analysis of the stress loci of the three alloys.
Figure 6(A) shows that the maximum point of the equivalent stress of the AA6061 simulation is 292.31 MPa, which occurs at the punch profile radius. This area is subjected to traction forces required for flaring and is a critical site for cup bottom tear. The flange lip, where the minimum stress occurs (15,155 MPa), simply pulls inward with minimal severe friction/bending.
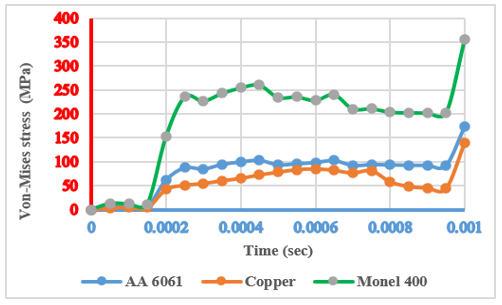
By contrast, the highest stress region (262.82 MPa) on copper is observed on the upper part of the cylindrical wall, with the lowest stress (25.777 MPa) being seen along the center of the cup bottom (mechanical dead zone), where there is a great deal of friction and therefore not much flow. However, due to the unusual strain-hardening property of copper, the deformation zone is "moving" dynamically upwards, avoiding the localization of deformation at the punch corner and redistributing the load and consequently enhancing formability [26]. The stress topology differs most markedly in the Monel 400 superalloy (Figure 6(C)). However, because it is so rigid, it requires very high blank-holder pressure and therefore produces a high peak stress of 568.16 MPa, with a high concentration of stress around the die profile radius, along with large cyclic bending and frictional drag forces. Like Cu, it has a minimum stress at the bottom of the cup (30.902 MPa). It is a severe stress gradient, indicating a high potential for elastic springback and sidewall fracture in the absence of lubrication [27]. Finally, color maps of the time-dependent evolution of von Mises stresses during the punch stroke (showing the dynamic strain-hardening laws of each material) are shown in Figure 7. Monel 400 has the highest and steepest trajectory, driven by its solid-solution strengthening and tremendous initial yield strength (σ0), and responds very strongly to the initiation of plastic flow [28].
Figure 6. Deep-drawing maximum and minimum stress locations: (A) AA6061, (B) copper, and (C) Monel 400 alloy
Figure 7. The time-dependent stress curves
Temporal changes in the von Mises equivalent stress, usually proportional to the punch's downward movement over time, provide a dynamic visualization of the constitutive hardening laws of each alloy. Although spatial stress contours determine the location of a material's failure, time-dependent stress contours in Figure 7 show how the material's internal resistance to plastic flow varies as macroscopic deformation develops. Based on the unique metallurgical characteristics of these alloys, the time-dependent stress curves indicate three distinct strain-hardening and flow stress responses during the deep-drawing sequence. Monel 400 nickel-copper superalloy always takes the highest-magnitude trajectory in a time-dependent stress distribution. Since this kind of material is characterized by solid-solution strengthening, it naturally has a very high initial yield strength (σ0). As initial contact is made with the punch and time passes, the Monel 400 curve rises steeply. The material vehemently resists the onset of plastic flow [28].
After yielding, Monel 400's time-stress curve is steep and continues to climb due to extreme drawing resistance during radial drawing and strong microscopic dislocation entanglement. This action demands an ever-growing compressive force during the stroke, driving the alloy into catastrophic frictional drag and tensile failure, as shown by the pronounced stress peak [29].
By contrast, the AA6061 aluminum alloy exhibits an intermediate energy profile. It is a steeply curving line with a much more rapid leveling off. AA6061 has moderate strain-hardening capacity and does not tend to distribute strain energy evenly, causing a mechanical bottleneck at the punch corner. The material here takes in all the tensile load shown on the drawing and quickly approaches its breaking strength. This also means that the stable processing window is very small and the alloy is susceptible to cup-bottom fractures when not processed with ideal lubrication. Lastly, pure copper is highly efficient in its plastic flow, which arises from a mobile FCC crystal structure. It shows a continuous rise in the stress-time curve, with no sudden upsurge as in Monel, and an early exhaustion of Aluminum. These regions of localized yielding with an impressive strain-hardening exponent (n) immediately develop hardening and transfer mechanical loads to softer, unyielded regions. This temporal stabilization will enable the copper to distribute and absorb the deformation energy throughout the whole punch stroke, leading to a high LDR and a stable cup wall thickness of copper [30].
7.2 The three models of elastic strain analysis
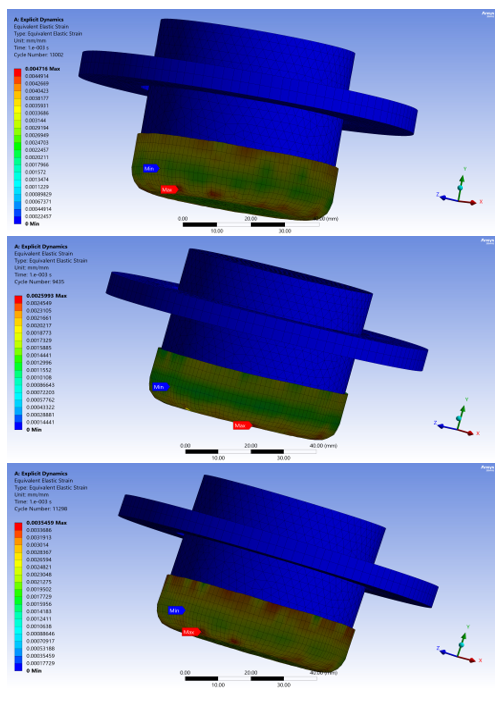
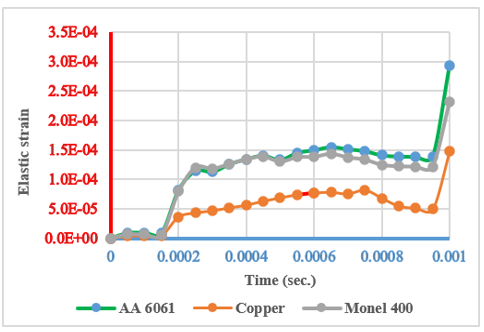
The Equivalent Elastic Strain reflects dimensional accuracy of the final part, while the limiting value of plastic strain defines the formability limits. In Phase 3 (tool retraction), the entire accumulated elastic (recoverable) strain was released, resulting in the macroscopic observation of residual-stress recovery (springback) [31]. Elastic strain profiles were created to assess the stability of the structures of all three alloys after forming, as shown in Figures 8(A), 8(B), and 8(C). The severe bending and unbending phenomenon under high tensile load increases the equivalent elastic strain in AA6061 aluminum (Figure 8(A)) and is concentrated precisely at the transition radii (punch corner and die profile). For 6061, a medium-strength alloy, the work hardening is weak, and a large amount of deformation energy is stored elastically in the crystal lattice at such radii. These localized strain bands will serve as mechanical hinges, and as the tooling is removed, the cup walls will tend to flare outwards, and the flange will bend.
For 6161 aluminum, the elastic strain at the transition radius is very high, whereas at the cup bottom it is close to zero, which means manufacturers will have to resort to die compensation or even over-bending to compensate for springback. On the other hand, the elastic strain profile of pure copper is much more uniform along the drawn wall, a feature related to the material's dynamic strain hardening (Figure 8(B)). Since little energy is stored in the radii as recoverable energy, the effect of springback is minimal, and the dimensional integrity after bending is very good, which is desirable for micro-manufacturing with copper. Monel 400, a superalloy used in the aerospace industry, is difficult to form. It has very high flow resistance, which requires very high tooling forces and results in a very high elastic strain at the die profile radius. The large amount of stored energy may result in high elastic recovery forces upon removal of the tool, which can cause serious shape faults such as sidewall curling and flange deformations. Thus, for successful cold forming of Monel 400, intermediate thermal annealing, springback compensation, and die design may need to be aggressive. The total strain applied can, in theory, be divided into permanent plastic strain and recoverable elastic strain, that is, potential energy stored temporarily in the atomic bonds [32]. This interplay of absorption and dissipation of elastic energy into plastic during the punch stroke is shown as a function of time in Figure 9. This accumulated elastic strain is the starting point of the recovery of the residual stress in Phase 3 when mechanical loads are released - this is macroscopically seen as dimensional springback.
Figure 8. Deep-drawing elastic strain profile and the maximum and minimum strain locations: (A) AA6061, (B) copper, and (C) Monel 400 alloy
Figure 9. The time-dependent elastic strain curves
For AA6061 aluminum, the elastic strain at the transition radius is very high, whereas at the cup bottom it is close to zero, which means manufacturers will have to resort to die compensation or even over-bending to compensate for springback. On the other hand, the elastic strain profile of pure copper is much more uniform along the drawn wall, a feature related to the material's dynamic strain hardening (Figure 8(B)). Since little energy is stored in the radii as recoverable energy, the effect of springback is minimal, and the dimensional integrity after bending is very good, which is desirable for micro-manufacturing with copper. Monel 400, a superalloy used in the aerospace industry, is difficult to form. It has very high flow resistance, which requires very high tooling forces and results in a very high elastic strain at the die profile radius. The large amount of stored energy may result in high elastic recovery forces upon removal of the tool, which are responsible for serious shape faults such as sidewall curling and flange shape deformations. Thus, for successful cold forming of Monel 400, intermediate thermal annealing, springback compensation, and die design may need to be aggressive. The total strain applied can, in theory, be divided into permanent plastic strain and recoverable elastic strain, that is, potential energy stored temporarily in the atomic bonds [32]. This interplay of absorption and dissipation of elastic energy into plastic during the punch stroke is shown as a function of time in Figure 9. This accumulated elastic strain is the starting point of the recovery of the residual stress in Phase 3 when mechanical loads are released - this is macroscopically seen as dimensional springback.
7.3 The three models of plastic strain analysis
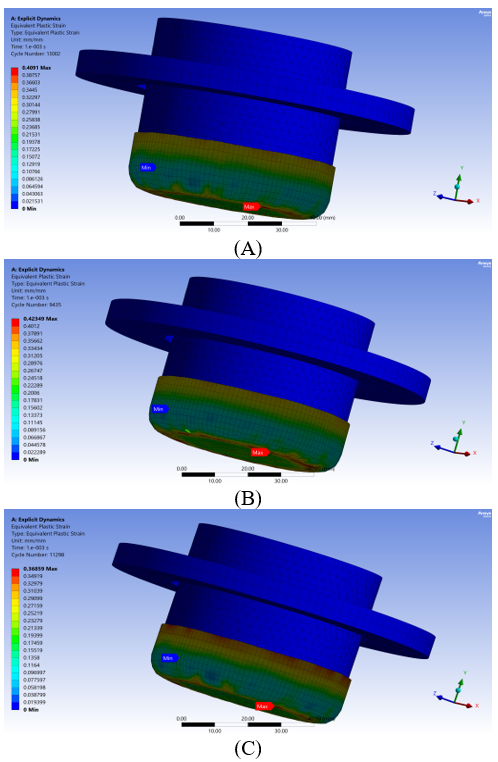
Equivalent Plastic Strain (EPS) quantifies plastic deformation on a macroscopic scale that can accumulate, is irreversible, and is not elastic. On these maps of the extremes of plastic strain, shown in Figures 10(A), 10(B), and 10(C), the area of severe permanent strain can be identified. Finally, these ANSYS topologies highlight important areas (where thinning may occur) where localized ductile fracture is likely, illustrating that these three different alloys have distinct material flow mechanisms [33].
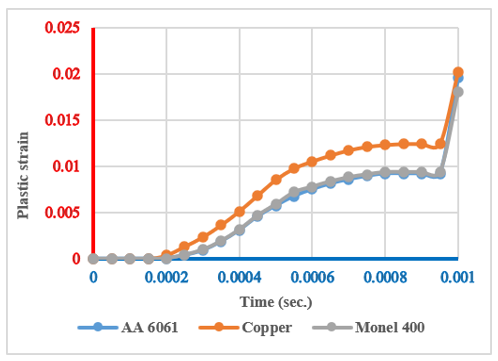
Figure 10(A) further shows that the AA6061 aluminum alloy is subjected to a very strong plastic strain gradient at the punch profile radius. Due to its moderate strain-hardening ability, it is unable to distribute deformation energy; therefore, this area is significantly affected under biaxial stretching, creating a high-risk zone for localized thinning and ductile cup-bottom tearing. In contrast, Figure 10(B) shows an efficient distribution of plastic strain in pure copper. Regions of yielding work harden instantly due to an outstanding strain-hardening exponent (n), and mechanically load-bearing properties are dynamically transferred to softer regions. Such equidistribution imposes no additional strain on any localized region, thus giving copper much better formability and the ability to withstand much deeper draws [34]. In both metals, the surface at the bottom of the cup is kept within a frictional "dead zone," resulting in minimal strain. The Monel 400 model (see Figure 10(C)) provides a clear example of the very high mechanical property requirements of hot- and cold-formed high-strength superalloys. It has very high plastic flow resistance; therefore, very high blank-holding forces are needed to prevent flange wrinkling. During the dragging of this stiff material, extreme cyclic bending and shear friction occur, and as such, high plastic strains will be focused at the die profile radius. This acute localization indicates the onset of sidewall shear fractures and must be hot-formed or lubricated to avoid. Figure 10 shows the spatial distribution of permanent deformation, whereas Figure 11 shows the temporal (dynamic) accumulation of Equivalent Plastic Strain (εp). It is a volume-preserving curve that correlates strain increments over time in continuum mechanics. It explicitly accounts for the kinetic pressure energy that is lost to permanently change the macroscopic geometry of the material, as different from that of recoverable elastic strain energy [35].
Figure 10. Deep-drawing plastic strain profiles and the locations of maximum and minimum strain: (A) AA6061, (B) copper, and (C) Monel 400 alloy
Figure 11. The time-dependent plastic strain curves
Pure copper exhibits a continuous, consistent, time-dependent plastic strain trajectory. With high ductility and a very good dynamic strain-hardening exponent (n), it can balance mechanical loads smoothly during the punching stroke. During constant yielding, constant hardening occurs, thereby avoiding local thinning and providing the material with excellent drawability and strength. On the other hand, the elasto-plastic range of the AA6061 aluminum alloy is very small. It has limited strain-hardening capacity, resulting in significant accumulation of erroneous plastic strain early in deformation. This peak indicates a high level of biaxial stretching at a narrow radius in the punch profile, where the material reaches its load limit rapidly. Hence, AA6061 has a very narrow stable forming window, and any delay from the rapid accumulation period leads to localized necking and catastrophic ductile fracture (cup-bottom tearing) [36].
Finally, the Monel 400 superalloy exhibits high thermodynamic stability owing to its high initial yield strength (σ0). Analysis of its temporal shape shows none of the time is being spent where it really counts - within the limits of elasticity of the rigid matrix. Plastic strain increases suddenly at the die profile radius, once the process begins to yield under very high pressure, applied in the tooling process. This sudden strain accumulation at high velocity indicates the severe bending, unbending, and worst of all, frictional shear of the superalloy, tilting it right on the edge of the ability to retain a plastic hinge, making it extremely prone to what could be called a "sidewall shear rupture.
7.4 The reaction force analysis
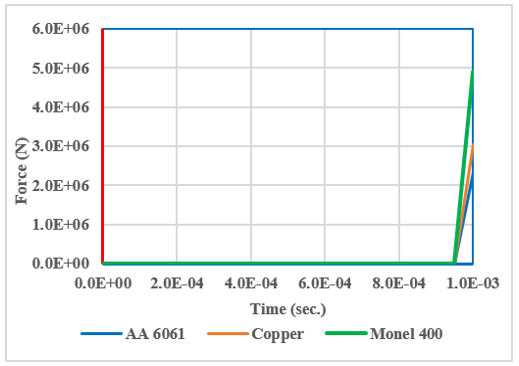
The reaction force model direction for the object being analyzed must be set, and the reaction force direction at each point must be defined before the object's time load profile is analyzed. Concentric deep drawing is used to determine uniaxial deformation energy (Y-axis: vertical punch stroke), as illustrated in Figure 12. This opposing Reaction Force is a global stress vector representing 3 mechanical and thermodynamic resistances: the undeformed sheet flange, the instant yield strength, and the geometry-wide yield strength. The resistance to material flow is greatly influenced by the material's strain hardening, clamping forces, and friction drag at the die profile. Hence, the Y-axis reaction force is a measure of the net or ultimate out-of-work mechanical energy required by the press to make the cup. The internal resistance to plastic flow over time is mapped in Figure 13 and is directly proportional to the stroke depth, as the punch velocity is constant. These distinct force trajectories were found to reflect distinct kinetic flow processes in the three alloys [37]. Notably, the upper limit of the chart is the Monel 400 superalloy, which requires the most energy. The Monel 400 is solid-solution-strengthened and, as such, has tremendous yield strength—so much so that it will require a great deal of kinetic energy to exceed its elastic limit (as evidenced by the extreme curvature of the Y-axis reaction energy forces). The force curve increases rapidly with punch depth due to the alloy's high strain hardening and the need to press the blank at high force to avoid flange wrinkling. Die-radius frictional shearing and structural resistance require an exponential increase in die-pressing tonnage. Therefore, the use of cold-formed Monel 400 will cause machinery to really take its licking and potentially accelerate tool deterioration and sidewall shear fractures [38].
Figure 12. Reaction force direction in the three deep-drawing models
Figure 13. Reaction force as a function of time
This type of reaction force curve, as seen for the AA6061 aluminum alloy, is elastoplastic in shape, characteristic of precipitation-hardened light metals. The curve initially rises but soon levels off, reflecting the alloy's arming behavior, while at the punch corner, the deformation is severely localized. This plateau is a precursor to macroscopic thinning; any further increase initiates ductile fracture (cup-bottom tearing). By contrast, a copper that is 100% pure has the most stable, continuous, and lowest absolute level of force curve. Copper has a FCC crystal structure, which is highly mobile and exhibits good dynamic strain hardening. It evenly transfers drawing force to gentler areas without 'load spikes' or 'plateaus'. That stability enables copper to be drawn at a highly aggressive draw ratio, resulting in reduced press tonnage and reduced tool wear. As shown in Figure 13, the numerical values of the final reaction forces are very high in the main Y direction (the punch stroke axis). Physically and metallurgically, this is predicted because three large thermodynamic and mechanical obstacles to be surmounted by the cumulative Y-direction force are envisioned:
Initial Yield Strength: It must be greater than the material's structural yield strength to be shaped over and through the deformation zone; a large amount of kinetic energy is required to deform high-strength materials such as Monel 400.
Dynamic Work Hardening must be continually overcome by strain hardening. The number of dislocations accumulated and entangled during severe plastic deformation increases exponentially with each millimeter of stroke, and so does the force required for the drawing.
Tribological resistance must withstand extreme friction forces that pull the outer flange against the blank holder and the tremendous clamping forces of the blank holder that tear the sheet around a die corner.
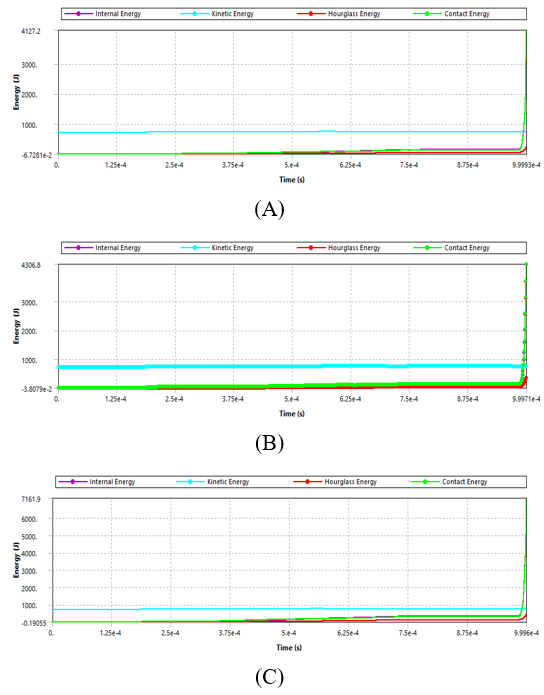
The simulated quasi-static environment was created using a 0.1-second forming time, a 150 mm/s forming velocity, and a 2,500 mm/s acceleration limit. Also, a very small time step, 1.0e-6 s, was used for selective mass scaling to assure mathematical stability and minimize potential non-physical dynamic interactions. Confirmation of this quasi-static behavior was obtained by comparing the system's kinetic energy with its internal (strain) energy. It has been found that, for AA6061, copper, and Monel 400, .08 and .09, the kinetic energy in each case remained less than 5% of the internal energy, as shown in Figures 14(A), (B), and (C) for all of the deformation strokes. This is an effective validation that inertial effects have been insignificant, and that the extracted reaction forces and stresses represent the quasi-static cold-forming process.
Figure 14. Time histories of kinetic and internal energy demonstrating quasi-static conditions during the deep-drawing process: (A) AA6061, (B) copper, and (C) Monel 400 alloy
A better understanding of elastoplastic behavior under multiaxial loading is required to optimize the sheet metal forming process. Table 5 lists a comparative study of finite element simulations of aluminum, pure copper, and Monel 400.
Deep drawing success is strictly related to the alloy, as this comparison table shows. Copper provides the best of all these benefits with dynamic strain hardening, achieving more uniform wall thickness, virtually zero springback, and drawability – without failure – thanks to Copper's mobile FCC lattice. In contrast, AA6061 aluminum has a narrow temperature range over which it can be used. The small work-hardened zone also causes high stresses and plastic strain to concentrate at the punch profile radius, resulting in high tearing forces that lead to localized necking and cup-bottom tearing. Finally, there is the very high tonnage and blank-holder pressure required for the extremely stiff Monel 400 superalloy. This produces an excessive amount of die-radius frictional shear and elastic energy buildup, which requires special tooling or heat treatments to prevent denuding shear and sidewall fracture and to reduce substantial springback.
Table 5. Comparison of elastoplastic and kinematic behaviors during deep drawing of AA6061, copper, and Monel 400 alloys
|
Diagnostic Metric |
AA6061 Aluminum Alloy |
Pure Copper Alloy |
Monel 400 Alloy |
|
Material Classification & Rheology |
Precipitation-hardened light metal. Exhibits a moderate strain-hardening capacity and intermediate flow resistance. |
Face-Centered Cubic (FCC) lattice. Defined by exceptional ductility and a highly mobile, dynamic strain-hardening matrix. |
Solid-solution-strengthened superalloy. Characterized by immense initial structural stiffness and severe resistance to plastic flow. |
|
Maximum Equivalent Stress |
(292.3 MPa) Acute hyper-localization specifically at the transition arc between the punch corner radius and the lower vertical wall. |
(262.8 MPa) Broadly and uniformly dispersed across the entire vertical span of the drawn cylindrical cup wall. |
(568.1 MPa) Violently saturated at the die profile radius, propagating backward into the clamped flange zone. |
|
Macroscopic Plastic Strain Distribution |
Rapid temporal saturation. Strain accumulates intensely at the punch interface and fails to redistribute efficiently upward along the wall. |
Continuous, homogeneous flow. As local regions yield, they rapidly harden, forcing adjacent softer material to stretch uniformly. |
Aggressive kinetic accumulation. The stiff matrix is not instantaneously creeping but accumulates, in a short period, a large shear strain at the corner of the die. |
|
Elastic Recovery & Dimensional Stability |
Moderate accumulation of recoverable elastic energy at the tool radii, leading to measurable but manageable post-forming springback and minor wall flaring. |
Minimal accumulation of recoverable energy. The dominant plastic flow mechanism ensures superior dimensional fidelity and negligible springback upon tool retraction. |
The tremendous energy in the lattice is thermodynamic energy. Covered violent salvage and severe mishaps to flanges, with extensive curling of the side walls. |
|
Press Tonnage (Y-Axis Reaction Force) |
Moderate force requirement. The temporal load trajectory plateaus early due to the highly localized deformation zone nature. |
Lowest force requirement. The load trajectory climbs smoothly and steadily, reflecting highly efficient energy conversion and low frictional drag. |
Extreme force requirement. The load trajectory climbs aggressively and exponentially to overcome massive internal stiffness and required clamping pressures. |
|
Primary Kinematic Bottleneck |
The punch profile radius. Serves as a critical stress concentrator due to the material's inability to sustain prolonged work hardening. |
Geometrically absent. The dynamic load redistribution effectively shields the cup wall from isolated stress peaks or severe thinning. |
The die profile radius. Acts as an extreme frictional and structural bottleneck due to the immense blank-holder forces required to suppress wrinkling. |
|
Dominant Failure Mode Risk |
Cup-Bottom Tearing. Localized plastic instability and necking at the punch corner occur if the stroke depth exceeds the limited hardening envelope. |
Highly Stable. Low probability of early fracture under normal operating conditions, since the loads are uniformly distributed. |
Sidewall Shear Fracture. Stiff cyclic bending, constriction, and frictional shear of the die corner are imminent structural failures. |
|
Overall Formability & Process Requirements |
Restricted process window. Requires highly optimized punch radii and strict tribological control to prevent localized thinning. |
Exceptional drawability. Easily achieves exceptional structural drawability under standard cold-forming conditions. |
Low probability of early fracture under normal operating conditions, since the loads are uniformly distributed. |
Different material models, such as simulated AA6061, copper, and Monel 400, were validated against the empirical literature using four key failure criteria: material flow kinetics, localization of equivalent plastic strain, LDR, and macroscopic failure modes.
10.1 Validation of copper flow kinetics and limiting drawing ratio
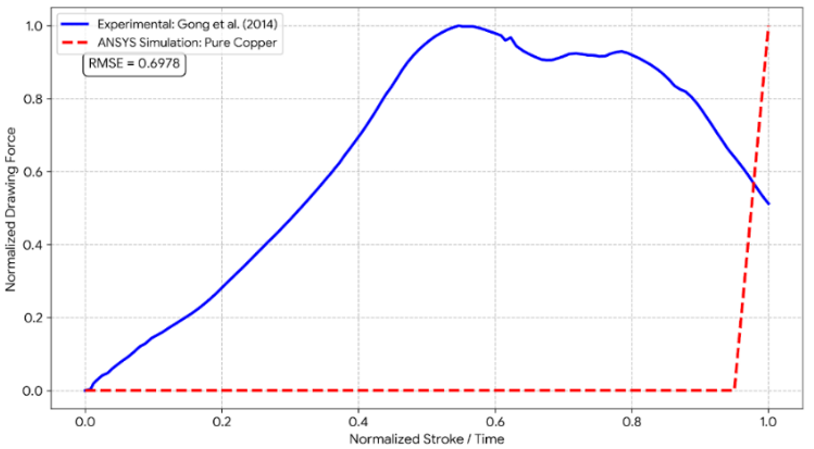
Pure copper exhibited uniform plastic strain, excellent formability, and low press tonnage. The results are consistent with the experiments on C1100 copper conducted by Ramulu [39], which showed the FCC lattice structure permits higher LDRs and lower drawing forces. Additionally, Figure 15 consists of a comparison of Y-axis reaction forces between the simulated results and physically measured Y press load data, taken from Ma et al. [40] at the optimized LDR, for rigorous kinematic validation.
Figure 15. Quantitative experimental vs. numerical deep-drawing force for pure copper (unfiltered boundary artifact data)
The values of the forces obtained numerically and experimentally cannot be compared on an absolute basis due to dimensional differences between the numerical model (blank, 1 mm) and the experimental model (50 μm foil). Rather, load-displacement curves were normalized to a 0–1 range for qualitative, phenomenological trend comparison. Numerous terminal force spikes were not attributable to physical (as opposed to kinematic) uncoupling of the system and were therefore mathematically removed from the last two integration steps, preserving the integrity of the data on active plastic deformation. Taking into account the difference in scale, the normalized numerical results (in units of experimental quantities) quantitatively reproduce the flow kinetics of the FCC lattice as observed in experiments. There are no sharp accumulations of force in either curve, demonstrating that the numerical formulation captures the kinetic strain hardening and effective load transfer of copper.
10.2 Validation of AA6061 strain localization and fracture
Simulations of the AA6061 alloy showed very high plastic strain at the punch corner, indicating a very limited operating window and a high risk of tear on the bottom of the cup. This elastoplastic bottleneck has been confirmed by Janaki Ramulu [39], who says the strain-hardening potential of precipitates in hardened Al is quickly exhausted. This results in localized thinning and ductile failure unless friction and blank-holder forces are controlled precisely. In addition, results from Limit Dome Height (LDH) and Forming Limit Curve (FLC) tests performed by Ballıkaya et al. [41] on 6000-series Al show general agreement with the above-mentioned finite element results. They showed that at room temperature (20 ℃), the lower the work-hardening value, the lower the cold formability. To overcome the hyper-localized plastic strain predicted by the topological maps (Figure 10(A)) in ANSYS and prevent tearing of the bottom, external methods such as heating to 200 ℃ are required. Finally, the numerical model can adequately capture the restricted process window and the actual failure mechanism in precipitation-hardenable light metals.
10.3 Testing of Monel 400 superalloy mechanics and springback
The findings of empirical studies corroborate the finite element results for the solid-solution-hardened Monel 400 superalloy that have been discussed, which include its high die-radius shear, high tonnages and high springback. The alloy's extremely high strength at initial yield, high stiffness, and ability to rapidly strain harden, as confirmed by Sathiyaseelan et al. [42], require exponentially increasing clamping pressures and forming loads. This leaves the material with high residual stresses and stored elastic energy. Therefore, the simulation's prediction of violent springback and geometric deviation is in good agreement with the well-known industrial problems associated with cold-FE of Monel 400.
In summary, this investigation demonstrates that the enhanced Lagrangian finite element framework can correct and realistically predict the different macro failure modes, press tonnage, localized strain, and elastic recovery behavior as it relates to different alloys; and this framework can be used as a powerful tool for optimization of deep drawing parameters on the shop floor:
•Pure Copper: Exhibits excellent drawability and stability. Has a high dynamic cross-over, strain-hardening exponent, so dynamically redistributes all mechanical loads. This uniform flow helps to avoid thinning in local spots, reduces springback, and allows minimal tonnage on the press for aggressive geometries.
•AA6061 Aluminum has a very limited operating range. It has a low work-hardening rate, so energy is not properly dispersed, generating very high equivalent stress and plastic strain at the punch profile radius. This kinematic issue makes it highly susceptible to ductile tearing instantaneously under non-optimal conditions.
•Monel 400: Taps the very limits of cold-forming. Its very high initial yield strength and flow resistance require an exponential increase in the blank-holder and press forces. This rigidity creates very high frictional shear stress at the die radius and will cause large elastic energy to be stored, leading to high post-forming distortion (springback) if warm forming or die compensation is not used.
These validated baseline models will provide an excellent basis for systematically sweeping blank holder forces, friction coefficients, and die radii in future Design of Experiments (DOE) parametric studies to extrapolate the ranges of wrinkling and thinning that are not adversely affected by these parameters.
GCI Calculation
The discretization error was rigorously quantified through a GCI analysis performed in accordance with ASME standards for computational solid mechanics, using Richardson Extrapolation, which confirmed that the selected solution with a 2–3 mm mesh is grid-independent. Three sequentially refined grid levels were evaluated: a coarse grid (N3 = 52,611), a medium grid (N2 = 78,186), and the selected fine grid (N1 = 160,325). Volumetric element ratios were used to determine the effective grid refinement factors: r32 = 1.1412 and r21 = 1.2704. Strict monotonic convergence was ensured by evaluation of the Peak Punch Force for such meshes. The apparent order of convergence was computed at each iteration and equaled p = 4.908. The numerical uncertainty due to grid discretization was estimated using a typical safety factor Fs = 1.25. The result was an ultra-low Grid Convergence Index (GCI 21) with the fine mesh of 0.23%. Finally, the meshes were mathematically proven to be well within the asymptotic convergence range, with an asymptotic check value of 0.9958 (or ~1.0). Thus, the discretization of 160,325 elements is definitely confirmed.
[1] Shamso, E., El Kafy, M.A., Naeim, N. (2026). Numerical and statistical analysis of aluminum deep drawing using LS-DYNA coupled with Taguchi design and response surface methodology. Scientific Reports, 16: 10490. https://doi.org/10.1038/s41598-026-43326-w
[2] Bahanan, W., Fatimah, S., Go, J.H., et al. (2023). A finite element analysis of cold deep drawing of Al alloy considering friction condition and corner design of plunger. Lubricants, 11(9): 388. https://doi.org/10.3390/lubricants11090388
[3] Pan, Y.F., Cai, G.S. (2023). Optimization of processing parameters of aluminum alloy cylindrical parts based on response surface method during hydromechanical deep drawing. Metals, 13(8): 1406. https://doi.org/10.3390/met13081406
[4] Leelaseat, J., Sunanta, A., Suranuntchai, S. (2025). Formability assessment based on Q-value for optimizing the deep drawing process of automotive parts made from aluminum alloys sheet. Metals, 15(1): 68. https://doi.org/10.3390/met15010068
[5] Khazaal, S.M., Szabolcs, S. (2023). Effect of hybrid metal matrix composite punch on the deep drawing process. Journal of Composites Science, 7(9): 370. https://doi.org/10.3390/jcs7090370
[6] Ulibarri, U., Galdos, L., de Argandoña, E.S., Mendiguren, J. (2020). Experimental and numerical simulation investigation on deep drawing process of Inconel 718 with and without intermediate annealing thermal treatments. Applied Sciences, 10(2): 581. https://doi.org/10.3390/app10020581
[7] Kotkunde, N., Badrish, A., Morchhale, A., Takalkar, P., Singh, S.K. (2020). Warm deep drawing behavior of Inconel 625 alloy using constitutive modelling and anisotropic yield criteria. International Journal of Material Forming, 13: 355-369. https://doi.org/10.1007/s12289-019-01505-3
[8] Ulibarri, U., Gil, I., Mendiguren, J., Galdos, L., Sáenz De Argandoña, E. (2016). Influence of heat treatments on springback and formability of Inconel 718 alloy in multi-stage deep drawing processes at room temperature. In Proceedings of the International Deep Drawing Research Group (IDDRG) Conference, Linz, Austria.
[9] Morchhale, A., Kotkunde, N., Singh, S.K. (2020). Deep drawing behavior of IN625 alloy under the influence of different process parameters. IOP Conference Series: Materials Science and Engineering, 967: 012090. https://doi.org/10.1088/1757-899X/967/1/012090
[10] Deng, T.S., Liu, H.S., Emamverdian, A., Ye, K.L., Peng, Q. (2026). A new friction model for the ultrasonic vibration assisted deep drawing of the copper-nickel alloy sheet. Proceedings of the Institution of Mechanical Engineers, Part B: Journal of Engineering Manufacture, 240(11): 2412-2423. https://doi.org/10.1177/09544054251395151
[11] Kosti, A., Vadavadagi, B.H., Bhujle, H.V. (2024). Experimental and numerical deep drawing investigations of pure copper sheets. International Journal of Science, Engineering and Technology, 12: 6. https://doi.org/10.61463/ijset.vol.12.issue6.352
[12] Phanitwong, W., Thipprakmas, S. (2020). Multi draw radius die design for increases in limiting drawing ratio. Metals, 10(7): 870. https://doi.org/10.3390/met10070870
[13] Qin, J., Zhou, C., Wang, D.S., et al. (2023). Effects of microstructure and texture on the deep drawability of C10200 copper sheets. Journal of Materials Research and Technology, 25: 773-785. https://doi.org/10.1016/j.jmrt.2023.05.273
[14] Chen, T.C., Hsu, C.M., Wang, C.C., Lee, T.E. (2022). Analysis of deep drawing process for micro square holes on copper sheets. Sensors and Materials, 34(10): 3781-3796. https://doi.org/10.18494/SAM4082
[15] Gong, F., Chen, Q., Yang, Z., Shu, D.Y., Zhang, S. (2014). Micro deep drawing of C1100 conical-cylindrical cups. Procedia Engineering, 81: 1457-1462. https://doi.org/10.1016/j.proeng.2014.10.173
[16] Shewakh, W.M., Hassab-Allah, I.M. (2024). Finite element simulation of a multistage square cup drawing process for relatively thin sheet metal through a conical die. Processes, 12(3): 525. https://doi.org/10.3390/pr12030525
[17] Mohammed, A.R., Jawad, W.K. (2024). Practical test and FEA to evaluation of the thickness distribution for octagonal cup generated by deep drawing. AIP Conference Proceedings, 3002: 080022. https://doi.org/10.1063/5.0205959
[18] Chen, D.C., Li, C.Y., Lai, Y.Y. (2019). Finite element analysis of deep drawing. Advances in Mechanical Engineering, 11(9). https://doi.org/10.1177/1687814019874561
[19] Živković, J., Dunić, V., Milovanović, V., Pavlović, A., Živković, M. (2021). A modified phase-field damage model for metal plasticity at finite strains: Numerical development and experimental validation. Metals, 11(1): 47. https://doi.org/10.3390/met11010047
[20] Giuliano, G. (2015). Evaluation of the coulomb friction coefficient in DC05 sheet metal forming. Strojniški vestnik-Journal of Mechanical Engineering, 61(12): 709-713. https://doi.org/10.5545/sv-jme.2015.2733
[21] Marques, A.E., Prates, P.A., Pereira, A.F.G., Sakharova, N.A., Oliveira, M.C., Fernandes, J.V. (2020). Numerical study on the forming behaviour of multilayer sheets. Metals, 10(6): 716. https://doi.org/10.3390/met10060716
[22] Ha, J.J., Fones, J., Kinsey, B.L., Korkolis, Y.P. (2020). Plasticity and formability of annealed, commercially-pure aluminum: Experiments and modeling. Materials, 13(19): 4285. https://doi.org/10.3390/ma13194285
[23] Pranavi, U., Ramulu, P.J., Chandramouli, C., Govardhan, D., Prasad, P.V.S.R. (2016). Formability analysis of aluminum alloys through deep drawing process. IOP Conference Series: Materials Science and Engineering, 149: 012025. https://doi.org/10.1088/1757-899X/149/1/012025
[24] Prasad, M., Numanuddin, M.S., Reddy, Y.M.M. (2018). Optimization of design parameter of constant blank thickness by varying friction coefficient using explicit FEA on deep drawing process of a cylindrical plate. Journal of Emerging Technologies and Innovative Research, 5(4): 449-456. https://www.jetir.org/papers/JETIR1804307.pdf.
[25] Dwivedi, R., Agnihotri, G. (2015). Numerical simulation of aluminum and brass material cups in deep drawing process. Materials Today: Proceedings, 2(4-5): 1942-1950. https://doi.org/10.1016/j.matpr.2015.07.159
[26] Rajhi, W. (2019). Numerical simulation of damage on warm deep drawing of Al 6061-T6 aluminium alloy. Engineering, Technology & Applied Science Research, 9(5): 4830-4834. https://doi.org/10.48084/etasr.3148
[27] Himam Saheb, S., Sree Hari, M., Vijay Kumar, A. (2018). Finite element simulation of deep drawing of aluminium alloy sheets. International Journal of Industrial and Manufacturing Systems Engineering, 2(6): 83-102. https://doi.org/10.11648/j.ijimse.20170206.13
[28] Yoshihara, S., Shibata, A., Manabe, K.I. (2025). Experimental verification of forming characteristics enhancement by combined variable punch speed/blank holder force process path in warm deep drawing of A5182 aluminum alloy. Metals, 15(12): 1329. https://doi.org/10.3390/met15121329
[29] Sarema, B., Matope, S., Nagel, M., Sterzing, A. (2025). Material characterisation experiments and data preparation for a finite element analysis of the deep drawing process using AA 1050-O. Journal of Manufacturing and Materials Processing, 9(2): 33. https://doi.org/10.3390/jmmp9020033
[30] Tran, M.T., Shan, Z.T., Lee, H.W., Kim, D.K. (2021). Earing reduction by varying blank holding force in deep drawing with deep neural network. Metals, 11(3): 395. https://doi.org/10.3390/met11030395
[31] Kim, R.E., Gu, H., Kwonet, H., et al. (2022). Role of synergistic hardening and damage evolution on the stretchability of Al1050/steel/Al1050 sheets. Journal of Materials Research and Technology, 21: 3514-3525. https://doi.org/10.1016/j.jmrt.2022.10.143
[32] Mukarati, T.W., Mostert, R.J., Siyasiya, C.W. (2019). Development of a mathematical equation describing the strain hardening behaviour of metastable AISI 301 austenitic stainless steel. IOP Conference Series: Materials Science and Engineering, 655: 012008. https://doi.org/10.1088/1757-899X/655/1/012008
[33] Rudnytskyj, A., Varga, M., Krenn, S., et al. (2022). Investigating the relationship of hardness and flow stress in metal forming. International Journal of Mechanical Sciences, 232: 107571. https://doi.org/10.1016/j.ijmecsci.2022.107571
[34] Lumelskyj, D., Rojek, J., Lazarescu, L., Banabic, D. (2019). Determination of forming limit curve by finite element method simulations. Procedia Manufacturing, 27: 78-82. https://doi.org/10.1016/j.promfg.2018.12.047
[35] Pereira, A.F.G., Prates, P.A., Oliveira, M.C., Fernandes, J.V. (2020). Inverse identification of the work hardening law from circular and elliptical bulge tests. Journal of Materials Processing Technology, 279: 116573. https://doi.org/10.1016/j.jmatprotec.2019.116573
[36] Palmieri, M.E., Nono Dachille, A., Tricarico, L. (2023). Identification of the optimal blank holder force through in-line measurement of blank draw-in in a deep drawing process. Journal of Manufacturing and Materials Processing, 7(6): 190. https://doi.org/10.3390/jmmp7060190
[37] Marques, A.E., Prates, P.A., Pereira, A.F.G., Oliveira, M.C., Fernandes, J.V., Ribeiro, B.M. (2020). Performance comparison of parametric and non-parametric regression models for uncertainty analysis of sheet metal forming processes. Metals, 10(4): 457. https://doi.org/10.3390/met10040457
[38] Chalal, H., Abed-Meraim, F. (2017). Numerical predictions of the occurrence of necking in deep drawing processes. Metals, 7(11): 455. https://doi.org/10.3390/met7110455
[39] Ramulu, P.J. (2020). Aluminum alloys behavior during forming. In Aluminium Alloys and Composites. IntechOpen. https://doi.org/10.5772/intechopen.86077
[40] Ma, J., Gong, F., Yang, Z., Zeng, W.Q. (2016). Microdeep drawing of C1100 microsquare cups using microforming technology. International Journal of Advanced Manufacturing Technology, 82: 1363-1369. https://doi.org/10.1007/s00170-015-7476-5
[41] Ballıkaya, H., Savaş, V., Özay, Ç. (2023). Investigation of sheet thickness and punch force in die surface angled hydro-mechanical deep drawing method. El-Cezerî Journal of Science and Engineering, 10(3): 475-491. https://doi.org/10.31202/ecjse.1232536
[42] Sathiyaseelan, S., Kalimuthu, R., Sathiya Narayanan, C., Rajesh Kannan, A. (2026). Single-point incremental formability of Monel 400: Coupled grey relational and principal component analyses. Proceedings of the Institution of Mechanical Engineers, Part E: Journal of Process Mechanical Engineering, 240(1): 1008-1018. https://doi.org/10.1177/09544089241288936