
Ayu Noorida Soerono* | Helmi Yazid | Yeni Januarsi | Tri Lestari
© 2026 The authors. This article is published by IIETA and is licensed under the CC BY 4.0 license (http://creativecommons.org/licenses/by/4.0/).
OPEN ACCESS
This study examines how managers' perceptions of stakeholder pressures and top management commitment (TMC) are associated with proactive environmental management (PEM) in Indonesia's chemical manufacturing industry. A quantitative cross-sectional survey was conducted using purposive sampling. Of 150 questionnaires distributed, 102 were returned, and 81 complete, eligible responses from managers with direct environmental involvement were analyzed using Partial Least Squares Structural Equation Modeling (PLS-SEM). The model explained 82.7% of the variation in PEM. Competitor pressure (COMP) and TMC were positively and significantly related to managers' PEM assessments, with TMC producing the strongest relationship. Government pressure (GP) was positive but marginal, while consumer, shareholder, and environmental activist pressure (EAP) were not statistically significant. The findings indicate that stakeholder groups do not exert equally salient influences in this setting. Reported PEM is more closely related to internal leadership support and competitive dynamics than to the other external pressures examined. The study highlights the complementary importance of TMC, competitive benchmarking, regulatory enforcement, and institutional incentives for encouraging proactive environmental practices in environmentally sensitive industries.
chemical manufacturing industry, Partial Least Squares Structural Equation Modeling, proactive environmental management, stakeholder pressure, top management commitment
Climate change, resource constraints, and increasingly visible environmental harm have altered what stakeholders expect from industrial organizations. Environmental management is therefore moving beyond regulatory compliance toward a strategic orientation that supports operational efficiency, environmental performance, and long-term organizational resilience [1-4].
This transition is especially consequential in chemical manufacturing, where energy-intensive processes, hazardous inputs, waste generation, and pollution risks expose organizations to multiple environmental demands. Proactive environmental management (PEM) addresses these risks through pollution prevention, resource efficiency, process innovation, and integrating environmental considerations into strategy and operations rather than relying on compliance alone [5-8].
Stakeholder Theory provides the broad premise that organizations must consider parties that can affect, or are affected by, their activities [9, 10]. It does not, however, require managers to give equal priority to every stakeholder claim. Stakeholder Salience Theory clarifies this prioritization by proposing that managerial attention depends on perceived power, legitimacy, and urgency [11]. Stakeholders possessing a stronger combination of these attributes are more likely to influence organizational responses.
This salience-based distinction is relevant to PEM because stakeholder groups influence managers through different mechanisms. Government agencies possess regulatory authority; consumers affect demand and reputation; shareholders influence access to capital and governance; environmental activists generate public and reputational scrutiny; and competitors reshape industry expectations. Each group's influence is therefore context-dependent and reflects how managers evaluate the strength and immediacy of its environmental claims.
Institutional Theory complements this explanation by describing how external expectations are transmitted through coercive, normative, and mimetic pressures [12, 13]. Regulation is primarily coercive, professional and societal expectations contribute to normative pressure, and competitor behavior encourages imitation. Stakeholder Salience Theory explains which claims managers prioritize, whereas Institutional Theory explains how those claims become embedded in the organizational environment.
Empirical evidence nevertheless remains mixed. Some studies associate stakeholder pressure with more substantive environmental initiatives. In contrast, others show that external demands do not automatically produce environmental improvement because organizational capabilities and institutional conditions shape the response [2, 13, 14]. This inconsistency is particularly relevant in emerging economies, where enforcement capacity, market environmental awareness, and civil-society influence may differ from the conditions commonly examined in developed economies.
Indonesia's chemical manufacturing industry offers an informative setting for examining these differences. Managers in this sector operate amid material environmental risks, evolving regulatory expectations, business-to-business market relationships, and competitive pressure to adopt recognized environmental practices. Yet evidence remains limited on how managers perceive the influence of specific stakeholder groups on PEM in this institutional context.
External demands also require an internal mechanism before they can become implemented practices. Top management determines whether environmental issues receive strategic priority, whether resources are allocated, and whether sustainability objectives are incorporated into organizational routines. Top management commitment (TMC) therefore represents an enabling capability that can translate salient stakeholder and institutional demands into proactive environmental action [1, 15-17].
Drawing on these three theoretical perspectives, this study examines whether managers' perceptions of five stakeholder pressures (government, consumer, shareholder, environmental activist, and competitor pressure (COMP)) and TMC are associated with their assessments of PEM in Indonesia's chemical manufacturing industry. The framework anticipates positive relationships while allowing their strength to differ because stakeholder salience and institutional mechanisms are not uniform across groups.
Government agencies combine formal power, legitimate environmental mandates, and potentially urgent compliance demands. These attributes can make regulatory claims salient to managers and can encourage environmental practices that extend beyond minimum compliance [12-14]. Accordingly, H1 proposes:
H1: Perceived government pressure (GP) is positively associated with managers' assessments of PEM.
H2: Perceived consumer pressure (CP) is positively associated with managers' assessments of PEM.
H3: Perceived shareholder pressure (SHP) is positively associated with managers' assessments of PEM.
H4: Perceived environmental activist pressure (EAP) is positively associated with managers' assessments of PEM.
H5: Perceived COMP is positively associated with managers' assessments of PEM.
H6: Perceived TMC is positively associated with managers' assessments of PEM.
The study contributes by establishing Stakeholder Salience Theory before hypothesis testing and by combining it with Stakeholder Theory and Institutional Theory to explain variation across sources of environmental pressure. It also distinguishes external stakeholder demands from the internal managerial commitment required to implement environmental practices. Empirically, it provides individual-level evidence from managers in an environmentally sensitive industry in an emerging economy.
This study adopted a quantitative explanatory design to examine the relationships between managers' perceptions of stakeholder pressures, TMC, and PEM. Information was obtained through a structured questionnaire completed by managers who were directly involved in, or familiar with, environmental management practices in their organizations.
The survey recorded respondents' perceptions during one data-collection period. It is therefore suitable for estimating associations among the latent constructs, but it cannot determine temporal sequence or causality. For this reason, the results are interpreted as relationships among managerial perceptions [18].
2.2 Population and sample
The population of interest consisted of managers working in chemical manufacturing firms in Banten Province, Indonesia. Chemical manufacturing was chosen because its operations are environmentally sensitive and create substantial demands for managing production-related environmental impacts.
The individual manager was the unit of observation and analysis. Each response represents one manager's assessment of stakeholder pressures, TMC, and environmental practices in the employing organization. The responses were analyzed separately and were not aggregated to the firm level; accordingly, the measures reflect managerial perceptions of organizational conditions. Purposive sampling was applied to reach managers with relevant operational, strategic, or environmental-management knowledge.
Questionnaires were distributed to 150 prospective respondents, of whom 102 returned them, producing a gross response rate of 68.0%. Returned questionnaires were checked for completeness and eligibility. An instrument was excluded if one or more questions were unanswered, the respondent was not directly involved in environmental operations, related strategic decisions, or environmental-program implementation, or both conditions occurred. Twenty-one returns met at least one exclusion condition. The screening record did not provide separate totals for incomplete and ineligible responses, so they are reported together. No missing value was imputed. The final Partial Least Squares Structural Equation Modeling (PLS-SEM) analysis used 81 complete and eligible responses, equivalent to 54.0% of all questionnaires distributed. Screening for straight-lining or statistical outliers did not remove any further cases. Table 1 summarizes the questionnaire return and data-screening process.
Participation was voluntary. Before answering the questionnaire, respondents received an explanation of the research purpose, the confidential treatment of their responses, and the exclusive use of the information for academic purposes. Informed consent was obtained before data collection.
The questionnaire items were adapted from validated instruments and adjusted to the context of Indonesia's chemical manufacturing industry. Each construct was rated on a five-point Likert scale from 1 (strongly disagree) to 5 (strongly agree).
PEM is the dependent construct and reflects voluntary environmental practices that extend beyond regulatory compliance. It covers pollution prevention, efficient resource use, process innovation, and the integration of environmental considerations into business strategy. The items were adapted from Buysse and Verbeke [5] and refined with reference to Singh et al. [6].
Stakeholder pressure refers collectively to five separate predictors: GP, CP, SHP, EAP, and COMP. Each construct records managers' perceptions of environmental demands from one external stakeholder group. Stakeholder pressure is retained for the general domain, while SHP is used only for shareholders, preventing ambiguity between the abbreviations.
TMC, the second independent variable, measures the extent of senior management's commitment to implementing environmental strategies. This construct reflects leadership commitment in establishing a sustainability vision, allocating organizational resources, fostering an environmentally oriented organizational culture, and integrating environmental considerations into strategic decision-making. The measurement items were adapted from Memon et al. [16] and Yusliza et al. [17]. Table 2 presents the operational definitions of all research variables.
Table 1. Questionnaire return and data-screening results
|
Screening Stage |
Number |
Percentage |
|
Questionnaires distributed |
150 |
100.0% |
|
Questionnaires not returned |
48 |
32.0% |
|
Questionnaires returned |
102 |
68.0% |
|
Incomplete and/or ineligible questionnaires excluded |
21 |
20.6% |
|
Complete and eligible responses retained |
81 |
54.0% |
Table 2. Operational definitions of variables
|
Variable |
Operational Definition |
References |
|
Proactive Environmental Management (PEM) |
Voluntary environmental practices that go beyond regulatory compliance through pollution prevention, resource efficiency, environmental innovation, and the integration of environmental considerations into business strategy. |
[5, 6] |
|
Government Pressure (GP) |
Perceived pressure from environmental regulations, oversight, and government policies. |
[14] |
|
Consumer Pressure (CP) |
Pressure arising from customers' environmental expectations and demand for environmentally responsible products. |
[19] |
|
Shareholder Pressure (SHP) |
Pressure from investors and shareholders regarding sustainability performance and long-term corporate value. |
[2] |
|
Environmental Activist Pressure (EAP) |
Pressure from environmental organizations and public campaigns on corporate environmental responsibility. |
[14] |
|
Competitor Pressure (COMP) |
Pressure arising from competitors' adoption of environmental strategies and sustainability practices. |
[13] |
|
Top Management Commitment (TMC) |
The commitment of top management to provide leadership, strategic direction, and organizational resources to support environmental management. |
[16, 17] |
2.4 Data analysis
The model was estimated with PLS-SEM using SmartPLS. This approach was considered appropriate because the study emphasizes prediction, includes several latent constructs, and uses a relatively modest sample [18, 20].
Analysis proceeded in two stages. The measurement model was examined first through indicator loadings, Cronbach's alpha, composite reliability (CR), average variance extracted (AVE), and the heterotrait-monotrait ratio (HTMT). Together, these criteria assess indicator performance, internal consistency, convergent validity, and discriminant validity.
The use of a self-administered questionnaire completed by a single respondent may create common method bias. This possibility was examined through full-collinearity Variance Inflation Factors (VIFs) for all latent constructs. Values below the conservative threshold of 3.3 indicate that pathological collinearity and material common method bias are unlikely [21].
The structural model was then assessed using R², f², Q²predict, the standardized root mean square residual (SRMR), and the normed fit index (NFI). Hypothesis decisions were based on the estimated path coefficients and their bootstrapped t-statistics and p-values [18, 20].
3.1 Sample overview
The final sample comprised 81 managers directly involved in environmental operations, related strategic decisions, or environmental-management implementation. Table 3 presents the demographic and professional profile of the respondents. Managers represented 44.4% of respondents, followed by superintendents (22.2%) and heads of department (21.0%). Sixty-five respondents (80.2%) had worked in their organizations for more than five years. Since every retained respondent met the environmental-involvement criterion, they were considered able to evaluate the constructs addressed in the study.
3.2 Measurement model assessment
The quality of the measurement model was assessed before interpreting the structural relationships. Following PLS-SEM recommendations, the evaluation covered indicator reliability, internal consistency, convergent validity, and discriminant validity [18, 20].
Table 3. Profile of the 81 respondents
|
Characteristic |
Category |
n |
% |
|
Managerial position |
General Manager |
1 |
1.2% |
|
|
Head of Department |
17 |
21.0% |
|
|
Manager |
36 |
44.4% |
|
|
Superintendent |
18 |
22.2% |
|
|
Section Head |
6 |
7.4% |
|
|
Supervisor |
3 |
3.7% |
|
Organizational tenure |
Less than 5 years |
16 |
19.8% |
|
|
5-10 years |
42 |
51.9% |
|
|
More than 10 years |
23 |
28.4% |
|
Environmental involvement |
Directly involved |
81 |
100.0% |
Table 4 shows that every indicator loading exceeded the recommended threshold. Cronbach's alpha and CR were also above 0.70 for all constructs, supporting satisfactory internal consistency.
All AVE values exceeded 0.50. Thus, each construct accounted for more than half of the variance in its indicators and met the criterion for convergent validity.
Full-collinearity VIFs were used to examine potential common method bias. Table 5 reports values between 1.712 and 2.426 for the seven constructs, all below the conservative limit of 3.3. The results do not indicate pathological collinearity and suggest that common method bias is unlikely to materially distort the estimated relationships [21].
Discriminant validity was evaluated with the HTMT ratio, as presented in Table 6. Every value was below 0.85, with the highest coefficient, 0.812, found between TMC and PEM.
Table 4. Measurement model assessment
|
Construct |
Item |
Outer Loading |
Cronbach's Alpha |
Composite Reliability (CR) |
Average Variance Extracted (AVE) |
|
Government Pressure (GP) |
GP1 |
0.824 |
0.818 |
0.892 |
0.734 |
|
|
GP2 |
0.885 |
|
|
|
|
|
GP3 |
0.860 |
|
|
|
|
Consumer Pressure (CP) |
CP1 |
0.916 |
0.894 |
0.934 |
0.825 |
|
|
CP2 |
0.906 |
|
|
|
|
|
CP3 |
0.903 |
|
|
|
|
Shareholder Pressure (SHP) |
SHP1 |
0.910 |
0.878 |
0.925 |
0.805 |
|
|
SHP2 |
0.902 |
|
|
|
|
|
SHP3 |
0.878 |
|
|
|
|
Environmental Activist Pressure (EAP) |
EAP1 |
0.905 |
0.857 |
0.914 |
0.779 |
|
|
EAP2 |
0.863 |
|
|
|
|
|
EAP3 |
0.880 |
|
|
|
|
Competitor Pressure (COMP) |
COMP1 |
0.905 |
0.867 |
0.919 |
0.792 |
|
|
COMP2 |
0.897 |
|
|
|
|
|
COMP3 |
0.868 |
|
|
|
|
Top Management Commitment (TMC) |
TMC1 |
0.861 |
0.827 |
0.897 |
0.744 |
|
|
TMC2 |
0.879 |
|
|
|
|
|
TMC3 |
0.846 |
|
|
|
|
Proactive Environmental Management (PEM) |
PEM1 |
0.924 |
0.873 |
0.922 |
0.797 |
|
|
PEM2 |
0.866 |
|
|
|
|
|
PEM3 |
0.888 |
|
|
|
Table 5. Full-collinearity Variance Inflation Factors (VIFs)
|
Construct |
VIF |
|
Government pressure (GP) |
1.712 |
|
Consumer pressure (CP) |
1.963 |
|
Shareholder pressure (SHP) |
2.104 |
|
Environmental activist pressure (EAP) |
2.089 |
|
Competitor pressure (COMP) |
2.172 |
|
Top management commitment (TMC) |
2.426 |
|
Proactive environmental management (PEM) |
2.379 |
Although these constructs are closely related, they capture different concepts. TMC concerns managerial commitment, strategic direction, resources, and cultural support, whereas PEM concerns environmental practices implemented beyond compliance. In theoretical terms, TMC represents antecedent commitment and PEM represents enacted practice. The statistical threshold and conceptual distinction therefore support discriminant validity [22].
Overall, the reliability and validity evidence supports the adequacy of the measurement model and allows the structural relationships to be evaluated.
Table 6. Discriminant validity using the heterotrait-monotrait ratio (HTMT) criterion
|
Construct |
GP |
CP |
SHP |
EAP |
COMP |
TMC |
PEM |
|
Government Pressure (GP) |
- |
|
|
|
|
|
|
|
Consumer Pressure (CP) |
0.512 |
- |
|
|
|
|
|
|
Shareholder Pressure (SHP) |
0.476 |
0.544 |
- |
|
|
|
|
|
Environmental Activist Pressure (EAP) |
0.498 |
0.531 |
0.557 |
- |
|
|
|
|
Competitor Pressure (COMP) |
0.421 |
0.448 |
0.439 |
0.462 |
- |
|
|
|
Top Management Commitment (TMC) |
0.387 |
0.364 |
0.342 |
0.401 |
0.583 |
- |
|
|
Proactive Environmental Management (PEM) |
0.566 |
0.472 |
0.318 |
0.409 |
0.671 |
0.812 |
- |
3.3 Structural model assessment
The structural model was evaluated after the measurement criteria had been satisfied. Its explanatory capacity was examined primarily through R², which represents the proportion of variation explained in the endogenous construct [18, 20].
PEM had an R² of 0.827. Thus, the six predictor constructs jointly explained 82.7% of the variation in managers’ assessments of PEM, indicating substantial explanatory power [18].
This high R² shows that the predictor set explains considerable variation in the sample. It supports further examination of the individual paths, but it should not be interpreted as proof of firm-level causality.
Additional model criteria are reported in Table 7. The f² values ranged from 0.040 to 0.621, showing considerable differences in the contribution of individual predictors. Q²predict was positive at 0.316, while SRMR was 0.054 and NFI was 0.925. Considered together, these results support the model’s predictive relevance and acceptable fit [18, 20].
Table 7. Structural model quality assessment
|
Criterion |
Construct or Path |
Value |
|
R² |
PEM |
0.827 |
|
Q² predict |
PEM |
0.316 |
|
f² |
GP → PEM |
0.352 |
|
f² |
CP → PEM |
0.040 |
|
f² |
SHP → PEM |
0.257 |
|
f² |
EAP → PEM |
0.113 |
|
f² |
COMP → PEM |
0.326 |
|
f² |
TMC → PEM |
0.621 |
|
SRMR |
Model |
0.054 |
|
NFI |
Model |
0.925 |
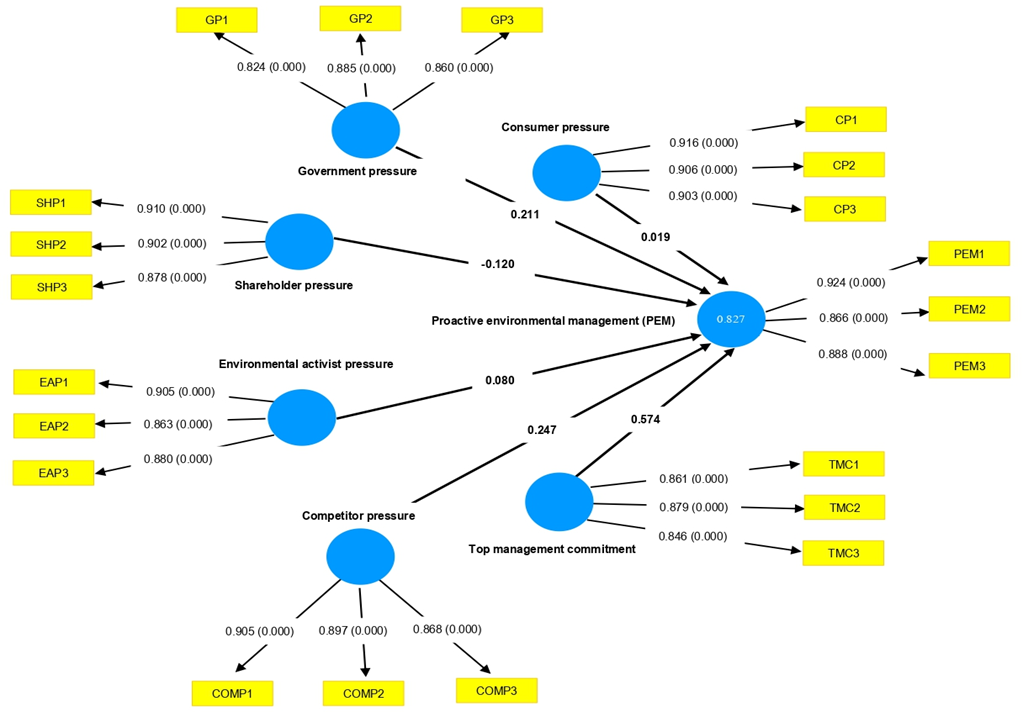
Bootstrapping was used to evaluate the path coefficients (β), t-statistics, and p-values. Table 8 summarizes the structural estimates and the resulting hypothesis decisions, while Figure 1 presents the PLS-SEM bootstrapping results.
Table 8. Structural model evaluation and hypothesis-testing results
|
Hypothesis |
Path |
β |
t-Statistic |
p-Value |
Decision |
|
H1 |
GP → PEM |
0.211 |
1.742 |
0.085 |
Not supported |
|
H2 |
CP → PEM |
0.019 |
0.214 |
0.831 |
Not supported |
|
H3 |
SHP → PEM |
-0.120 |
1.188 |
0.235 |
Not supported |
|
H4 |
EAP → PEM |
0.080 |
0.903 |
0.367 |
Not supported |
|
H5 |
COMP → PEM |
0.247 |
2.741 |
0.006 |
Supported |
|
H6 |
TMC → PEM |
0.574 |
7.216 |
< 0.001 |
Supported |
Figure 1. Partial Least Squares Structural Equation Modeling (PLS-SEM) bootstrapping results
GP had a positive but statistically inconclusive relationship with PEM at the 5% level (β = 0.211, p = 0.085). H1 was therefore not supported, although the direction suggests a possible emerging relationship. Consumer, shareholder, and EAP were also nonsignificant (p > 0.05); consequently, H2-H4 were not supported.
COMP was positively related to managers' assessments of PEM (β = 0.247, p = 0.006), supporting H5. TMC produced the strongest positive relationship (β = 0.574, p < 0.001), supporting H6.
In summary, H5 and H6 were supported, whereas H1-H4 were not. The differences among the six paths form the basis of the discussion that follows.
The results show that managers' assessments of PEM were related most strongly to perceived TMC and COMP. GP had a positive but marginal relationship, whereas consumer, shareholder, and EAP were nonsignificant. This pattern does not imply that stakeholders are generally unimportant; instead, it shows that their perceived influence differs across groups and institutional mechanisms.
The government-pressure coefficient was positive but did not reach the conventional 5% significance level (β = 0.211, p = 0.085). This marginal result should not be interpreted as evidence that GP has no relevance. Instead, it suggests a limited or emerging association that may depend on enforcement, monitoring, incentives, and managers' assessments of regulatory urgency. From an institutional perspective, formal rules may generate coercive pressure without consistently prompting practices beyond compliance when their implementation is perceived as uneven [12-14].
The findings further indicate that pressure from consumers, shareholders, and environmental activists does not significantly influence PEM. These results suggest that not all stakeholder groups possess equal capacity to shape corporate environmental strategies. According to Stakeholder Salience Theory, stakeholders' influence depends on the extent to which they possess power, legitimacy, and urgency [11]. Consequently, stakeholder demands do not necessarily lead to strategic organizational change unless organizations perceive them as important enough to affect legitimacy, long-term sustainability, or business performance.
Several contextual factors may explain these findings. Within Indonesia's chemical manufacturing industry, which primarily operates in business-to-business (B2B) markets, pressure from end consumers is generally less pronounced than in consumer-oriented industries. This observation is consistent with Sharma et al. [19], who argued that consumer influence on corporate sustainability practices depends largely on environmental awareness and the value consumers attach to sustainability attributes. Likewise, shareholders' influence on environmental decision-making varies across institutional contexts because the integration of environmental, social, and governance (ESG) considerations into investment decisions remains uneven across countries [2]. Similarly, the effectiveness of EAP depends on industry visibility, media attention, and civil society organizations' capacity to impose reputational costs on firms through public scrutiny.
These results refine Stakeholder Theory by indicating that stakeholder pressure does not have a uniform relationship with PEM. Its influence varies with stakeholder salience, industry characteristics, and the institutional setting in which firms operate. Corporate environmental strategies should therefore be interpreted in their broader social and economic context rather than as automatic responses to stakeholder demands [10, 14, 23].
COMP, unlike the other external pressures examined, had a positive and significant relationship with PEM. The result suggests that firms respond to environmental practices adopted within their industry. From an Institutional Theory perspective, this supports mimetic isomorphism: organizations imitate peers regarded as successful or legitimate to protect their own legitimacy and competitive position [12]. As certifications, sustainability standards, and green operating practices spread among competitors, other firms may be encouraged to adopt similar approaches.
The competitor result also suggests that PEM is shaped by competitive dynamics as well as regulatory demands. Environmental initiatives can strengthen reputation, respond to market expectations, facilitate access to environmentally sensitive markets, and support long-term competitiveness. This interpretation is consistent with evidence that institutional and competitive pressures influence corporate environmental strategies [2, 4, 13]. In this setting, competitive imitation appears to be an important route through which sustainability practices diffuse.
The most prominent result is the strong role of TMC in PEM. Environmental transformation requires leaders to set priorities, allocate resources, foster an environmentally supportive culture, and place sustainability within corporate strategy. External demands alone cannot produce proactive practice unless management translates them into organizational decisions and routines. This interpretation is consistent with studies emphasizing environmental leadership, organizational support, and managerial commitment [1, 16, 17].
The strong TMC relationship further suggests that internal capabilities become particularly important when external pressures are weak or uneven. Sustainability-oriented leaders may view environmental initiatives as strategic investments rather than merely compliance obligations. In an emerging-economy setting, this commitment can provide the continuity needed to implement PEM. Related evidence identifies environmental management systems, supportive culture, and strategic managerial support as mechanisms that improve environmental performance in manufacturing [24].
Taken together, the findings connect stakeholder salience with institutional mechanisms. External stakeholders do not exert equal influence, competitive pressure operates through imitation, and top management provides the internal capacity needed for implementation. PEM in this context is therefore better understood as the result of external pressures interacting with organizational capabilities, rather than as a simple response to stakeholder demands.
The practical implications concern both organizations and policymakers. Companies need visible top management support, adequate resources, an environmentally oriented culture, and the integration of environmental objectives into strategy. Recent evidence likewise links managerial sustainability commitment with green performance and longer-term competitiveness [25]. Policymakers should complement regulation with credible enforcement and appropriate incentives. Industry associations and benchmarking programs can also encourage environmental learning by spreading successful practices among competing firms.
5.1 Conclusion
This study provides evidence from individual managers in Indonesia's chemical manufacturing industry. Managers who perceived stronger COMP and TMC also reported higher PEM. GP had a positive but marginal relationship, while consumer, shareholder, and EAP were not statistically significant.
The estimates describe relationships among managerial perceptions; they do not establish that the corresponding pressures objectively cause firms to adopt particular environmental strategies. Within this sample, TMC had the strongest relationship with reported PEM, followed by COMP.
Overall, the findings indicate that PEM reflects an interaction between external institutional pressures and internal organizational capabilities. Combining Stakeholder Salience Theory with Institutional Theory explains this pattern more fully than either perspective used alone.
5.2 Contributions and implications
The study contributes first by showing that separate stakeholder groups are not uniformly related to PEM. Stakeholder Salience Theory explains this variation through differences in perceived power, legitimacy, and urgency, while recognizing the importance of industry and institutional context.
A second contribution is the distinction between external and internal mechanisms. COMP represents mimetic influence, whereas TMC represents the organizational capacity to implement environmental priorities. Their stronger relationships with PEM show why competitive practice and managerial commitment may matter more than conventional stakeholder pressures in this emerging-economy setting.
For managers, the results emphasize that proactive environmental practice requires continuing leadership support. Senior management must authorize resources, foster appropriate organizational expectations, and integrate environmental objectives into routine strategic decisions rather than treating them only as compliance requirements.
For policymakers, the marginal government relationship suggests that regulation alone may be insufficient. Consistent enforcement, suitable incentives, organizational learning, and competitive benchmarking can work together to accelerate the adoption of proactive environmental practices.
5.3 Limitations and future research
The study has two limitations related to its design. First, cross-sectional data do not establish temporal order or causality. Second, although managers answered questions about their organizations, their responses were analyzed individually. The measures consequently represent perceptions rather than independently verified firm attributes. Responses were not aggregated and within-firm agreement was not assessed, so the findings should not be generalized as objective organization-level relationships. Future studies could use longitudinal designs, obtain multiple respondents per firm, test whether aggregation is justified, and combine perceptual measures with objective environmental indicators.
The sample was also limited to chemical manufacturing in Banten Province, Indonesia. This environmentally sensitive setting is appropriate for the research question, but the findings may not transfer to other industries or institutional contexts. Replication across sectors, regions, and countries is needed to evaluate the model's external validity.
Finally, the model focused on stakeholder pressure and TMC as determinants of PEM. Further research could consider environmental culture, green-innovation capability, environmental management accounting, sustainability-oriented control systems, digital environmental technologies, and objective performance measures to clarify additional pathways leading to proactive environmental practice.
[1] Aftab, J., Abid, N., Sarwar, H., Veneziani, M. (2022). Environmental ethics, green innovation, and sustainable performance: Exploring the role of environmental leadership and environmental strategy. Journal of Cleaner Production, 378: 134639. https://doi.org/10.1016/j.jclepro.2022.134639
[2] Arena, M., Azzone, G., Ratti, S., Urbano, V.M., Vecchio, G. (2023). Sustainable development goals and corporate reporting: An empirical investigation of the oil and gas industry. Sustainable Development, 31(1): 12-25. https://doi.org/10.1002/sd.2369
[3] Alakkas, A.A., Shabir, S., Alhumoudi, H., Boukhris, M., Baig, A., Khan, I.A. (2023). The impact of sustainability accounting on environmental performance and productivity: A panel data analysis. International Journal of Sustainable Development and Planning, 18(8): 2431-2441. https://doi.org/10.18280/ijsdp.180814
[4] Augustin-Behravesh, S.A., Gómez-Trujillo, A.M., Perdomo-Charry, G., Djunaedi, M.K.D., Ong, A.K.S. (2025). Sustainability strategies and corporate legitimacy: Analyzing firm performance through green innovation and technological turbulence. Business Strategy and the Environment, 34(7): 8500-8515. https://doi.org/10.1002/bse.70040
[5] Buysse, K., Verbeke, A. (2003). Proactive environmental strategies: A stakeholder management perspective. Strategic Management Journal, 24(5): 453-470. https://doi.org/10.1002/smj.299
[6] Singh, S.K., Del Giudice, M., Chierici, R., Graziano, D. (2020). Green innovation and environmental performance: The role of green transformational leadership and green human resource management. Technological Forecasting and Social Change, 150: 119762. https://doi.org/10.1016/j.techfore.2019.119762
[7] Abbas, J., Sağsan, M. (2019). Impact of knowledge management practices on green innovation and corporate sustainable development. Journal of Cleaner Production, 229: 611-620. https://doi.org/10.1016/j.jclepro.2019.05.024
[8] Ali, S., Ali, A.J., Ashfaq, K., Khalid, J. (2021). Green human resource management and environmental innovativeness. International Journal of Sustainable Development and Planning, 16(6): 1117-1130. https://doi.org/10.18280/ijsdp.160613
[9] Freeman, R.E. (2010). Strategic Management: A Stakeholder Approach. Cambridge University Press.
[10] Hörisch, J., Freeman, R.E., Schaltegger, S. (2014). Applying stakeholder theory in sustainability management: Links, similarities, dissimilarities, and a conceptual framework. Organization & Environment, 27(4): 328-346. https://doi.org/10.1177/1086026614535786
[11] Mitchell, R.K., Agle, B.R., Wood, D.J. (1997). Toward a theory of stakeholder identification and salience: Defining the principle of who and what really counts. The Academy of Management Review, 22(4): 853-886. https://doi.org/10.5465/amr.1997.9711022105
[12] DiMaggio, P.J., Powell, W.W. (1983). The iron cage revisited: Institutional isomorphism and collective rationality in organizational fields. American Sociological Review, 48(2): 147-160. https://doi.org/10.2307/2095101
[13] Gunarathne, A.D.N., Lee, K.H., Hitigala Kaluarachchilage, P.K. (2021). Institutional pressures, environmental management strategy, and organizational performance: The role of environmental management accounting. Business Strategy and the Environment, 30(2): 825-839. https://doi.org/10.1002/bse.2656
[14] Testa, F., Boiral, O., Iraldo, F. (2018). Internalization of environmental practices and institutional complexity: Can stakeholders pressures encourage greenwashing? Journal of Business Ethics, 147: 287-307. https://doi.org/10.1007/s10551-015-2960-2
[15] Al-Swidi, A.K., Gelaidan, H.M., Saleh, R.M. (2021). The joint impact of green human resource management, leadership and organizational culture on employees’ green behaviour and organisational environmental performance. Journal of Cleaner Production, 316: 128112. https://doi.org/10.1016/j.jclepro.2021.128112
[16] Memon, S.B., Rasli, A., Dahri, A.S., Abas, I.H. (2022). Importance of top management commitment to organizational citizenship behaviour towards the environment, green training and environmental performance in Pakistani industries. Sustainability, 14(17): 11059. https://doi.org/10.3390/su141711059
[17] Yusliza, M.Y., Norazmi, N.A., Jabbour, C.J.C., Fernando, Y., Fawehinmi, O., Seles, B.M.R.P. (2019). Top management commitment, corporate social responsibility and green human resource management: A Malaysian study. Benchmarking: An International Journal, 26(6): 2051-2078. https://doi.org/10.1108/BIJ-09-2018-0283
[18] Hair, J., Hult, G.T.M., Ringle, C.M., Sarstedt, M. (2021). A Primer on Partial Least Squares Structural Equation Modeling (PLS-SEM) (3rd ed.). Sage Publications.
[19] Sharma, N., Paço, A., Kautish, P. (2022). The impact of eco-innovation on green buying behavior: The moderating effect of emotional loyalty and generation. Management of Environmental Quality: An International Journal, 33(4): 1026-1045. https://doi.org/10.1108/MEQ-11-2021-0267
[20] Sarstedt, M., Ringle, C.M., Hair, J.F. (2021). Partial least squares structural equation modeling. In Handbook of Market Research, Springer, Cham, pp. 587-632. https://doi.org/10.1007/978-3-319-57413-4_15
[21] Kock, N. (2015). Common method bias in PLS-SEM: A full collinearity assessment approach. International Journal of e-Collaboration, 11(4): 1-10. https://doi.org/10.4018/IJeC.2015100101
[22] Henseler, J., Ringle, C.M., Sarstedt, M. (2015). A new criterion for assessing discriminant validity in variance-based structural equation modeling. Journal of the Academy of Marketing Science, 43: 115-135. https://doi.org/10.1007/s11747-014-0403-8
[23] Pedersen, E.R.G., Tiburzi, L., Costa, R., Rosati, F., Calabrese, A. (2026). Those who mind matter: The relationship between stakeholder demands, business model innovation, and corporate sustainability. Corporate Social Responsibility and Environmental Management, 33(1): 1016-1030. https://doi.org/10.1002/csr.70207
[24] Nguyen, T.T.V., Nguyen, A.T., Le, T.M.N. (2025). The impact of green intellectual capital on environmental performance: The mediating role of environmental management accounting and company sustainability culture in the digital era. International Journal of Sustainable Development and Planning, 20(9): 3931-3945. https://doi.org/10.18280/ijsdp.200923
[25] Muchlish, M., Retnowati, W., Abbas, D.S. (2025). Total quality management and corporate green performance: The mediating role of environmental sustainability and corporate social responsibility. International Journal of Sustainable Development and Planning, 20(8): 3601-3609. https://doi.org/10.18280/ijsdp.200839