I Nengah Korja | Naharuddin Naharuddin* | Adam Malik | Yusran Yusran | Sudirman Dg Massiri | Junianto Junianto | M. Afiat Abidin
© 2026 The authors. This article is published by IIETA and is licensed under the CC BY 4.0 license (http://creativecommons.org/licenses/by/4.0/).
OPEN ACCESS
Quantitative information on vegetation structure and mangrove regeneration dynamics in the downstream Poso watershed-coastal transition area is limited despite the environmental gradients. Therefore, this study aimed to evaluate mangrove species composition and structural characteristics across growth stages, determine key edaphic and hydrological drivers regulating species distribution, and assess cross-strata spatial patterns to elucidate how micro-habitat filtering influences recruitment and establishment along estuarine environmental gradients in the downstream Poso watershed. Nested transect-plot vegetation sampling was conducted at three stations (Mapane, Bega, and Masani), showing a gradient from the estuary to the open coast. Initial screening evaluated environmental variables including salinity, porosity, organic carbon, and pH; however, after addressing multicollinearity, the final Canonical Correspondence Analysis (CCA) model retained only pore-water salinity and soil porosity as significant environmental drivers of community structure. The results showed that there were 10, 9, and 7 species at the tree, sapling, and seedling stages, respectively. Rhizophora apiculata dominated the tree (Importance Value Index (IVI) = 113.90%) and sapling (IVI = 98.18%) strata, while Ceriops tagal was predominantly found in seedling strata (IVI = 56.60%). Species diversity was classified as moderate across all stages (H′ = 1.603–1.802), while species evenness increased significantly from the tree (J′ = 0.716) to the seedling (J′ = 0.926). CCA ordination (p = 0.004; 81.2% of variance explained) showed that vegetation zonation patterns were controlled by the salinity gradient (Axis 1; r = 0.85) and soil porosity (Axis 2; r = -0.72). This study highlights distinct compositional variations and regeneration patterns across vegetation growth stages along the salinity and substrate gradients. Consequently, simultaneous evaluation of growth stage proved crucial for identifying environmental filtering and formulating precision rehabilitation strategies based on local ecological zonation in estuarine areas.
Canonical Correspondence Analysis, Poso watershed, ontogenetic shift, mangrove regeneration, community structure, river-coastal transition zone
Mangrove ecosystems are tropical coastal environments characterized by high biological productivity, alongside intense environmental and anthropogenic pressures [1]. As a transition between land and sea in the intertidal area, mangrove ecosystems play essential ecological roles in nutrient cycling, carbon storage and sequestration, and the provision of habitats for diverse aquatic organisms, as well as in protecting the coastline against abrasion and seawater intrusion [2-4]. These functions depend significantly on mangrove structural integrity and community composition. Consequently, changes in stand density, species dominance, composition, and regeneration capacity are important indicators of the ecological condition.
In tropical areas, including Indonesia, mangrove communities show significant variation in composition and structure across different locations. The variation is closely associated with the interplay of hydrological conditions, tidal dynamics, salinity, soil porosity, sediment availability, and freshwater input from river systems [5, 6]. The phenomenon becomes increasingly complex in river-coastal transition areas, where freshwater masses from river basins interact with seawater. The environmental gradients formed in these areas can create distinct habitat conditions over relatively short distances, thereby influencing the composition, structure, and distribution of mangrove species [7].
Several studies have been carried out recently, ranging from inventories of species composition to a more integrative understanding of community structure, regeneration, and ecosystem responses to changing environmental conditions. For example, the reported that salinity fluctuations, hydrological dynamics, sediment characteristics, and inputs of terrestrial material could act as environmental filters, influencing the presence, abundance, and regeneration of mangrove species [8-10]. Within this framework, community structure parameters, including density, frequency, dominance, Importance Value Index (IVI), species richness, and diversity index, serve as descriptive metrics to characterize organization patterns and the relative contribution of each species in a stand [11].
Although studies on mangrove community structure have advanced significantly, most reports in Indonesia have focused on coastal ecosystems, specific estuaries, or small islands. Studies on community structure in the transition area, which continuously connects river systems to the coastal environment, remain relatively limited, particularly in Central Sulawesi. This is particularly relevant because the relationship between freshwater influence and oceanographic processes can create habitat characteristics distinct from mangroves more exposed to marine activities. Furthermore, evaluations based on mature stands do not show the overall regeneration status, as species composition and dominance during the seedling and sapling stages may differ from the tree community.
In Central Sulawesi, the Poso watershed is an important hydrological system, connecting Poso Lake to the coastal area of Tomini Bay [12, 13]. The downstream section forms a transitional environment affected by both fluvial influences and coastal processes. The habitat characteristics are determined by freshwater input, sediment transport, tidal dynamics, and human activities throughout the watershed. Furthermore, the interaction of these processes can lead to variations in habitat conditions and mangrove community structure, ranging from areas dominated by river flow to more open coastal environments. However, there are still limited quantitative data regarding vegetation structure and mangrove regeneration in the downstream transition area of the Poso watershed.
The lack of quantitative data is increasingly critical due to the rising anthropogenic pressures on downstream watershed and coastal areas. This is because changes in land use, the expansion of settlements and infrastructure, and coastal resource activities can influence hydrological conditions, sedimentation, and the quality of mangrove habitats. Under these circumstances, baseline data on species composition, stand structure, dominance, diversity, and regeneration are essential for providing a scientific basis for evaluating community conditions and formulating conservation and rehabilitation strategies tailored to local ecological characteristics.
Despite the extensive reports on mangrove community structures in Indonesia, a knowledge gap remains regarding the arrangement of vegetation structure and regeneration in the transition area connecting river systems to coastal environments. This gap is particularly evident in the downstream area of the Poso watershed in Central Sulawesi, which currently lacks a quantitative baseline integrating species composition, density, frequency, dominance, IVI, diversity, and regeneration across various growth stages. Furthermore, there is no quantitative evidence on the dominance of mature-stand species during the early regeneration phase in the area.
While ecological indicators such as the IVI and environmental gradients have been widely applied in mangrove studies, the novelty of this research lies in its integrative evaluation across vegetation strata within a unique downstream watershed transition zone—an area characterized by complex interactions between watershed hydrological dynamics and estuarine gradients, thereby offering deep insights into local-scale community response mechanisms that have not been extensively explored previously.
Accordingly, this study aimed to: (1) evaluate mangrove species composition and structural characteristics across growth stages, (2) determine key edaphic and hydrological drivers regulating species distribution, and (3) assess cross-strata spatial patterns to elucidate how micro-habitat filtering influences recruitment and establishment along estuarine environmental gradients in the downstream Poso watershed. The novelty of this study is in the integrated evaluation of community structure and mangrove regeneration across three growth stages, namely trees, saplings, and seedlings, within the downstream Poso watershed–coastal transition area. The method enables assessment of each species' relative contribution based on density, frequency, dominance, and IVI, while also identifying shifts in species-importance patterns across growth stages. The results are expected to provide a robust ecological baseline for understanding mangrove community structure in the watershed-coastal transition area and serve as a foundation for developing mangrove conservation, monitoring, and rehabilitation strategies based on local ecological conditions.
2.1 Study area
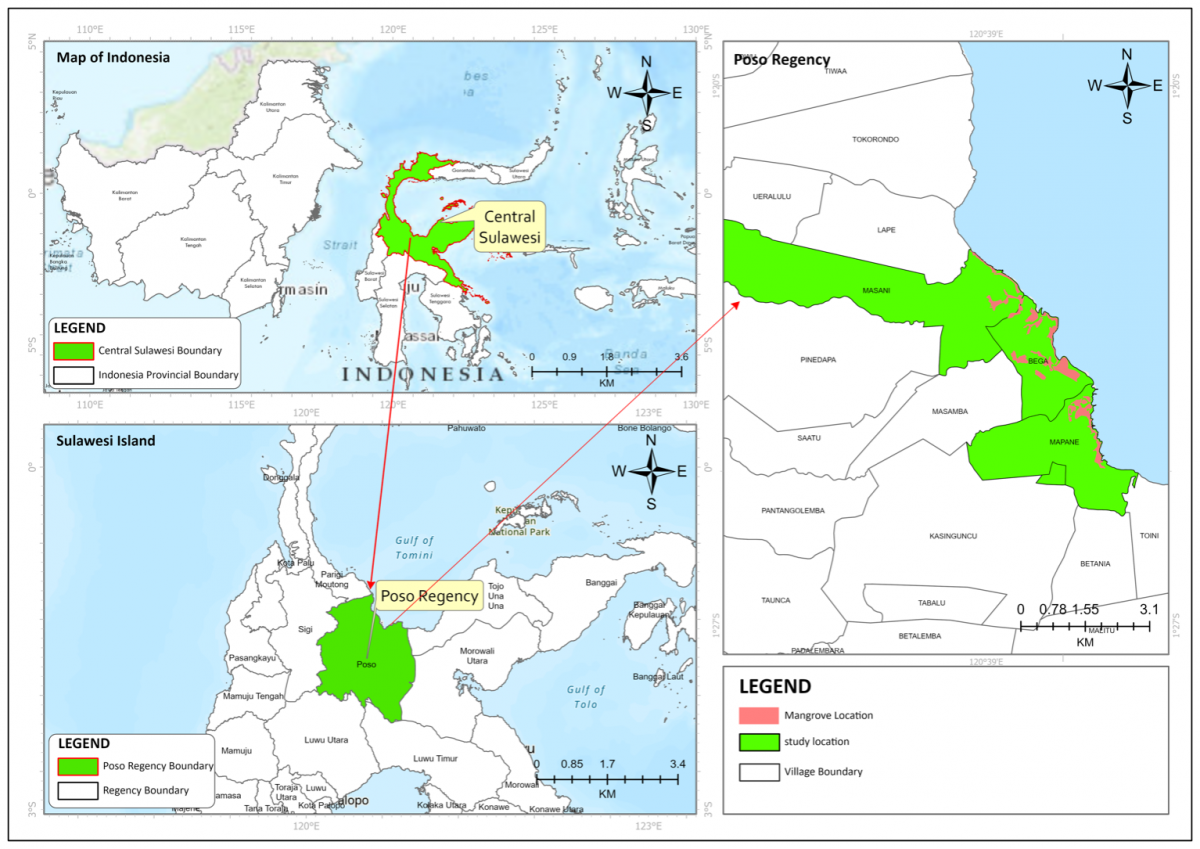
This study was conducted in the mangrove ecosystem in the downstream section of the Poso watershed, Poso Pesisir district, Poso regency, Central Sulawesi province, Indonesia. Geographically, the area is located between coordinates 120°38′47.145″–120°40′41.151″ E and 1°22′06.173″–1°24′57.954″ S (Figure 1). The characteristics of the area include flat topography, with slopes ranging from 0% to 3% and elevations between 0 and 10 meters above sea level. Climatic conditions feature annual rainfall ranging from 82.2 to 368 mm, daily temperatures of approximately 19–34 ℃, and an average relative humidity of 84–88%. Based on the experimental procedures, three observation stations were purposively selected based on differences in ecological characteristics, the degree of tidal influence, exposure to marine waters, and the impact of freshwater input from the Poso watershed system. These stations represented a habitat gradient ranging from environments strongly influenced by the river system to more open coastal areas.
Station I (Mapane village) represents a downstream transition area adjacent to the river mouth, covering approximately 27.89 ha. This station is characterized by relatively high salinity fluctuations, ranging from 0 to 34‰, driven by periodic interactions between freshwater and seawater masses. The substrate is dominated by silty and sandy clay. Furthermore, Station I experiences moderate anthropogenic pressure associated with human settlements and changes in coastal land use.
Station II (Bega village) is a sheltered coastal area covering approximately 52.75 ha. The habitat is dominated by a relatively thick clayey-mud substrate, characterized by a porosity of 60–68%, relatively low soil bulk density, and a mud layer depth exceeding 70 cm. These conditions are associated with relatively intensive tidal inundation and the formation of a water-saturated substrate prone to oxygen-limited conditions.
Station III (Masani village) represents an upper estuarine transition zone covering approximately 19.36 ha, situated near the riverine-influenced inner reach of the downstream Poso watershed. This station is characterized by strong freshwater runoff from the Poso River system, resulting in relatively low and fluctuating pore-water salinity levels ranging from 1.8 to 9.5 ppt (classified as an oligohaline to lower-mesohaline zone). The substrate is predominantly composed of muddy sand with a porosity ranging between 54.4% and 63.6%. Compared to the lower estuarine stations, Station III experiences greater terrestrial runoff influence and lower marine hydrodynamic energy.
Figure 1. Research location map
2.2 Procedure
2.2.1 Procedure for inventorying species composition and community structure of mangrove vegetation
This study used a field-based ecological survey method combined with spatial analysis to inventory species composition and community structure of mangrove vegetation. The initial stage included the spatial delineation of mangrove cover using Landsat 8 Operational Land Imager (OLI) and Sentinel-2 imagery. Image analysis was used to identify the distribution and boundaries of mangrove cover, distinguish between areas with intact vegetation and those experiencing fragmentation, followed by representative selections for field sampling.
Vegetation sampling was conducted using the systematic line-plot method with an intensity of 5%. Based on the mangrove cover at each station, namely 27.89 ha in Mapane, 52.75 ha in Bega, and 19.36 ha in Masani, the theoretically required sampling areas were 1.3945, 2.6375, and 0.8945 ha, respectively. Using transects 100 m in length and 10 m in effective width (equating to an area of 0.10 ha per transect), the number of transects was set at 14, 27, and 9 for Mapane, Bega, and Masani, respectively. This led to a total of 50 transects with an actual sampling area of 5 ha, equivalent to 5.07% of the total study area (100 ha). The number of transects was rounded up, ensuring that the actual sampling intensity did not fall below the established target.
Comprehensive vegetation data collection was conducted using 50 transects distributed representatively across the 100-hectare study area, with a sampling intensity of 5%. To evaluate the relationship between vegetation communities and environmental factors using Canonical Correspondence Analysis (CCA), detailed measurements of soil and water physicochemical parameters were conducted across 15 primary sub-plots (comprising exactly 5 plots per station). These 15 plots were systematically selected from the 50-transect network using a purposive stratified gradient sampling design to fully capture the macro- and micro-environmental spectrum of the downstream Poso watershed. Stratification was based on three distinct hydrological/geomorphological zones: (i) Estuary Mouth / River-Dominated Transition Zone (Station I; 5 plots along 14 transects), (ii) Sheltered Mid-Estuarine Mudflat Zone (Station II; 5 plots along 27 transects), and (iii) Exposed Outer Coastal Bay Zone (Station III; 5 plots along 9 transects). Within each station, the 5 sub-plots were positioned along seaward-to-landward transects at 20-meter spatial intervals to capture the complete cross-shore gradient of tidal inundation, pore-water salinity (1.8–33.0 ppt), and soil physical properties (porosity 36.1–63.6%). This stratified selection ensured that the 15 environmental plots were representative of the structural and edaphic variations found across the full 50-transect dataset while avoiding spatial autocorrelation bias.
Along each 100-meter transect, a 10 m × 10 m main plot was used to observe tree stage. Nested plots measuring 5 m × 5 m were placed within the main plot to observe saplings, while 2 m × 2 m plots were used for seedlings. Based on the design, there were 140, 270, and 90 plots per growth stage in Mapane, Bega, and Masani, respectively. Transects were positioned perpendicular to the shoreline and extended inland to capture a representative view of vegetation structure along the spatial gradient of the mangrove area. The placement was determined following the initial spatial delineation and the representativeness of mangrove cover at each station. Subsequently, every individual within each plot that met the growth-stage criteria was recorded and measured.
Vegetation growth stage criteria were established based on individual size. The tree and sapling stages included individuals with a diameter at breast height (DBH) of ≥10 cm. The sapling stage comprised individuals with a DBH < 10 cm and a height >1.5 m, while seedlings included individuals with a height of ≤1.5 m. In each plot, recorded data were species, number of individuals, and stem diameter for individuals that met the measurement criteria. These data were used to calculate parameters regarding community structure and mangrove regeneration.
As the mangrove cover in the study area showed spatial fragmentation, image delineation results were used to identify mangrove patches, serving as the basis for defining observation units. Quantitative analysis focused on mangrove stands with an area of ≥5 ha. Mangrove patches smaller than 5 ha were not used as primary units for quantitative analysis but were examined through spot checks to document species presence and vegetation cover conditions. Spot-check data served as supplementary information and were excluded from the calculations of density, frequency, dominance, and IVI.
Species identification was conducted directly in the field based on observable morphological characteristics. Both local and scientific names for each species were recorded on tally sheets. Individuals that could not be conclusively identified in the field were collected as specimens for further taxonomic verification at the Sulawesi Biological Resources Unit, Tadulako University. The verification results were used to standardize species identities and nomenclature before data analysis. All field observation data were tabulated according to sampling station and growth stage to analyze species composition, density, frequency, dominance, IVI, and the diversity index of the mangrove community.
2.2.2 Procedures for measuring environmental variables and analyzing substrates
Measurements of environmental variables were conducted in Mapane, Bega, and Masani within the Poso watershed. A total of five observation plots were established at each area, with measurements obtained through in situ observations and ex situ laboratory analysis of water and soil samples.
a. Water salinity
Pore-water salinity was measured directly in situ at each sampling plot using a calibrated handheld refractometer. Samples were collected from a depth of 20–30 cm below the substrate surface using a monitoring pipe (piezometer) or by extracting groundwater pooling in an excavated hole. Droplets of water were placed onto the refractometer prism, which had been cleaned with distilled water, followed by measurement of the salinity value and recording in parts per thousand (ppt or ‰).
b. Soil reaction (soil pH)
Soil pH measurements were conducted in situ using a digital soil pH meter calibrated with pH 4.0 and 7.0 buffer solutions. Measurements were performed by gradually inserting the pH meter sensor into the wet mangrove substrate to a depth of 10-15 cm and allowing the reading to stabilize before recording the pH value.
c. Soil porosity
Soil porosity was determined in the laboratory at the Faculty of Agriculture, Tadulako University, using a gravimetric method based on the relationship between bulk and particle densities. Undisturbed soil samples were collected using 5 cm diameter ring samplers at a depth of 0–20 cm. The samples were weighed to determine their wet weight and oven-dried at 105 ℃ for 24 hours, until a constant weight was reached, to obtain the oven-dry weight. Soil porosity (N) was then calculated according to Li et al. [14] using Eq. (1):
$N=\left(1-\frac{\rho_b}{\rho_p}\right) \times 100 \%$ (1)
where, ρb is the soil bulk density (g cm⁻³), and ρp is the soil particle density, assumed to have a standard value of 2.65 g cm⁻³.
d. Soil organic carbon (organic C)
Soil organic-C content was analyzed in the laboratory using the Walkley-Black wet oxidation method. Disturbed soil samples were collected from a depth of 0–20 cm, air-dried, ground, and sieved through a 0.5 mm mesh. The samples were oxidized using a 1 N potassium dichromate (K2Cr2O7) solution in a concentrated acid (H2SO4) medium, followed by exothermic heating. The unreduced excess dichromate was back-titrated using a 0.5 N ferrous sulfate or ferrous ammonium sulfate (FeSO4) solution with a diphenylamine indicator.
Soil organic-C content was calculated using the following Eq. (2):
Organic $C(\%)=\frac{\left(V_b-V_a\right) \times N \times 0.003 \times 100 \times f}{W}$ (2)
where, Vb = volume of FeSO4 solution used for the blank titration (mL), Va = volume of FeSO4 solution used for the soil sample titration (mL), N = normality of the FeSO4 solution (N), 0.003 = milliequivalent weight of carbon (g/meq), f = correction factor for incomplete oxidation (commonly 1.33), W = weight of the air-dry soil sample (g).
2.3 Data analysis
Vegetation data were quantitatively analyzed to characterize species composition, community structure, diversity, evenness, and mangrove regeneration patterns across the tree, sapling, and seedling stages. Analysis was conducted separately for each growth stage and observation station.
2.3.1 Community composition and structure
Species composition was determined by the number of species and individuals of each species across all growth stages. Following the guidelines of Tilman et al. [15] and Rahman et al. [16], community structure was analyzed using the parameters of species density (D), relative density (RD), species frequency (F), relative frequency (RF), species dominance (D), and relative dominance (RC).
Species density is calculated using Eq. (3):
$K_i=\frac{n_i}{A}$ (3)
where, Ki is the density of the i-th species (individuals ha⁻¹), ni is the number of individuals of the i-th species, and A is the total sample area (ha). RD is calculated using Eq. (4):
$R D_i=\frac{K_i}{\sum K} \times 100$ (4)
Species frequency is calculated based on the proportion of plots occupied by a species, according to Eq. (5):
$F_i=\frac{P_i}{P}$ (5)
where, Pi is the number of plots where the i-th species was found, and P is the total number of plots observed. RF is calculated using Eq. (6):
$R F_i=\frac{F_i}{\sum F} \times 100$ (6)
For the tree and sapling strata, dominance was determined based on basal area, which was calculated for each individual using Eq. (7):
$B A=\frac{\pi \mathrm{d}^2}{4}$ (7)
where, BA is the individual basal area (m²), and d is the stem diameter (m).
Species dominance is calculated using Eq. (8):
$R C_i=\frac{D_i}{\sum D} \times 100$ (8)
2.3.2 Importance Value Index
IVI was used to describe the relative contribution of species to the community structure [17, 18].
For the tree and sapling stages (value range 0–300%):
IVI = Relative Density (RD) + Relative Frequency (RF) + Relative Dominance (RC) (9)
For the sapling and seedling stages (value range 0–200%):
IVI = Relative Density (RD) + Relative Frequency (RF) (10)
2.3.3 Species diversity
Species diversity was calculated using the Shannon-Wiener diversity index (H′) [19, 20], in accordance with Eqs. (11) and (12):
$H^{\prime}=-\sum_{i=1}^S p_i \ln \left(p_i\right)$ (11)
where,
$p_i=\frac{n_i}{N}$ (12)
where, pi is the proportion of individuals of the i-th species, ni is the number of individuals of the i-th species, N is the total number of individuals, and S is the number of species found.
The H′ value was used to describe the level of community diversity based on a combination of species richness and the evenness of individual abundance. In this study, H′ values <1 were categorized as low diversity, 1 ≤ H′ ≤ 3 as moderate, and H′ > 3 as high.
2.3.4 Species evenness
Species evenness was calculated using Pielou’s Evenness Index [20, 21], based on Eq. (13):
$J^{\prime}=\frac{H^{\prime}}{\ln S}$ (13)
where, J′ is the evenness index, H′ is the Shannon-Wiener diversity index, and S is the number of species. The value of J′ ranges from 0 to 1. A value closer to 1 indicates a more even distribution of individuals among species, while a low value shows that individual abundance is concentrated in a few species.
2.3.5 Multivariate ordination analysis
CCA evaluated the relationship between environmental gradients and mangrove species distribution across growth stages. To ensure statistical validity with N = 15 sites, variables with Variance Inflation Factors (VIF > 10) were removed to prevent multicollinearity, and the sample-to-variable ratio (N:P) was assessed per established guidelines [22]. A minimum N:P ratio of 5:1 is required to avoid overparameterization and spurious inflation of explained inertia. In this study, forward selection identified 2 non-redundant significant environmental variables (P = 2: Salinity and Soil Porosity), yielding an N:P ratio of 7.5:1 (15:2), which satisfies mathematical stability requirements for CCA. Global model significance and axis significance were tested using 999 Monte Carlo permutations (p < 0.05). Analyses were executed using R (package vegan) and PAST version 4.03.
Prior to performing the final CCA ordination, species abundance data were square-root transformed, and rare species occurring in fewer than two plots were removed to minimize noise from extremely low-frequency species. To prevent over-parameterization, ordination axis inflation, and collinearity while maintaining an adequate sample adequacy ratio (N:P), environmental variables were first evaluated using VIF with a strict exclusion threshold of VIF > 10. Variables passing the VIF threshold were subsequently subjected to automatic forward selection using a Monte Carlo permutation test (999 permutations, p < 0.05) to derive a parsimonious set of environmental predictors, with statistically non-significant variables (p > 0.05) and low conditional contribution being progressively eliminated. Selection status (retained vs. removed) and permutation test parameters (pseudo-F and p-value) were evaluated for all variables, including substrate pH, soil organic carbon, soil temperature, and dissolved oxygen.
The environmental gradients evaluated in the preliminary CCA ordination included continuous edaphic and hydrological parameters: pore-water salinity, substrate pH, soil organic carbon, soil porosity, soil temperature, and dissolved oxygen. Substrate physical traits were quantitatively represented by soil porosity rather than categorical texture classes to satisfy the requirements of continuous multivariate ordination.
Environmental variables were initially screened for multicollinearity using VIF. Variables exhibiting severe multicollinearity VIF > 10, specifically Substrate pH VIF = 12.40, were excluded prior to performing the final constrained CCA ordination to ensure model stability and prevent variance inflation.
CCA was applied to determine species-environment relationships across growth strata (trees, saplings, and seedlings). Ordination matrices were structured to evaluate stratum-specific spatial responses to salinity and soil porosity gradients, providing insights into micro-habitat filtering during early recruitment stages versus established tree canopy stages.
3.1 Species composition of mangrove communities
Vegetation analysis results indicated that the mangrove communities in the study area showed varying species composition across different growth stages. Based on vegetation analysis in Tables 1, 2, and 3, there were 10, 9, and 7 species at tree, sapling, and seedling stages, respectively. The variation in species numbers across strata indicated that community composition was not entirely uniform throughout vegetation development. Some species were found across multiple growth stages, while others were recorded only within specific strata.
Table 1. Mangrove vegetation structure at the tree level
|
Species |
RF (%) |
RD (%) |
RC (%) |
IVI (%) |
|
Rhizophora apiculata |
47.14 |
38.64 |
28.12 |
113.90 |
|
Rhizophora mucronata |
14.00 |
9.09 |
28.12 |
51.22 |
|
Sonneratia alba |
13.02 |
20.45 |
7.03 |
40.50 |
|
Avicennia marina |
8.28 |
9.09 |
3.12 |
20.50 |
|
Bruguiera cylindrica |
6.90 |
4.55 |
6.57 |
18.02 |
|
Nypa fruticans |
1.58 |
2.27 |
12.50 |
16.35 |
|
Xylocarpus granatum |
4.34 |
6.82 |
3.78 |
14.94 |
|
Xylocarpus rumphii |
4.34 |
4.55 |
3.12 |
12.01 |
|
Ceriops tagal |
0.20 |
2.27 |
4.50 |
6.97 |
|
Bruguiera gymnorrhiza |
0.20 |
2.27 |
3.12 |
5.59 |
|
Total |
100
|
100
|
100
|
300
|
The results indicate that differences in species richness across strata show vertical heterogeneity and regeneration dynamics within the mangrove vegetation community structure. The non-uniform community composition across life stages indicates the influence of environmental filtering and varying microclimate preferences at each stage of plant development, ranging from seedlings to saplings.
The presence of mangrove species distributed across multiple growth stages indicates successful recruitment and continuous regeneration within the ecosystem. These species possess broad ecological tolerance, acting as generalists, and are adept at using varying light availability, ranging from the canopy to the forest floor [23, 24]. The sustained presence is crucial for ensuring the stability of the mangrove vegetation structure and the continuity of natural regeneration in the future. However, the occurrence of species restricted to specific strata (strata-specific) suggests niche differentiation and habitat specialization [25-27].
Table 2. Mangrove vegetation structure at the sapling stage
|
Species |
RF (%) |
RD (%) |
RC (%) |
IVI (%) |
|
Rhizophora apiculata |
51.08 |
34.38 |
12.73 |
98.18 |
|
Sonneratia alba |
14.93 |
18.75 |
16.62 |
50.30 |
|
Xylocarpus granatum |
6.47 |
12.50 |
12.73 |
31.70 |
|
Xylocarpus rumphii |
4.14 |
6.25 |
21.04 |
31.43 |
|
Bruguiera cylindrica |
8.09 |
6.25 |
12.73 |
27.07 |
|
Avicennia marina |
7.19 |
9.38 |
6.49 |
23.06 |
|
Ceriops tagal |
0.72 |
3.13 |
9.35 |
13.20 |
|
Rhizophora mucronata |
2.34 |
6.25 |
4.16 |
12.74 |
|
Rhizophora stylosa |
5.04 |
3.13 |
4.16 |
12.32 |
|
Total
|
100
|
100
|
100
|
300
|
Table 3. Mangrove vegetation structure at the seedling stage
|
Species |
RF (%) |
RD (%) |
IVI (%) |
|
Ceriops tagal |
28.30 |
28.30 |
56.60 |
|
Xylocarpus granatum |
18.87 |
18.87 |
37.74 |
|
Sonneratia alba |
18.87 |
18.87 |
37.74 |
|
Rhizophora mucronata |
11.32 |
11.32 |
22.64 |
|
Rhizophora stylosa |
9.43 |
9.43 |
18.87 |
|
Rhizophora apiculata |
9.43 |
9.43 |
18.87 |
|
Avicennia marina |
3.77 |
3.77 |
7.55 |
|
Total |
100 |
100
|
200
|
At the tree level, the community was characterized by the presence of Avicennia marina, Bruguiera gymnorrhiza, Bruguiera cylindrica, Ceriops tagal, Nypa fruticans, Rhizophora apiculata, Rhizophora mucronata, Sonneratia alba, Xylocarpus granatum, and Xylocarpus rumphii. This composition indicates that the mature stand comprises several mangrove groups, each with distinct ecological contributions. At the sapling stage, nine species were found, namely A. marina, B. cylindrica, C. tagal, R. apiculata, R. mucronata, Rhizophora stylosa, S. alba, X. granatum, and X. rumphii. Meanwhile, the seedling stage comprised seven species, including A. marina, C. tagal, R. apiculata, R. mucronata, R. stylosa, S. alba, and X. granatum.
According to Agnihotri et al. [28], changes in composition from the tree to the sapling and seedling stages indicated that not all species forming the mature stand were uniformly represented during regeneration. This condition is significant because the presence of a species in the tree strata does not automatically imply successful regeneration. In comparison, the presence of a species at the seedling stage indicates the occurrence of the initial regeneration process, although it does not represent successful recruitment into the sapling and tree stages. The species composition is further supported by an analysis of vegetation structure based on RD, RF, RC, and IVI. This method provides a more comprehensive understanding of the ecological position of each species within the community compared to species counts.
3.2 Vegetation structure at the tree level
Analysis of the vegetation structure at the tree level indicated that R. apiculata had the highest IVI at 113.90%. This value is composed of an RF of 47.14%, an RD of 38.64%, and an RC of 28.12%. The high RF value indicates that R. apiculata contributes significantly to several individuals within the tree community. A high RD value further indicates that the species is relatively widely distributed across the observation units. Meanwhile, an RC of 28.12% shows that R. apiculata significantly contributes to the stand. Therefore, the high IVI is due to individual abundance and the combination of abundance, distribution, and structural dominance.
The species with the next highest IVI is R. mucronata at 51.22%, followed by S. alba at 40.50%. R. mucronata has an RC of 28.12%, but the RF and RD are lower, at 14.00% and 9.09%, respectively. These results indicate that a relatively low number of individuals does not necessarily imply a low structural contribution. For example, R. mucronata possesses the same RC as R. apiculata despite having a lower RF. This shows the importance of incorporating diameter and basal area into the evaluation of community structure.
Table 1 shows that S. alba has an IVI of 40.50%, an RF of 13.02%, an RD of 20.45%, and an RC of 7.03%. The relatively high RD value indicates that S. alba is distributed across several observation units, although the dominance contribution is lower than that of the two Rhizophora species. Meanwhile, species such as A. marina (20.50%), Bruguiera cylindrica (18.02%), N. fruticans (16.35%), X. granatum (14.94%), and X. rumphii (12.01%) contribute less to the stand structure.
3.3 Vegetation structure at the sapling stage
At the sapling stage, R. apiculata is the most important species, possessing RF, RD, and RC values of 51.08%, 34.38%, and 12.73%, respectively, leading to an IVI of 98.18%. Table 2 shows that the dominance of R. apiculata in the sapling strata is numerically stronger than in the tree strata. More than half of the RF contribution in these strata is attributable to R. apiculata. This indicates that the species is strongly represented during this intermediate growth phase. The results are significant in the context of regeneration because the sapling strata represent a transitional phase between early regeneration and the tree stage. However, dominance at the sapling stage cannot be directly equated with long-term regeneration success, as population sustainability depends on individuals' ability to survive and develop into the tree stage. In addition to R. apiculata, S. alba showed an IVI of 50.30%, while X. granatum and X. rumphii had IVI values of 31.70% and 31.43%, respectively. The presence of several species with relatively high IVI indicates that the sapling community retains a heterogeneous structure, although R. apiculata is the most dominant species.
3.4 Regeneration structure at the seedling stage
The seedling strata showed a different pattern compared to the tree and sapling strata. At this stage, C. tagal had the highest IVI at 56.60%, with RF and RD values of 28.30% each. Based on the results in Table 3, S. alba and X. granatum each had an IVI of 37.74%, while R. mucronata had 22.64%, respectively. R. apiculata and R. stylosa each had an IVI of 18.87%, while A. marina had the lowest value at 7.55%. This pattern indicates a shift in dominance across growth strata, with R. apiculata being the most important species in the tree and sapling stages. However, C. tagal is the most important species at the seedling stage. The results also showed early regeneration success varied among species. The dominance of C. tagal among seedlings showed a relatively high level of early regeneration representation within the study habitat.
Although Rhizophora apiculata dominates the tree and sapling strata while Ceriops tagal dominates the seedling stratum, based on the IVI this distinction requires careful interpretation. High IVI values reflect the vegetation structure existing at the time of observation and do not constitute direct evidence of competitive advantage or a guarantee of successful long-term recruitment. The dynamics of turnover between these strata are heavily influenced by age-specific mortality rates, fluctuations in propagule supply, and micro-environmental heterogeneity; consequently, long-term demographic monitoring is required to validate future succession trends.
3.5 Species with the highest Importance Value Index at each growth stage
The IVI analysis was used to identify the species contributing most significantly to the community structure at each growth stage. For the tree and sapling stages, IVI was calculated as the sum of RF, RD, and RC, whereas for the seedling stage, it was calculated using RF and RD only because basal area was not measured for seedlings. A summary of the species with the highest IVI values at each growth stage is presented in Table 4.
Table 4. Summary of species with the highest Importance Value Index (IVI) at each growth stage
|
Growth Stage |
Dominant Species Based on IVI |
RF (%) |
RD (%) |
RC (%) |
IVI (%) |
|
Tree |
Rhizophora apiculata |
47.14 |
38.64 |
28.12 |
113.90 |
|
Sapling |
Rhizophora apiculata |
51.08 |
34.38 |
12.73 |
98.18 |
|
Seedling |
Ceriops tagal |
28.30
|
28.30
|
-
|
56.60
|
Table 4 shows the variation in species with the highest relative contribution across the developmental stages of the mangrove community. R. apiculata showed the highest IVI at the tree (113.90%) and sapling stage (98.18%). At the seedling stage, the highest IVI was recorded for C. tagal (56.60%). The pattern indicates that the dominant species in more mature strata are not identical to those contributing most significantly to the initial regeneration phase. At the tree level, the high IVI of R. apiculata was driven by RF, RD, and RC of 47.14%, 38.64%, and 28.12%. The significant contributions of these components indicate that R. apiculata has a relatively large number of individuals distributed across many plots and contributes substantially to the stand structure in terms of basal area. At the sapling level, the same species maintained the highest IVI (98.18%), with an RF, RD, and RC of 51.08%, 34.38%, and 12.73%. The consistently high IVI across both strata shows that R. apiculata is a key component shaping the community structure during both the sapling development phase and the mature stand stage.
According to Gaffar et al. [29], dominance based on the IVI does not indicate that the community structure is entirely controlled by a single species. They also reported that contributions from other species must still be considered, particularly because the components of the IVI could arise from distinct structural mechanisms [30]. For instance, R. mucronata showed RF of 14.00%, with RC reaching 28.12%. This discrepancy indicates that R. mucronata contributes proportionately more to the total basal area based on the number of individuals. Therefore, stand structure is determined by individual abundance, stem size, and diameter distribution, which influence the basal area.
Although Rhizophora apiculata exhibits high IVI values at the tree (113.90%) and sapling (98.18%) stages, and Ceriops tagal dominates the seedling stage (56.60%), these high values do not necessarily indicate ecological superiority or absolute resilience. Such dominance patterns may represent an adaptive response to a history of local disturbances or environmental stressors, which can, to some extent, suppress the biodiversity of other species within the community structure.
A similar pattern was observed at the sapling stage, where X. rumphii showed an RC of 21.04%, despite having an RF of 4.14%. This indicates that a relatively low number of individuals does not correspond to reduced structural contribution. Individuals with larger stem sizes can contribute to greater basal area, thereby increasing the RC value and influencing the IVI.
At the seedling stage, the dominance pattern shifted, with C. tagal becoming the species with the highest IVI (56.60%), driven by an RF and RD of 28.30% each. The shift from R. apiculata at the tree and sapling stages to C. tagal at the seedling stage shows that species composition and relative contributions vary throughout the community's ontogenetic development. These results are significant because the structure of a mature stand does not reflect the community composition during the early regeneration phase.
The IVI results indicate that R. apiculata plays a significant role in community structure at the tree and sapling stages, while C. tagal shows the highest relative contribution during the seedling phase. These differences suggest that the regeneration process includes a species composition that is not entirely identical to more developed stands [31, 32]. Therefore, interpreting mangrove community structure requires considering variations in species contributions across strata, rather than focusing on dominance at the tree stage.
Although this shift in dominance among growth stages is closely linked to environmental gradients, the pattern is best understood as an ecological interpretation consistent with the environmental filtering hypothesis and spatial interactions, rather than as a direct causal mechanism measurable in the absence of long-term demographic mortality data.
3.6 Species Diversity and Evenness
The analysis of the mangrove community reveals a dynamic shift in structure across growth stages (seedling, sapling, and tree). The seedling stage exhibits the highest Shannon-Wiener diversity (H' = 1.802) and Pielou's evenness (J' = 0.926) values, driven by a more equitable distribution of individuals among its seven species (Table 5). Conversely, while the tree stage comprises the highest species richness (10 species), it records a lower diversity index (H' = 1.649) and evenness (J' = 0.716), demonstrating that community diversity is determined by the interaction between species richness and individual abundance distribution rather than species count alone.
Furthermore, the sapling stage records the lowest H' value (1.603), heavily influenced by the significant dominance of Rhizophora apiculata, which accounts for 51.08% of the community's relative frequency. Ecologically, this pattern illustrates a progressive transition from a homogeneous, even distribution during early regeneration (seedling phase) to an oligarchic structure dominated by specific canopy species during the mature phases. This shift is driven by environmental filtering and intense interspecific competition for space, light, and nutrients, leading to competitive exclusion and single-species dominance as the vegetation succeeds from seedlings to saplings and trees.
Table 5. Shannon-Wiener diversity index (H′) and Pielou’s Evenness (J′) of mangrove communities based on growth stage
|
Growth Stage |
Number of Species (S) |
H′ |
Interpretation of Diversity |
J′ |
Interpretation of Evenness |
|
Tree |
10 |
1.649 |
Moderate |
0.716 |
Relatively even |
|
Sapling |
9 |
1.603 |
Moderate |
0.730 |
Relatively even |
|
Seedling |
7 |
1.802 |
Moderate |
0.926 |
Very even |
The high species richness at the tree stage, alongside the relatively lower H′ value, indicates that vegetation diversity is influenced by the number of species and the evenness of individual abundance. The tree stage contained the highest species richness (10 species) but showed a lower H′ value than the seedling stage, indicating an uneven distribution of individuals among species in the mature community. The H′ index is highly sensitive to relative abundance, with the presence of one or a few highly dominant species reducing species evenness (E) and overall H′ value despite high species richness [33, 34].
The low H' value at the sapling stage (1.603), driven by the high RF of R. apiculata (reaching 51.08%), supports the evidence of single-species dominance (a monospecific dominance pattern) within the strata. In mangrove ecosystems, R. apiculata possesses strong adaptive advantages due to the efficiency of its root system, high tolerance to the frequency of tidal inundation, and adaptability to soil salinity [35]. This significant dominance indicates that R. apiculata achieves higher recruitment and survival rates during the transition from the seedling to the sapling stage compared to other associated species.
Ecologically, the concentration of R. apiculata individuals creates a competitive filter, leading to competitive exclusion that restricts the development and growing space of other species attempting to advance to larger strata. This condition describes the concentrated distribution of individuals in the sapling strata among specific species, compared to the seedling strata, which tend to show a more even and heterogeneous composition [36].
Pielou’s Evenness Index (J') indicated differences in the distribution of individuals among species across the three growth stages. The highest J′ value was observed at the seedling stage (0.926), followed by the sapling stage (0.730) and the tree stage (0.716). These values indicate that the distribution of individuals at the seedling stage is more even than at the sapling and tree stages. At the seedling stage, a J′ value close to one suggests that individual abundance is relatively evenly distributed among the species found in the strata.
The elevated evenness value at the seedling stage is consistent with the highest H′ value (1.802), despite the 7 species present in the strata. However, the tree stage comprises 10 species, with a lower J′ value (0.716). This indicates that a portion of the individuals is more concentrated in specific species within the tree strata. Therefore, variations in H′ values across strata are determined by species richness and the distribution of individual abundance among the species constituting the community.
The gradual decline in J' from the seedling (J' = 0.926) through the sapling (J' = 0.730) to the tree strata (J' = 0.716) shows a shift in community structure, ranging from a homogeneous distribution during the early regeneration to a concentration of abundance in specific species during the mature phase. The J' value for seedlings at 0.926 indicates that during the initial germination stage, individuals are evenly distributed among species, without a single dominant species. This high level of evenness is responsible for the high H' value at 1.802, which is observed in the seedling strata.
In the tree strata, the decrease in the J' value to 0.716, despite high species richness (10 species), shows the occurrence of oligarchization or the concentration of individual abundance within a few canopy-dominant species. This phenomenon confirms the theoretical basis of vegetation ecology. The H' diversity index is sensitive to the evenness of abundance distribution, indicating that an accumulation of species does not linearly increase the H' value when offset by a rise in unevenness [37, 38].
From an ecological mechanism perspective, the decline in evenness across growth strata shows processes of environmental filtering and competitive exclusion that intensify throughout vegetation succession [39]. During the seedling phase, environmental micro-factors are relatively homogeneous for newly germinated propagules. As vegetation transitions to the sapling and tree stages, interspecific competition for canopy space, sunlight, and soil nutrients increasingly favors species with greater tolerance and dominant physiological responses [40]. Consequently, less competitive companion species are relegated to minority status, causing a greater individual density among a few dominant taxa and suppressing the J' value in older growth stages.
The integrated analysis showed changes in species composition and relative contribution throughout the community's development. At the tree and sapling stages, R. apiculata showed a strong relative contribution, while C. tagal had the highest relative contribution at the seedling stage. These differences indicate that a species making a significant contribution to a more developed stand is not having an impact during the initial regeneration stage. The dominance of R. apiculata at the tree and sapling stages, alongside the relative contribution of C. tagal at the seedling stage, indicates a shift in species contribution throughout the community's ontogenetic development. Suggesting a variation in species contribution across growth stages. However, this spatial pattern reflects differences in local recruitment, micro-habitat filtering, and spatial distribution rather than direct physiological ontogenetic shifts, as long-term demographic monitoring would be required to confirm true ontogenetic adaptation.
The high evenness value at the seedling stage indicates that early regeneration shows a more balanced distribution of individuals across species than more mature strata. This condition suggests that the regeneration process within the mangrove community still includes multiple species concurrently, although their contribution at the mature stand stage shows a pattern of stronger dominance. The high evenness observed in the seedling stage suggests initial recruitment, where the developing vegetation community has not experienced intense competitive selection. The balanced species abundance during this early regeneration indicates that propagules from various mangrove species can germinate and occupy microhabitats side by side, without being hindered by interspecific competition [41].
The shift from high evenness at the seedling stage to stronger dominance in mature stands shows the operation of post-settlement mortality and environmental filtering mechanisms. As the vegetation develops, limiting factors like salinity tolerance, tidal inundation frequency, and light-use efficiency (canopy gap dynamics) start to filter out less competitive species. Similarly, a previous study has shown that species possessing superior physiological and ecomorphological adaptations survive and progress beyond the transition phase, while companion species are relegated to a minority status within the canopy strata [42, 43].
3.7 Implications for mangrove ecosystem management
Mangrove management and ecological restoration should consider the overall community structure and functional heterogeneity rather than focusing solely on species with the highest IVI values. Because species contributions shift across growth stages with distinct roles observed from early regeneration to mature stands, rehabilitation initiatives must avoid monoculture planting, which can compromise structural complexity and reduce ecosystem resilience. Instead, restoration strategies should incorporate diverse local species with strong regenerative capacities. Furthermore, long-term monitoring of juvenile strata (seedlings and saplings) serves as a sensitive early-warning indicator for detecting ecological shifts and microclimate responses, offering more effective insights for adaptive management than observations limited to mature tree stands. These results show the importance of an ecological restoration-based rehabilitation paradigm that preserves local species heterogeneity, as monoculture planting may compromise ecosystem structural complexity and reduce vegetation resilience against environmental disturbances [44].
In this study, information on seedling regeneration is crucial, providing insight into the regenerative capacity of the community. Therefore, long-term monitoring of changes in seedling and sapling composition can yield more sensitive information regarding shifts in ecological conditions than observations focused on the tree stand. The presence of multiple species, such as C. tagal, S. alba, X. granatum, and the Rhizophora genus, within the seedling strata indicates that the potential sustainability of the mangrove ecosystem is supported by high functional diversity during the early stages of succession [45]. Long-term monitoring of the juvenile strata (seedlings and saplings) serves as a sensitive early-warning indicator for detecting shifts in ecological conditions and microclimate response dynamics compared to passive observation of mature tree stands [46, 47].
3.8 Relationships between environmental variables and mangrove vegetation structure based on Canonical Correspondence Analysis
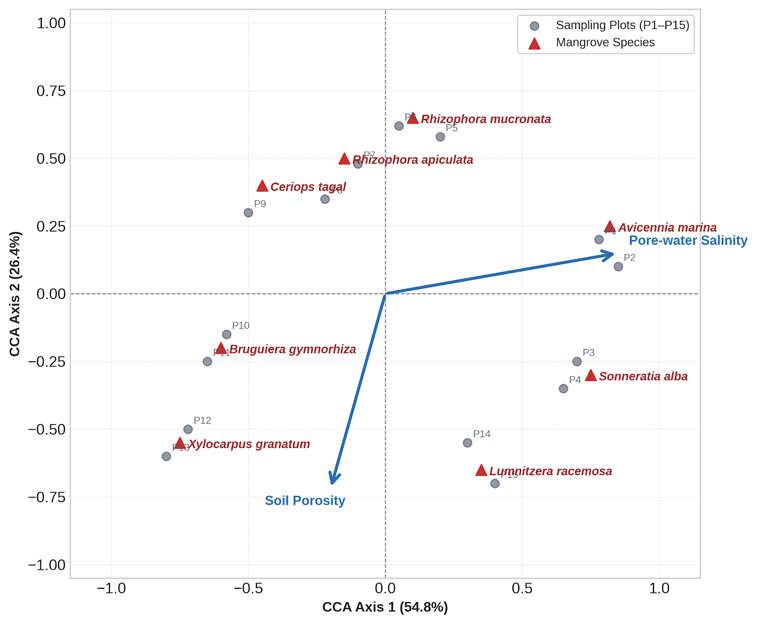
CCA was employed to map the response of the vegetation community to environmental gradients across the study site. With N = 15 sampling plots constrained by P = 2 significant forward-selected environmental predictors (pore-water salinity and soil porosity), the sample-to-variable ratio of 7.5:1 satisfies the threshold required for stable constrained ordination. A global Monte Carlo permutation test (999 iterations) confirmed that the constrained ordination model is highly significant (Pseudo-F = 5.21, p = 0.004), demonstrating that the captured species-environment pattern reflects true ecological dynamics rather than random spatial noise (Figure 2).
As illustrated in the ordination biplot (Figure 2 and Table 6), the first two constrained axes accounted for a cumulative 81.2% of the species-environment variance. Axis 1 explained 54.8% of this variation and was strongly positively correlated with pore-water salinity (r = 0.85, p < 0.001), effectively separating high-salinity species along the primary spatial gradient. Axis 2 explained an additional 26.4% of the variance and was negatively associated with soil porosity (r = -0.72, p = 0.002), highlighting substrate physical structure as a secondary constraint driving community zonation across the downstream transition zone.
Figure 2. Canonical Correspondence Analysis (CCA) biplot
Environmental variables included in the initial CCA screening were pore-water salinity, soil porosity, substrate pH, soil organic carbon, soil temperature, and dissolved oxygen. The main soil-related variables are presented in Table 6, while all variables used in VIF screening and forward selection are summarized in Table 7 to explain the spatial distribution of mangrove species abundance across seedling, sapling, and tree stages at three observation stations. A Monte Carlo permutation test confirmed that environmental variables had a statistically significant effect on the spatial distribution patterns of the vegetation (p = 0.004).
Multicollinearity diagnostics and forward selection results for the environmental parameters are summarized in Table 7. Substrate pH exhibited severe multicollinearity (VIF = 12.40) and was removed prior to constrained ordination to prevent spurious axis inflation. Among the remaining non-collinear variables, soil organic carbon (C-org, VIF = 3.81), soil temperature (VIF = 2.95), and dissolved oxygen (VIF = 4.12) were removed during forward selection because their conditional effects were not statistically significant (p = 0.318, p = 0.452, and p = 0.589, respectively; Table 7).
The final parsimonious CCA model retained two significant environmental variables: pore-water salinity (Pseudo-F = 6.42, p = 0.002) and soil porosity (Pseudo-F = 3.98, p = 0.012). Together, these two variables accounted for 81.2% of the constrained inertia in species distribution. The ratio of sample plots (N = 15) to retained constraining variables (P = 2) was 7.5:1, fulfilling the recommended threshold (>5:1) for stable ordination without overparameterization.
CCA following species data transformation and multicollinearity testing (VIF < 10) yielded a valid and statistically significant ordination model. Based on the Monte Carlo permutation test, the model explained a total of 81.2% of the constrained variance, with salinity and soil porosity demonstrating significant contributions to the spatial distribution of the vegetation community in the study area.
Table 6. Environmental quality parameters and soil porosity at each observation plot in the Poso watershed
|
Station |
Plot Code |
Salinity (ppt) |
Soil Porosity (%) |
Soil pH |
C-Organic (%) |
Criteria |
|
Mapane village |
ST1_P1 |
30.2 |
41.7 |
7.64 |
2.22 |
Sandy Mud |
|
ST1_P2 |
28.9 |
36.1 |
7.23 |
2.41 |
Sandy Mud |
|
|
ST1_P3 |
31.6 |
40.0 |
7.21 |
2.48 |
Sandy Mud |
|
|
ST1_P4 |
33.0 |
36.5 |
7.31 |
1.93 |
Sandy Mud |
|
|
ST1_P5 |
29.8 |
38.7 |
7.46 |
2.00 |
Sandy Mud |
|
|
Bega village |
ST2_P1 |
21.1 |
41.4 |
6.98 |
3.31 |
Fine Mud |
|
ST2_P2 |
19.6 |
47.9 |
6.92 |
3.52 |
Fine Mud |
|
|
ST2_P3 |
20.9 |
40.5 |
7.16 |
3.04 |
Fine Mud |
|
|
ST2_P4 |
15.7 |
49.5 |
7.38 |
3.93 |
Fine Mud |
|
|
ST2_P5 |
18.0 |
41.0 |
7.21 |
3.42 |
Fine Mud |
|
|
Masani village |
ST3_P1 |
2.1 |
58.4 |
6.22 |
2.02 |
Muddy Sand |
|
ST3_P2 |
3.3 |
60.6 |
6.42 |
1.67 |
Muddy Sand |
|
|
ST3_P3 |
5.9 |
54.4 |
6.88 |
1.90 |
Muddy Sand |
|
|
ST3_P4 |
9.5 |
63.6 |
6.62 |
2.03 |
Muddy Sand |
|
|
ST3_P5 |
1.8 |
54.5
|
6.23
|
1.49
|
Muddy Sand
|
Table 7. Variance Inflation Factor (VIF) initial values, forward selection results, pseudo-F statistics, and permutation significance (p-values) for environmental variables in the Canonical Correspondence Analysis (CCA) ordination model (N = 15 plots)
|
Environmental Variable |
Initial VIF |
Selection Status |
Forward Selection Step |
Pseudo-F |
p-Value |
Decision |
|
Pore-water Salinity (ppt) |
2.14 |
Retained |
Step 1 |
6.42 |
0.002* |
Included in Final CCA |
|
Soil Porosity (%) |
2.14 |
Retained |
Step 2 |
3.98 |
0.012* |
Included in Final CCA |
|
Organic Carbon / C-org (%) |
3.81 |
Excluded |
Step 3 |
1.12 |
0.318 |
Dropped (Not Significant) |
|
Soil Temperature (℃) |
2.95 |
Excluded |
Step 4 |
0.87 |
0.452 |
Dropped (Not Significant) |
|
Dissolved Oxygen / DO (mg/L) |
4.12 |
Excluded |
Step 5 |
0.64 |
0.589 |
Dropped (Not Significant) |
|
Substrate pH |
12.40 |
Excluded |
-
|
-
|
-
|
Dropped (VIF > 10)
|
Following VIF screening and forward selection (Table 7), substrate pH (VIF = 12.40) was excluded due to multicollinearity. The final constrained CCA ordination model retained two key environmental variables, pore-water salinity and soil porosity, which together explained 81.2% of total constrained variance in the species-environment relationship. Axis 1 accounted for 54.8% of the variance and was predominantly constrained by pore-water salinity (F = 6.42, p = 0.002; r = 0.85), driving the mangrove species assemblage along the primary gradient. Meanwhile, Axis 2 explained an additional 26.4% of the variance and was strongly driven by soil porosity (F = 3.98, p = 0.012; r = -0.72).
According to the spatial ordination mapping, the mangrove vegetation communities are clearly separated into three groups of stations, which are described as follows.
1. Station 1 (Estuary Mouth Area/Hypersaline Area): R. apiculata and Bruguiera gymnorhiza trees consistently cluster in the high-salinity area (28.9–33.0 ppt). This trend indicates that the adult stages of the two species possess the strongest physiological adaptation mechanisms and resilience against the osmotic stress of daily seawater exposure.
2. Station 2 (Mid-Estuary Area/Mesohaline Area): Regeneration stages, specifically C. tagal seedlings and saplings, show a strong correlation with areas characterized by fine-muddy substrates, high organic-C content (3.04–3.93%), and moderate salinity (15.7–21.1 ppt).
3. Station 3 (Upper Estuarine / Oligohaline Zone): The community is dominated by Sonneratia alba and Xylocarpus granatum, located in an area characterized by high soil porosity (54.4–63.6%), strong freshwater influence, and low salinity (1.8–9.5 ppt). This environment reflects species adaptation to lower osmotic stress and elevated terrestrial sediment deposition.
Spatial ordination mapping shows that mangrove vegetation distribution varies distinctly along salinity gradients and soil porosity across the continuum from the estuary mouth to the upstream reaches. This pattern is consistent with Cao et al. [48] and Kashem et al. [49], who identified species-specific physiological tolerance to osmotic stress and local edaphic conditions as key factors controlling the structure and successful regeneration of mangrove communities.
This study shows the spatial separation of ontogenetic stages, specifically between seedlings and mature trees, observed in certain species. Although R. apiculata dominates the tree strata at Station 1 (characterized by high salinity), the seedling regeneration is concentrated at Station 2, which features lower salinity and a muddy substrate. This indicates that salinity tolerance increases with vegetation age (an ontogenetic niche shift). However, the high IVI of C. tagal seedlings at Station 2 is closely connected to the muddy soil porosity, which facilitates nutrient retention and propagule stability. Therefore, CCA analysis confirms that variations in vegetation structure and diversity across stations in the Poso estuary are driven by the specific responses of different growth stages to salinity gradients and soil porosity.
The spatial segregation observed among seedling, sapling, and tree strata reflects cross-strata micro-habitat filtering and differential recruitment success rather than physiological ontogenetic adaptations. Seedlings exhibited broader spatial distribution along the salinity gradient, whereas mature trees showed narrower spatial grouping. This structural shift suggests that post-dispersal environmental filters, specifically pore-water salinity stress and soil porosity, selectively restrict seedling survival into sapling and tree life stages. Consequently, the observed distribution patterns represent stratum-dependent spatial sorting driven by localized hydrological and substrate constraints.
In conclusion, this study shows that the mangrove community in the downstream transition area of the Poso watershed exhibits cross-strata structural variations and regeneration dynamics driven by spatial environmental filtering rather than direct physiological ontogenetic shifts. The density and dominance of mature vegetation (R. apiculata) do not reflect the composition of early-stage regeneration (C. tagal). The observed shift in species evenness from the seedling stage (J′ = 0.926) to the tree stage (J′ = 0.716) confirms mechanisms of environmental filtering and competitive exclusion, which increasingly constrain successful vegetation recruitment as the plants mature. Furthermore, multivariate CCA analysis identifies salinity gradients and soil porosity as the two primary drivers of spatial zonation within the Poso estuary mangrove community. Regarding management implications, these results indicate that large-scale, monoculture-based rehabilitation can be inappropriate across environmentally heterogeneous areas. It is important to note that the restoration recommendations prioritizing species such as Rhizophora apiculata, Bruguiera gymnorhiza, and Ceriops tagal for these specific environmental conditions are presented as preliminary ecological suggestions based on spatial correlations; consequently, they require further field testing and validation before being applied as prescriptive protocols for full-scale restoration.
This study demonstrates that mangrove community distribution in the downstream Poso watershed is governed by pore-water salinity and soil porosity gradients. Analysis of cross-strata spatial patterns reveals that micro-habitat filtering during early recruitment plays a decisive role in shaping mature tree canopy zonation. Recognizing these stratum-specific spatial dynamics provides a scientific baseline for targeted mangrove restoration, ensuring species matching according to localized substrate and salinity conditions.
These findings provide important insights into the structure of mangrove vegetation communities, reflecting spatial adaptation patterns and ecological responses to environmental variations in the downstream transition zone of the Poso watershed. Additionally, future assessments of restoration success should incorporate monitoring of juvenile strata, particularly seedlings and saplings, as early indicators of changes in the stability and resilience of the mangrove ecosystem.
Overall, this study makes a significant scientific contribution by offering a stratum-based spatial evaluation framework for the downstream transition zone of the watershed, thereby enriching theoretical understanding of succession dynamics and the sustainable management of mangrove ecosystems.
The authors are grateful to the Directorate of Research and Community Service for supporting this study through the New Research Program Implementation (DIPA DPPM) under the Doctoral Dissertation Research Scheme for the 2026 Fiscal Year, as stipulated in Contract Number 281.33/DST/UN28.16/AL.04.03/2026 dated May 7, 2026. Furthermore, the authors are grateful to the Rector of Tadulako University, the Head of the Institute for Research and Community Service, and the students of the "Independent Internship for an Impactful Campus" program from the Faculty of Forestry, Tadulako University, for their valuable support in the execution of this study.
[1] Haseeba, K.P., Aboobacker, V.M., Vethamony, P., Al-Khayat, J.A. (2025). Significance of Avicennia marina in the Arabian Gulf environment: A review. Wetlands, 45(1). https://doi.org/10.1007/s13157-025-01899-8
[2] Lovelock, C.E., Hagger, V., Feller, I.C., et al. (2025). Mangrove biodiversity and ecosystem services. Nature Reviews Biodiversity, 1(12): 772-787. https://doi.org/10.1038/s44358-025-00103-3
[3] Khan, S., Dhadse, S. (2025). Carbon sequestration by terrestrial and marine biodiversity-A tool for combating climate change. Sustainability and Biodiversity Conservation, 4(2): 69-88. https://doi.org/10.5281/zenodo.15623594
[4] Arifanti, V.B., Basyuni, M., Suharti, S., et al. (2025). Assessing the environmental and socioeconomic impacts of mangrove loss in Indonesia: A synthesis for science-based policy. Forest Science and Technology, 21(4): 430-446. https://doi.org/10.1080/21580103.2025.2536595
[5] Ma, X., Li, Y., Niu, L.H., et al. (2025). Hydrodynamic processes influence nitrous oxide production and emission potential in a mountainous river estuary: Insights from microbial community patterns and model predictions. Limnology and Oceanography, 70(10): 2815-2828. https://doi.org/10.1002/lno.70170
[6] Naharuddin, N. (2021). The critical level of mangrove ecosystem in Lariang watershed downstream, West Sulawesi-Indonesia. International Journal of Sustainable Development and Planning, 16(5): 841-851. https://doi.org/10.18280/ijsdp.160505
[7] Agyekum, M.K., Riascos, J.M. (2026). Evaluating the role of the understory mangrove fern Acrostichum aureum in mangrove sediment organic matter and carbon dynamics. Scientific Reports, 16(1): 20982. https://doi.org/10.1038/s41598-026-60454-5
[8] Mojid, M.A., Mainuddin, M., Karim, F., Wahid, S.M. (2025). Historical and projected future hydrological characteristics of the mangrove forest in the Ganges Delta—A review. Water, 17(6): 838. https://doi.org/10.3390/w17060838
[9] Oyedotun, T.D.T. (2026). Effect of sediment physicochemical properties and sedimentary pollution on mangrove sustainability in a coastal environment. Interdisciplinary Environmental Review, 25(2): 149-184. https://doi.org/10.1504/IER.2026.152830
[10] Farhath, A.A., Nandan, S.B., Sreelekshmi, S., et al. (2025). Mangrove ecosystems in the Maldives: A nationwide assessment of diversity, habitat typology and conservation priorities. Earth, 6(3): 66. https://doi.org/10.3390/earth6030066
[11] Horn, S., Pho, S., Sreng, S., Pech, S. (2026). Species composition and diversity using importance value index (IVI) and diversity indices across upland forest types in Cambodia: A scoping review. Journal of Agriculture and Environment, 3(2): 1-14. https://doi.org/10.6084/m9.figshare.31044892
[12] Alamsyah, M.N., Chandra, A., Arief, M. (2025). Governing the infrastructure in Indonesia: An empirical evidence from the Sulewana hydropower plants of Lake Poso, Central Sulawesi. Acta Scientiarum Polonorum Administratio Locorum, 24(4): 533-549. https://doi.org/10.31648/aspal.11366
[13] Yani, R.A., Naharuddin, N., Toknok, B., et al. (2024). Analysis of changes and criticality level of mangrove forest ecosystem as a basis for rehabilitation downstream of Poso Watershed Area, Central Sulawesi, Indonesia. Biodiversitas: Journal of Biological Diversity, 25(9): 3179-3191. https://doi.org/10.13057/biodiv/d250940
[14] Li, J.W., Chen, L., Zhang, C.Z., et al. (2024). Combining rotary and deep tillage increases crop yields by improving the soil physical structure and accumulating organic carbon of subsoil. Soil and Tillage Research, 244: 106252. https://doi.org/10.1016/j.still.2024.106252
[15] Tilman, E., Santoso, N., Soekmadi, R. (2024). Mangrove vegetation analysis in mangrove ecosystems in the Coastal Area of Bazartete, Liquica District Timor-Leste. Media Konservasi, 29(2): 294. https://doi.org/10.29244/medkon.29.2.294
[16] Rahman, M.M., Zimmer, M., Rahman, M.S., et al. (2026). Functional composition and structural diversity enhance mangrove forest resilience in the Sundarbans. Communications Earth & Environment, 7(1): 291. https://doi.org/10.1038/s43247-026-03305-5
[17] Purba, G.Y., Safitri, I., Sofiana, M.S.J., Budiarsa, A.A., Farhaby, A.M. (2025). Indicators of resilience: Mangrove density and important value index as measures of ecosystem health–A case study in Desa Sarang Burung Kolam West Kalimantan. Egyptian Journal of Aquatic Biology and Fisheries, 29(5): 979-999.
[18] Rosmiatinnafiz, E.R., Fauzan, A. (2026). Mangrove community structure in the Bale Mangrove Ecotourism Area, East Lombok. Journal of Biology, Environment, and Edu-Tourism, 2(1): 220-228. https://doi.org/10.65622/jbee.v2i1.264
[19] Pulido, R.L., Casendac, E.F., Rozano, M.J., et al. (2025). Assessment of mangrove species diversity in the Municipality of Nasipit, Agusan del Norte, Philippines. Jurnal Sylva Lestari, 13(3): 761-773. https://doi.org/10.23960/jsl.v13i3.1192
[20] Pietersz, J.H., Tupan, C.I., Rijoly, S.M.A., Pentury, R. (2026). Comparative study of mangrove diversity and canopy cover on the North and South Coasts of Nila Island, Central Maluku Regency. Depik: Jurnal Ilmu-Ilmu Perairan, Pesisir dan Perikanan, 15(1): 104-116. https://doi.org/10.24815/depik.15.1.729
[21] Gutierrez, J.C., Manansala, J.P.G., Maclang, K.E., Miguel, L.M.L., Mendoza, P.C., Tadiosa, E.R. (2026). Analysis of true mangrove species diversity, carbon storage, and associated species in Coastal villages of Tibaguin and Sta. Elena, Hagonoy, Bulacan, Philippines. Asian Journal of Biodiversity, 17(1): 151-198. https://doi.org/10.7828/ajob.v17i1.1747
[22] Albertin-Santos, C.J., Ferreira, E.J.G., Zuanon, J. (2026). Taxonomic composition and trophic guild structure of fish assemblages on Amazonian lake beaches and their relationships with local environmental variables. Environmental Biology of Fishes, 109(3): 110. https://doi.org/10.1007/s10641-026-01882-0
[23] Restrepo, V.B., Castañeda-Moya, E., Kominoski, J.S., Solohin, E. (2025). Multiple factors explain species-specific regeneration of mangrove seedlings and saplings after a major hurricane. Ecosphere, 16(6): e70298. https://doi.org/10.1002/ecs2.70298
[24] Anggraeni, P.D., Safitri, I., Kushadiwijayanto, A.A. (2026). Ecological structure of mangrove communities in the Dabong Village Forest, Kubu Raya, West Kalimantan. Egyptian Journal of Aquatic Biology and Fisheries, 30(2): 2807-2828.
[25] Cheng, C., He, M.M., Zhong, C., Lv, X.B., Yang, H.J., Wang, W.Q. (2026). Ecological trade-offs between mangrove expansion and waterbird diversity: Guild-specific responses to pond-to-mangrove restoration. Animals, 16(2): 299. https://doi.org/10.3390/ani16020299
[26] Baderan, D.W.K., Rahim, S., Angio, M.H., et al. (2026). Vegetation structure and species diversity in the Anggrek Coastal Mangrove Forest of Gorontalo, Celebes, Indonesia. Egyptian Journal of Aquatic Biology and Fisheries, 30(1): 3683-3712.
[27] Fahrizal, A., Kasnir, M., Rauf, A. (2025). A study of the relationship between mangrove ecological metrics and environmental factors in Aimas District, Southwest Papua. Egyptian Journal of Aquatic Biology and Fisheries, 29(6): 1055-1073.
[28] Agnihotri, A., Tewari, A., Ali, S. (2026). Tree layer composition and regeneration status of Quercus floribunda Lindl. on different aspects of Nainital catchment in Kumaun Himalaya. Journal of Environmental Science and Sustainable Development, 9(1): 207-227. https://doi.org/10.7454/jessd.v9i1.1453
[29] Gaffar, A.A., Marianti, A., Saptono, S., Marwoto, P., Nugroho, S.E. (2026). Analysis of vegetation and ecosystem components of Mount Ciremai National Park (MCNP) with key indicators of species, density, frequency, dominance, and calculation of Important Value Index (IVI). Journal of Environment and Sustainability Education, 4(2): 384-394. https://doi.org/10.62672/joease.v4i2.192
[30] Meneses, O.M., Ribeiro, N.S., Shirvani, Z., Andrew, S.M. (2025). Resilience of the Miombo Woodland to different fire frequencies in the LevasFlor Forest Concession, Central Mozambique. Forests, 16(1): 10. https://doi.org/10.3390/f16010010
[31] Wang, Z.Y., Guo, F., Zeng, X.L., et al. (2025). Trade-offs in aboveground and soil mangrove carbon stocks under species introduction: Remote sensing reveals temporal divergence in restoration trajectories. Forests, 16(11): 1696. https://doi.org/10.3390/f16111696
[32] Seliger, A., Ammer, C., Kreft, H., Zerbe, S. (2023). Diversification of coniferous monocultures in the last 30 years and implications for forest restoration: A case study from temperate lower montane forests in Central Europe. European Journal of Forest Research, 142(6): 1353-1368. https://doi.org/10.1007/s10342-023-01595-4
[33] Bita-Nicolae, C., Florescu, L.I., Purice, D., Kaya, O. (2024). Riparian woody plant communities in the Romanian Carpathians: Species diversity and community structure of Salix and Hippophaë communities. Ecology and Evolution, 14(5): e11361. https://doi.org/10.1002/ece3.11361
[34] Shao, O.W., Li, Y.J., Gu, W.F., et al. (2025). Assessment of macrobenthos in evaluating the restoration effects of artificial mangrove planting on tidal flats in Zhejiang, China. Marine Environmental Research, 204: 106930.
[35] Behera, D.P., Ravinesh, R., Prabhadevi, L., Dixit, D., Ingle, K.N. (2026). Flooding stress adaptations: Evolutionary mechanisms of mangrove tolerance. Journal of Aquatic Plants, 2: 100014. https://doi.org/10.1016/j.jap.2026.100014
[36] Samsidar, S. (2025). Vegetation structure and species diversity in secondary forests as indicators of ecosystem stability. Journal of Horizon, 2(2): 52-64. https://doi.org/10.62872/jh.v2i2.564
[37] Moniuszko, H., Łukowski, A., Przybysz, A., Nawrocki, A., Popek, R. (2025). Roadside noise barriers as biodiversity refuges under pressure: The role of particulate matter in shaping invertebrate communities. Land Degradation & Development, 36(16): 5613-5627. https://doi.org/10.1002/ldr.70024
[38] Ainy, N.S., Sjahfirdi, L., Patria, M.P., Harinaldi, H., Mujadid, I. (2026). Spatial analysis of fish diversity, evenness, and dominance during the seasonal transition period for ecosystem health assessment. Journal of Biology Education Research (JBER), 7(1): 22-39. https://doi.org/10.55215/jber.v7i1.105
[39] He, S., Li, D., Yang, X., Qi, D., Shang, N., Liang, C., Du, C. (2025). Environmental heterogeneity drives diversity across forest strata in Hopea hainanensis communities. Diversity, 17(8): 556. https://doi.org/10.3390/d17080556
[40] Budiman, M.A.K., Oue, H., Afandy, A., Al Anshori, Z., Mulyana, D. (2025). Inter-species competition analysis between native lowland forest trees to optimize land rehabilitation management in Bedegung Biodiversity Park, South Sumatra, Indonesia. Jurnal Pengelolaan Sumberdaya Alam dan Lingkungan (Journal of Natural Resources and Environmental Management), 15(4): 680. https://doi.org/10.29244/jpsl.15.4.680
[41] Meysick, L., Merder, J., Pilditch, C., et al. (2026). Facilitation and constraint: Wave exposure and intraspecific interactions influence mangrove seedling morphology and resistance to dislodgement. Journal of Ecology, 114(1): e70215. https://doi.org/10.1111/1365-2745.70215
[42] Madhavan, C., Meera, S.P., Kumar, A. (2025). Anatomical adaptations of mangroves to the intertidal environment and their dynamic responses to various stresses. Biological Reviews, 100(3): 1019-1046. https://doi.org/10.1111/brv.13172
[43] Jiang, G.F., Qin, B.T., Luo, L.D., et al. (2026). Convergent evolution of cell size enables adaptation to the mangrove habitat. Current Biology, 36(1): 252-258. https://doi.org/10.1016/j.cub.2025.11.036
[44] Teixeira, B., Santos, P., Cialdella, N., Rogez, H. (2026). Açaí (Euterpe spp.) and the Sustainable Development goals: A systematic review of innovations, gaps, and challenges in the “purple gold” bioeconomy. Scientometrics, 131(3): 1897-1945. https://doi.org/10.1007/s11192-026-05541-0
[45] Aznawi, A.A., Basyuni, M., Siregar, L.A.M., et al. (2026). Mangrove structure, composition, and distribution through restoration of Indonesia’s mangrove: A systematic review. Forest Science and Technology, 1-19. https://doi.org/10.1080/21580103.2026.2650303
[46] Aguilos, M., Zhang, J., Belgado, M.L., Sun, G., McNulty, S., King, J. (2025). Determining early warning thresholds to detect tree mortality risk in a Southeastern US Bottomland hardwood wetland. Forests, 16(8): 1255. https://doi.org/10.3390/f16081255
[47] Candotti, A., Fassnacht, F.E., Malenovský, Z., Tomelleri, E. (2026). Recent advances in remote sensing for early detection, risk prediction, and post-disturbance assessment of bark beetle attacks in temperate and boreal forests. Current Forestry Reports, 12(1): 2-22. https://doi.org/10.1007/s40725-026-00272-0
[48] Cao, Y., Zhou, W., Peng, Y., et al. (2026). Spatial patterns of plant diversity, biomass allocation and vegetation biomass carbon storage in major mangrove forests of Hainan, China. Plants, 15(15): 2355. https://doi.org/10.3390/plants15152355
[49] Kashem, M.A., Rahman, M.A., Hossain, M.Z. (2026). Species-specific leaf trait variation in dominant mangrove tree species across contrasting salinity zones in the Sundarbans, Bangladesh. Journal of Aquatic Plants, 2: 100012. https://doi.org/10.1016/j.jap.2026.100012