Yasir M. Y. Ameen* | Wael H. Hamdon | Mohamad N. Abdul Kadir
© 2026 The authors. This article is published by IIETA and is licensed under the CC BY 4.0 license (http://creativecommons.org/licenses/by/4.0/).
OPEN ACCESS
Centralized power conversion can reduce duplicated rectification, power factor correction, isolation, and control hardware in clustered light-emitting-diode (LED) installations, but its feasibility depends on maintaining both grid-side power quality and feeder-side regulation. This paper proposes a two-stage power supply combining a wide-input non-inverting buck–boost power-factor correction (PFC) front end with an isolated full-bridge converter supplying five 150 V/150 W feeder outputs. The main contribution is a coordinated feeder-level architecture that integrates input-current shaping, regulated DC-link operation, and isolated multi-output distribution within one supply, supported by switching-level assessment of the integrated and balanced operating points and by quantitative assessment of the cross-regulation limits under unequal feeder loading. With one PI/PWM controller set, the switching-level PFC model achieves PF = 0.9944–0.9992, THD40 = 1.35–5.73%, and Vdc = 379.66–379.83 V. At 230 Vrms, the integrated VF-HCC switching model delivers 748.70 W with PF = 0.99679, THD40 = 4.0815%, and a mean feeder voltage of 149.87 V. A separate isolated-stage switching model reports feeder-to-feeder mismatch below 0.001%, while equivalent-model severe unloading studies reveal the expected cross-coupling limitation of the shared-transformer architecture. The results support centralized conversion for predictably loaded LED feeders and indicate the need for secondary overvoltage protection or local post-regulation under severe imbalance.
buck-boost power-factor correction, centralized LED feeder, cross-regulation, isolated full-bridge converter, multi-output DC/DC converter, power quality, universal-input LED supply
The widespread adoption of light-emitting-diode (LED) technology has transformed a substantial portion of building lighting into an electronically interfaced and controllable load. While LEDs offer high luminous efficacy, controllability, and long service life, the interaction between the LEDs and the supply network is controlled primarily by the front-end driver. A diode rectifier and a bulk capacitor are often used by low-cost drivers, which results in the line current being drawn in narrow pulses around the supply-voltage peaks. The resulting power factor and harmonic-emission problem is confirmed by measurements and models of LED lighting loads [1-3]. The harmonic-current limits are specified at the equipment level in IEC 61000-3-2 [4], and the feeder-level analysis of rectifier-capacitor LED fixtures shows that the collective behavior of several luminaires can be significantly different from that of a single luminaire [5]. The engineering concern in a dense lighting feeder is thus the total RMS current, the amount of harmonics injected, the loading of the cable and transformer, and the voltage distortion at the point of common coupling.
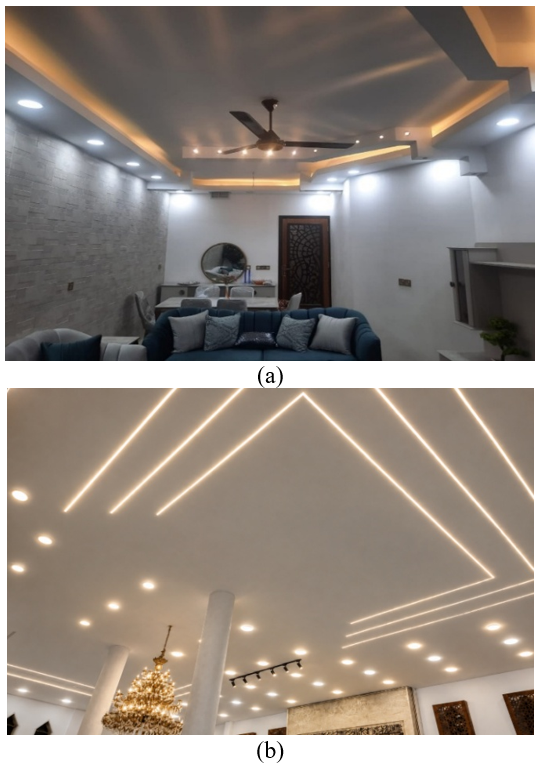
Figure 1 shows typical LED lighting installations with many downlights, strip lights, and decorative units using local drivers. This large number of drivers supports the idea of using one centralized unit for rectification, PFC, isolation, and control. Electrically, the aggregated luminaires remain nonlinear loads, making feeder-level power-quality correction essential.
The accepted method for reducing the low-order harmonic currents of rectifier-fed electronic loads is active power-factor correction (PFC). To achieve input-current shaping and LED-current regulation, galvanic isolation, ripple reduction, and improved LED lifetime, isolated, bridgeless, single-stage, and two-stage LED drivers have been developed [6-9]. These studies show that high power factor and low input current total harmonic distortion (THD) can be achieved, but most are luminaire-based or single-output based. Therefore, rectification, filtering, PFC magnetics, switching devices, sensing, control, and protection are repeated in each lighting unit. For clustered lighting installations, centralized DC supply has been suggested to enable a single AC/DC stage to power multiple luminaires or lighting zones [10, 11]. Residential-lighting surveys and commercial-lamp studies also indicate that energy use, power factor, and harmonic emission depend on fixture distribution, driver design, lamp operating condition, and component values [12, 13]. However, the prevailing research trend is still focused on one LED load or one regulated output, as reflected in representative studies and reviews [14-17]. The DC micro-grid and nano-grid studies at the building level suggest that the advantages of centralized conversion are reduced conversion duplication, coordinated monitoring, and the ease of integration with PV generation and energy storage [18-21]. However, centralization still requires compliance with harmonic, LED current-modulation, and control-gear requirements [22-24]. Feeder voltage drop, DC fault protection, redundancy, and common-converter failure must also be considered. Its benefit therefore depends on coordinated converter and distribution design, not simply replacing AC with DC. In the present application, a single non–isolated DC bus is insufficient because the lighting zones require galvanically isolated feeder outputs. Providing an independent isolated converter for each feeder would improve decoupling, but would reduce the component-count and power-density benefits of centralization. A full-bridge converter with a multi-secondary high-frequency transformer offers a more integrated solution by sharing the primary bridge, magnetic core, and part of the control hardware among several outputs. Full-bridge conversion is well established at medium power and provides effective transformer utilization [25-27]. On the input side, bridgeless boost-PFC structures can reduce conduction losses [28], but their control margin decreases when the regulated DC–link voltage approaches the peak of the highest AC input. This limitation can be expressed by
$\gamma_v=\frac{\sqrt{2} V_{\text {in,rms,max}}}{V_{\text {dc,nom}}}$ (1)
Here, $V_{\text {in,rms,max}}$ is the maximum input RMS voltage and $V_{\text {dc,nom}}$ is the nominal DC-link voltage.
As the rectified input approaches the DC-link level, the available voltage margin for input-current shaping becomes small; at low line, the current stress is instead dominant. The non-inverting buck-boost front end is therefore used for wide-input current shaping; the reported gate patterns hold the input leg on/off and do not establish a buck-mode transition.
Centralization also introduces output-regulation challenges. Existing studies on centralized LED supplies and building-level DC systems mainly address distribution architecture and system feasibility [29, 30], whereas multi–output converter studies identify cross–regulation as a major limitation of shared magnetic structures [31]. Because the outputs share one transformer and one primary-side command, their voltages are coupled through winding resistance, leakage inductance, rectifier drops, filter impedances, and unequal loading. Secondary post-regulation and weighted multi–output feedback can reduce this interaction [32, 33].
Figure 1. Representative high-density LED lighting installations: (a) recessed and linear LED luminaires in a modern residence, and (b) dense recessed and indirect LED lighting in a large public hall
Table 1. Quantitative comparison of representative studies and the proposed system
|
Study |
Input/Rating |
Outputs |
PF |
THD (%) |
Regulation Metric |
Independent Control |
|
Cheng et al. [6] |
110 V AC; 72 W |
1 × 36 V |
0.9816 |
12.094; H NR |
9.7% voltage ripple; error NR |
Single output |
|
Gritti and Adragna [9] |
90–264 V AC; 33.6 W |
1; 24–48 V |
>0.98 |
About 4; H NR |
±1.4% current accuracy at 50–100% load |
Single output |
|
Gacio et al. [15] |
Universal AC input |
1 LED output |
NR |
NR |
Comparable voltage error NR |
Single output |
|
Celidonio et al. [29] |
Centralized AC/DC |
Distributed LED loads |
NR |
NR |
Numerical feeder error NR |
NR |
|
Litran et al. [31] |
Review; varied inputs |
Multiple topologies |
NA |
NA |
Review of output coupling |
Topology-dependent |
|
Park et al. [32] |
90–264 V AC system; 120 W |
2 LED channels + auxiliary |
NR |
NR |
Scalar voltage-error bound NR |
Secondary current regulation |
|
Dindar et al. [33] |
50–80 V DC; 45.6 W |
3; 3.3¹/12/15 V |
NA |
NA |
3.33% max nominal voltage error¹ |
No; shared weighted feedback |
|
Present PFC stage |
85–265 V AC; ≈749 W |
1 DC link |
0.99437–0.99917 |
1.347–5.734; H = 40 |
DC-link mean error ≤0.091% |
NA for multiple outputs |
|
Present integrated point |
230 V AC; 748.70 W |
5 × 150 V |
0.99679 |
4.0815; H = 40 |
Mean feeder error −0.089%² |
No; common mean loop |
|
Present isolated stage |
380 V DC; 748.147 W |
5 × 150 V |
NA |
NA |
Mean error ≤0.130%; mismatch <0.001% |
No; common mean loop |
Table 1 compares quantitatively representative studies relative to this combined problem.
NR denotes a comparable numerical value not established in this comparison, not proof that the source omits it; NA denotes not applicable. The 3.33% error is derived from the reported 3.41 V maximum of the 3.3 V rail in reference [33]. The integrated point is subject to the energy-accounting limitation in Section 4.2.
Although input-current shaping, centralized DC distribution, and multi-output isolation are individually well established, their coordinated evaluation from an 85-265 Vrms/50 Hz AC input to several independently loaded isolated feeders remains limited. Input-side validation alone cannot establish output-side suitability, while balanced loading does not reveal the overvoltage that may occur under severe imbalance or feeder disconnection. This paper therefore proposes and evaluates a centralized feeder-level architecture combining a wide-input non-inverting buck-boost PFC front end with an isolated multi-output full-bridge distribution stage. Its main contributions are:
1. A coordinated architecture integrating wide-input PFC operation, regulated DC–link energy buffering, galvanic isolation, and five isolated feeder outputs.
2. A focused validation framework comprising a switching-level no-PFC reference, switching-level PFC power-quality verification, an integrated PFC-plus-five-output switching case at 230 Vrms, and switching-level assessment of the isolated five-output stage at the nominal operating point.
3. A quantitative equivalent-model assessment of balanced, partially loaded, near-disconnected, and dynamic feeder conditions to identify the principal cross-regulation and secondary-side protection limits of the shared-transformer architecture.
2.1 System architecture
The proposed supply centralizes rectification, PFC, isolation, and DC distribution for clustered lighting feeders. The 150 V feeder outputs are modeled as nominal DC feeder ports that may supply local LED current regulators or equivalent downstream LED modules; raw LED-string current regulation is outside the scope of the central converter model.
Sharing the PFC stage, primary bridge, transformer core, sensing, and control reduces duplicated hardware. The trade-off is that galvanic isolation does not imply independent regulation: the five feeder voltages remain coupled through the common excitation and conversion-path impedances.
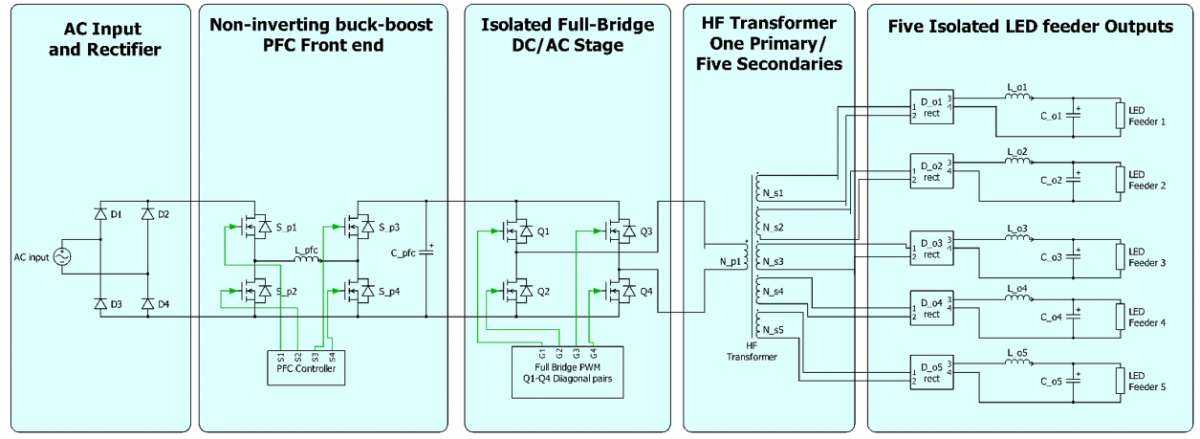
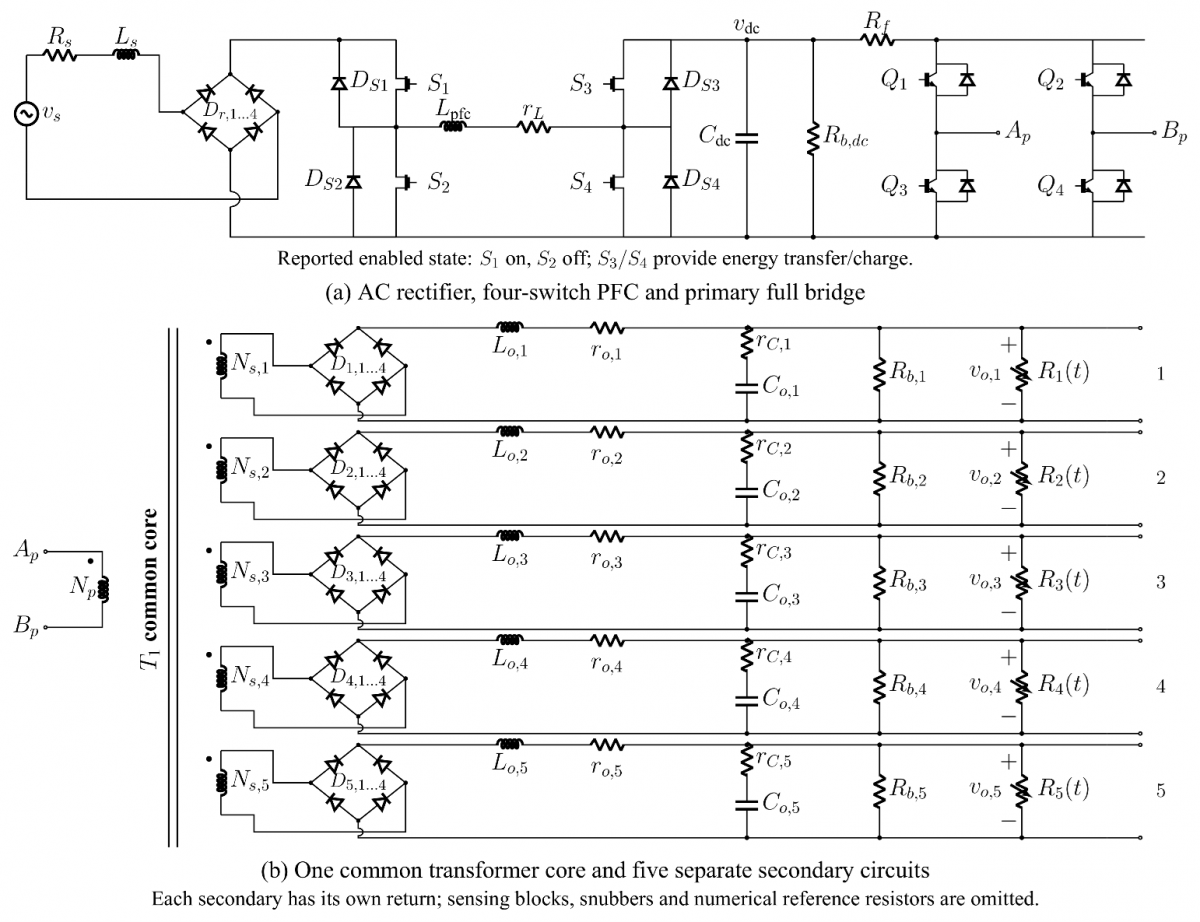
Figure 2 summarizes the two-stage architecture and the distribution of power from the PFC front end through the common DC link and isolated full bridge to the five LED feeders. The corresponding component-level schematic is provided in Appendix (Figure A1), showing the power-stage interconnections and the individual secondary rectifier, filter, and load circuits in greater detail.
Figure 2. Proposed centralized two-stage supply comprising a non-inverting buck–boost power-factor correction (PFC) front end, regulated DC link, isolated full bridge, multi-secondary transformer, and five LED feeder outputs
2.2 Power-factor correction front end and DC–link interface
The front-end controller regulates a nominal 380 V DC link while shaping the rectified input current. The accepted integrated model uses an outer PI voltage regulator and an inner voltage-feedforward shaped hysteresis current controller (VF-HCC). In this integrated strategy, Lin = 2 mH, the discrete control/update timing base is 100 kHz, the VF-HCC band is max (0.05 A, 0.03 iref), the enable delay is 1 ms, and the current reference is shaped with γ = 0.78. At each update, the implemented current reference is given by Eq. (2), with lower-bound protection in the RMS and voltage-normalization denominators and with the normal current-reference ceiling listed in Table 2. The outer loop supplies the power command, limited by anti-windup and over-voltage/over-current protection, while the VF-HCC loop shapes the line-current envelope using the magnitude of source voltage to follow the rectified mains voltage.
$\begin{aligned} q(t) & =\max \left(\frac{\left|v_s(t)\right|}{\max \left(\sqrt{2} V_{\text {rms }}, 85 \mathrm{~V}\right)}, 10^{-6}\right) \\ i_{\text {rec }}^*(t) & =\operatorname{sat}_{\left[0, I_{\text {ref,max }}\right]}\left[\frac{P_{\text {cmd }}\left|v_s(t)\right| q(t)^{\gamma-1}}{\max \left(V_{\text {rms }}^2,(85 \mathrm{~V})^2\right)^2}\right]\end{aligned}$ (2)
Here, Pcmd is generated by the outer voltage loop, Vrms is the filtered mains-RMS estimate, γ is the reference-shaping exponent, and the saturation clips the reference to 0–Iref,max.
In Eq. (2), $v_s$ is source voltage, $q$ is dimensionless and $\gamma=$ 0.78. The 40 ms estimator filters $\pi\left|v_s\right| /(2 \sqrt{2})$ and is calibrated for sinusoidal mains, not general true RMS. The full hysteresis band is $\Delta i=\max \left(0.05 \mathrm{~A}, 0.03 i_{\text {rec }}^*\right)$, with thresholds $i_{\text {rec }}^* \pm \Delta i / 2$. Its 10 µs update is not a fixed switching period, and the 0.5 µs dwell check does not insert complementary-device dead time.
$C_{\mathrm{dc}} V_{\mathrm{dc}} \frac{\mathrm{d} V_{\mathrm{dc}}}{\mathrm{d} t}=p_{\mathrm{pfc}}(t)-p_{\mathrm{fb}}(t)$ (3)
where, $p_{\mathrm{pfc}}(t)$ is the net power entering the capacitor node and $p_{\mathrm{fb}}(t)$ is the total power leaving that node, including shunt demand. Here, Cdc is DC-link capacitance and Vdc its instantaneous voltage. This energy buffer prevents rapid feeder-load variations from being transferred directly to the mains-current controller. The non-inverting buck-boost topology preserves control authority both at low line, where large step-up and current are required, and near the high-line crest, where voltage margin is smallest.
A load increase initially lowers DC-link voltage; the outer PI raises the current-reference amplitude. Input voltage affects reference scaling and inductor voltage. The integrated bus starts at 380 V with bridge enable after 1 ms, not from a cold start.
2.3 Isolated full-bridge distribution stage
The regulated DC link supplies a full bridge that applies a symmetrical three-level voltage to the transformer primary. The primary and secondary winding voltages are represented by
$\begin{gathered}v_{\mathrm{p}}(t)=s_{\mathrm{fb}}(t) V_{\mathrm{dc}}(t), \quad s_{\mathrm{fb}} \in\{-1,0,+1\} \\ v_{\mathrm{s}, i}(t)=n_i v_{\mathrm{p}}(t), \quad n_i=\frac{N_{\mathrm{s}, i}}{N_{\mathrm{p}}}\end{gathered}$ (4)
where, $v_{\mathrm{p}}$ is primary voltage, $v_{\mathrm{s}, i}$ is secondary voltage, $s_{\mathrm{fb}}$ is the bridge polarity state, and $n_i=N_{\mathrm{s}, i} / N_{\mathrm{p}}$ is the turns ratio of the i-th secondary winding. The positive and negative bridge intervals provide symmetrical transformer excitation, while the zero states establish the controllable power-transfer interval and gate non-overlap scheduled between complementary switches.
After secondary rectification and LC filtering, the average feeder voltage can be expressed in the general form
$\bar{V}_{\mathrm{o}, i} \approx M_{\mathrm{fb}} n_{\mathrm{i}} V_{\mathrm{dc}}-\Delta V_{\mathrm{path}, i}$ (5)
where, $M_{\mathrm{fb}}$ is the effective conversion factor associated with the applied phase-shift modulation, dead time, rectification sequence, and commutation intervals. The term $\Delta V_{\mathrm{path}, i}$ represents the load-dependent voltage drop across the transformer winding, rectifier, output inductor, and other conduction-path impedances. Physical modulation is the sum of the measured positive and negative primary-voltage pulse widths divided by the bridge period; it is distinct from the controller command.
The five channels use matched turns ratios and filters, giving nearly identical operating points under balanced loading. Section 3 specifies the transformer ratio, modulation range, full-bridge gate non-overlap, and filter values; Section 5 evaluates nominal operation.
3.1 Front-end energy-storage design
The design covers 85-265 Vrms and 750 W aggregate output. Low line sets the current rating, whereas high line provides the smallest shaping margin. The PFC energy-storage inductance $L_{\mathrm{pfc}}$ is distinct from the source smoothing inductance $L_{\mathrm{in}}$. For continuous-conduction operation with approximately constant inductance and inductor voltage during each switching interval, a first-order ripple-based sizing criterion is:
$L_{\mathrm{pfc}} \geq \max _O\left\{\frac{\left|V_{\mathrm{L}, \mathrm{on}}\right| D_{\mathrm{pfc}}}{f_{\mathrm{sw}, \mathrm{pfc}} \Delta I_{\mathrm{L}, \mathrm{pp}}}\right\}$ (6)
Here, O is the set of operating points considered for sizing; $V_{\mathrm{L}, \mathrm{on}}$ is the voltage across the inductive element during the relevant on-state, excluding the separate series-resistance drop; $D_{\text {pfc}}$ is the fraction of the switching period occupied by that state; $f_{\text {sw,pfc}}$ is the actual switching frequency; and $\Delta I_{\mathrm{L}, \mathrm{pp}}$ is the allowable peak-to-peak inductor-current ripple. Eq. (6) assumes that the on-state current excursion determines this ripple and that mains voltage changes negligibly within a switching period. For fixed-frequency PWM, the on-state interval is Dpfc/fsw,pfc; for VF-HCC, it is obtained from the actual gate events. The 100 kHz update frequency is not substituted for the switching frequency.
The DC-link capacitor $C_{\mathrm{dc}}$ is sized for the dominant twice-line-frequency power pulsation:
$C_{\mathrm{dc}} \geq \frac{\bar{P}_{\mathrm{bus}}}{\omega_{\mathrm{g}} V_{\mathrm{dc}, \mathrm{nom}} \Delta V_{\mathrm{dc}, \mathrm{pp}}}$ (7)
Here, $\bar{P}_{\text {bus}}$ is mean DC-link demand, $\omega_{\mathrm{g}}=2 \pi f_{\mathrm{g}}$ with $f_{\mathrm{g}}=$ 50 Hz , and $\Delta V_{\mathrm{dc}, \mathrm{pp}}$ is peak-to-peak bus ripple. Eq. (7) assumes near-unity PF and small ripple with approximately constant bus demand; it is a sizing approximation, not a stability or energy-closure test.
3.2 Transformer ratio and selected parameters
For the 380 V bus and 150 V feeders, the secondary-to-primary ratio follows the nonideal full-bridge gain:
$n_{\mathrm{i}}=\frac{V_{\mathrm{o}, i}+\Delta V_{\mathrm{path}, i}}{M_{\mathrm{fb}, \mathrm{nom}} V_{\mathrm{dc}, \mathrm{nom}}}$ (8)
The isolated-stage model uses n = 0.436095 and Mfb = 0.91988; in Eq. (8), $V_{\mathrm{o}, i}$ denotes the 150 V rated feeder voltage and $M_{\mathrm{fb}, \mathrm{nom}}$ denotes the nominal physical modulation. These are simulation-model values rather than a final integer-turns design; core area, flux density, leakage, insulation, winding loss, and thermal margin remain prototype tasks. All five channels use matched 1 mH/68 µF output filters.
3.3 Baseline design and simulation parameters
Table 2 summarizes the nominal operating specifications and the effective parameters used in the validated simulations. These values correspond to the final runtime configurations of the physical switching PFC and isolated-stage models; detailed semiconductor, magnetic, insulation, and thermal design remains a prototype-level task.
Table 2. Baseline design and simulation parameters
|
Parameter |
Symbol |
Value |
|
Input-voltage range |
Vs,rms |
85-265 V |
|
Grid frequency |
fg |
50 Hz |
|
Rated output |
Po,r |
750 W |
|
Nominal DC-link voltage |
Vdc,nom |
380 V |
|
DC–link capacitance |
Cdc |
940 µF |
|
PFC VF-HCC control/update frequency |
fctrl,pfc |
100 kHz |
|
Number of outputs |
No |
5 |
|
Rated voltage per feeder |
Vo,i |
150 V |
|
Rated power per feeder |
Po,i |
150 W |
|
Full-bridge frequency |
fsw,fb |
40 kHz |
|
Applied modulation |
Mfb,nom |
0.91988 |
|
Transformer ratio |
n = Ns/Np |
0.436095 |
|
Primary minimum gate gap |
td |
0.5 µs |
|
Output inductance |
Lo |
1 mH |
|
Output capacitance |
Co |
68 µF |
|
Source inductance |
Lin |
PI/PWM: 0.25 mH; VF-HCC: 2 mH |
|
PFC current-loop sensing |
- |
PI/PWM: filtered inductor current; VF-HCC: rectified input current |
|
PFC VF-HCC reference shaping |
γ |
0.78 |
|
PFC feed-forward power setting |
Pff |
VF-HCC: 820/0.93 W bias; PI/PWM: estimated load power/0.93 |
|
PFC VF-HCC band |
Δi |
Max (0.05 A, 0.03 iref) |
|
PFC controller type |
- |
Wide-input: cascaded PI/PWM; integrated: VF-HCC |
|
PFC voltage-loop proportional gain |
Kp,v |
17.9548 W/V |
|
PFC voltage-loop integral gain |
Ki,v |
225.627 W/(V s) |
|
PFC controller sample time |
Ts,pfc |
10 µs |
|
PFC voltage/RMS filters |
τv, τrms |
10 ms/40 ms |
|
PFC enable delay in integrated model |
ten |
1 ms |
|
Full-bridge feedback |
- |
Mean (Vo1...Vo5) to 150 V |
|
Full-bridge controller gains |
Kp, Ki |
0.0065 V⁻¹, 42 (V s)⁻¹ |
|
Full-bridge controller sample/filter |
Ts, τ |
25 µs integral update; raw mean feedback (no separate low-pass filter) |
|
Bridge command / modulation |
u / Mfb |
Command 0.05–1.0; physical nominal about 0.9199 |
|
Simulation solver/time step |
- |
PFC matrix: FixedStepDiscrete, 1 µs; integrated/isolated SPS: 0.25 µs |
|
PFC energy-storage inductance |
$L_{\text {pfc }}$ |
0.612493 mH; series resistance 0.08 Ω |
|
PI/PWM current gains |
$K_{\mathrm{p}, i}, K_{i, i}$ |
40.02346 V/A; 5227.61018 V/(A s) |
|
PI/PWM current filter |
$\tau_i$ |
20 µs; fixed 100 kHz PWM |
|
Integrated bus initialization |
$V_\text{dc}(0)$ |
380 V; not a cold-start validation |
4.1 Evidence hierarchy and models
Complementary simulation models are used according to their evidence roles rather than as one all-purpose model: a switching-level no-PFC reference, a detailed switching-level PFC model for power-quality verification, a 230 Vrms integrated switching case, and a switching-level isolated five-output model supported by equivalent multi-output imbalance studies. The term switching-level is used throughout to avoid implying hardware experimental validation.
The switching-level PFC retains the power devices, inductor and capacitor dynamics, discrete controller, duty mapping, startup logic, and protection limits. The reported validation covers the 85-265 Vrms input range at 50 Hz. Operation at 60 Hz is reserved for extended validation, while the converter structure and control architecture remain unchanged.
The detailed switching-level isolated model contains the four-switch bridge, one transformer with five secondaries, five rectifiers, and five LC-filtered 150 Ω loads. Mean-output feedback is used. In the equivalent model, one feeder is swept to near-disconnected condition, and representative multiple-load and sequential-transition cases quantify coupling.
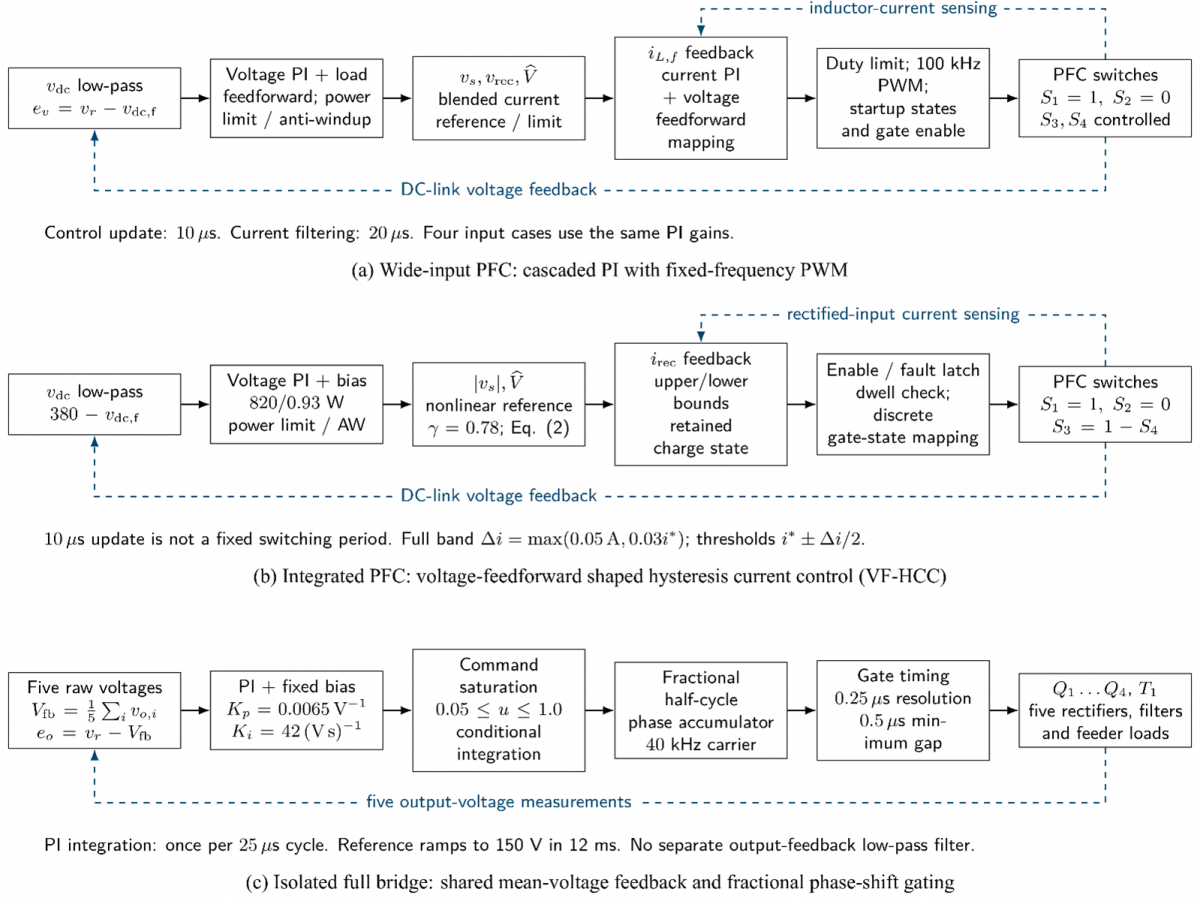
The PFC simulations at 85, 120, 230, and 265 Vrms use cascaded voltage and filtered inductor-current PI control with fixed 100 kHz PWM and voltage-feedforward duty mapping. Table 2 gives the gains and limits. Its reference blends rectified voltage with source magnitude: source weighting decreases from 0.75 at 120 V and below to zero at 180 V and above. Figure 3 separates these implemented control paths.
The bridge uses raw mean feedback $V_{\mathrm{fb}}=\frac{1}{5} \sum_{i=1}^5 V_{\mathrm{o}, i}$ and a 12 ms reference ramp. With voltage error $e_{\mathrm{o}}=V_{\mathrm{o}, \text { ref }}-V_{\mathrm{fb}}$, its command is $u=\operatorname{sat}_{[0.05,1]}\left(0.97036586+K_p e_{\mathrm{o}}+x_{\mathrm{o}}\right)$. The integral state $x_{\mathrm{o}}$ updates by $K_i e_{\mathrm{o}} T_{\mathrm{fb}}$ each cycle unless it aggravates saturation. Fractional phase-shift scheduling generates the gates. Unloading raises mean voltage, reducing common excitation and loaded-feeder voltages.
Figure 3. Implemented control framework
4.2 Numerical indices and evidence boundaries
The main controller settings used for the integrated case are included in Table 2 so that the result can be reproduced. The PFC stage uses VF-HCC with rectified-input-current sensing, a 100 kHz control/update timing base, 2 mH input smoothing, γ = 0.78 reference shaping, a fixed 820/0.93 W feedforward bias, not measured power or efficiency. The power command and current reference are limited to $\left[0, P_{\mathrm{cmd}, \max}\right]$ and $\left[0, I_{\text {ref}, \text {max}}\right]$, respectively. The isolated stage uses mean-output feedback, a minimum measured 0.5 µs gate gap, and the full-bridge controller settings listed in the same table. The PFC window is 0.9–1.2 s (15 line cycles), the no-PFC window 0.4–0.6 s (10 cycles), the initialized integrated window 0.10–0.12 s (one cycle), and the isolated-stage window 0.034975–0.044975 s (400 bridge cycles). THD is calculated from the RMS harmonic components of the input current up to the 40th harmonic using the same harmonic order for the PFC and no-PFC comparisons. For output-side imbalance, two indices are reported: voltage-regulation error relative to the 150 V reference and cross-regulation relative to the corresponding balanced-load voltage. The manuscript reports both metrics because the nominal 150 V regulation error and the balanced-case cross-regulation answer different aspects of output regulation.
$\begin{aligned} \mathrm{PF} & =\frac{\int_{\mathrm{t}_0}^{\mathrm{t}_0+\mathrm{T}_{\mathrm{m}}} v_{\mathrm{s}}(t) i_{\mathrm{s}}(\mathrm{t}) \mathrm{dt}}{T_{\mathrm{m}} V_{\mathrm{s}, \mathrm{rms}} I_{\mathrm{s}, \mathrm{rms}}} \\ \mathrm{THD}_{\mathrm{i}} & =\frac{\left.\sqrt{( } \Sigma_{\mathrm{h}=2}^{\mathrm{H}} I_{\mathrm{h}}^2\right)}{I_1} \times 100 \%\end{aligned}$ (9)
where, $v_{\mathrm{s}}$ and $i_{\mathrm{s}}$ are source voltage and current; Tm is the interval starting at t0; $V_{\mathrm{s}, \mathrm{rms}}$ and $I_{\mathrm{s}, \mathrm{rms}}$ are true RMS over that same interval. Ih is the RMS current of harmonic h and I1 its fundamental, with H = 40 for the reported PFC and no-PFC line-current harmonic comparisons. Cross-regulation of feeder k under a disturbance in feeder j is referenced to the balanced case:
$\begin{gathered}\bar{V_{\mathrm{o}, l}}=\frac{\int_{t_{\mathrm{o}}}^{\mathrm{t}_{\mathrm{o}}+\mathrm{T}_{\mathrm{o}}} v_{\mathrm{o}, i}(\mathrm{t}) \mathrm{dt}}{T_{\mathrm{o}}} \\ \varepsilon_{\mathrm{v}, i}=\frac{\bar{V_{\mathrm{o}, 1}}-V_{\mathrm{o}, \mathrm{ref}}}{V_{\mathrm{o}, \text {ref}}} \times 100 \% \\ \mathrm{CR}_{k \leftarrow j}=\frac{\bar{V_{\mathrm{o}, k}^{(\mathrm{j})}}-\bar{V_{\mathrm{o}, k}^{(\mathrm{bal)}}}}{\bar{V_{\mathrm{o}, k}^{(\mathrm{bal)}}}} \times 100 \%\end{gathered}$ (10)
In Eq. (10), $T_o$ is the output-analysis interval starting at $t_{\mathrm{o}}$, $V_{\mathrm{o}, \text {ref}}=150 \mathrm{~V}$, and (bal) denotes the balanced case. The superscript $(j)$ identifies a disturbance on feeder $j$, while $k$ identifies the observed feeder. Mean mismatch is $100\left(\max _i \bar{V}_{\mathrm{o}, i}-\min _i \bar{V}_{\mathrm{o}, i}\right) / \bar{V}_{\mathrm{o}, \text {all}}$, where $\bar{V}_{\mathrm{o}, \text {all}}$ is the fiveoutput mean. Ripple is peak-to-peak voltage divided by its corresponding mean.
The isolated-stage record contains an SPS switch-status convergence warning at 12.275 ms. Its effect is not ruled out merely because it precedes the analysis window; a numerical-convergence check remains required. Integrated line-to-output energy accounting also remains unresolved, so the short-window point is not used to claim efficiency or full-system dynamic validation. The present study does not claim hardware compliance or complete switching validation over every imbalance point; those cases are used to identify design limits and protection requirements.
4.3 Zonal operation and proposed voltage-priority protection
Zone demand may be represented by $R_i(t)=150 \Omega / \alpha_i(t)$, where $0<\alpha_i \leq 1$ is load relative to rating; actual power is $V_{\mathrm{o}, i}^2 / R_i$. Day/night and occupancy changes motivate staggered enabling and ramped aggregate demand. The equivalent sweeps and sequential transitions illustrate this coupling, but do not constitute a stochastic occupancy study.
A proposed supervisor monitors $V_{\max }=\max _i V_{\mathrm{o}, i}$ and $V_{\min }=\min _i V_{\mathrm{o}, i}$. Persistent $V_{\max }>V_{\lim }$ enters LIMIT, reducing the common bridge ceiling and PFC power demand with anti-windup tracking. Release requires voltage hysteresis and a dwell interval. Higher overvoltage or timeout enters TRIP, inhibits both stages and latches the fault; qualified reset permits staged restart. Thresholds and timings require downstream ratings, derating and sensing uncertainty.
A local clamp or discharge path must remove unloaded-capacitor energy; opening the load alone cannot do so. Common limiting may undervolt loaded feeders, so minimum voltage informs zone priority. Independent regulation requires local post-regulation. This supervisor is proposed, not implemented or validated.
5.1 Input-side power quality and DC-link regulation
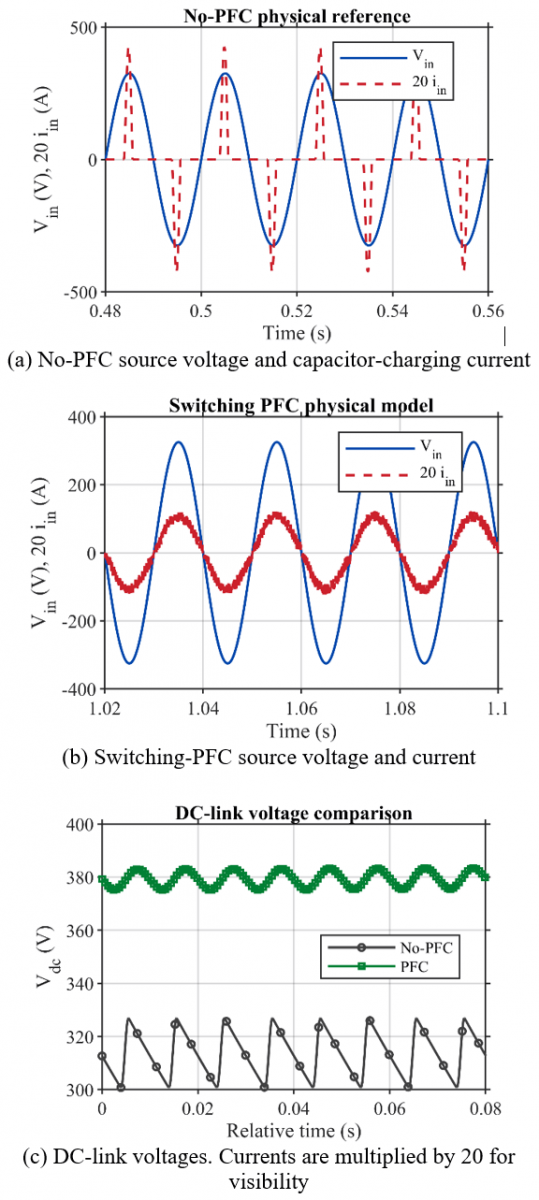
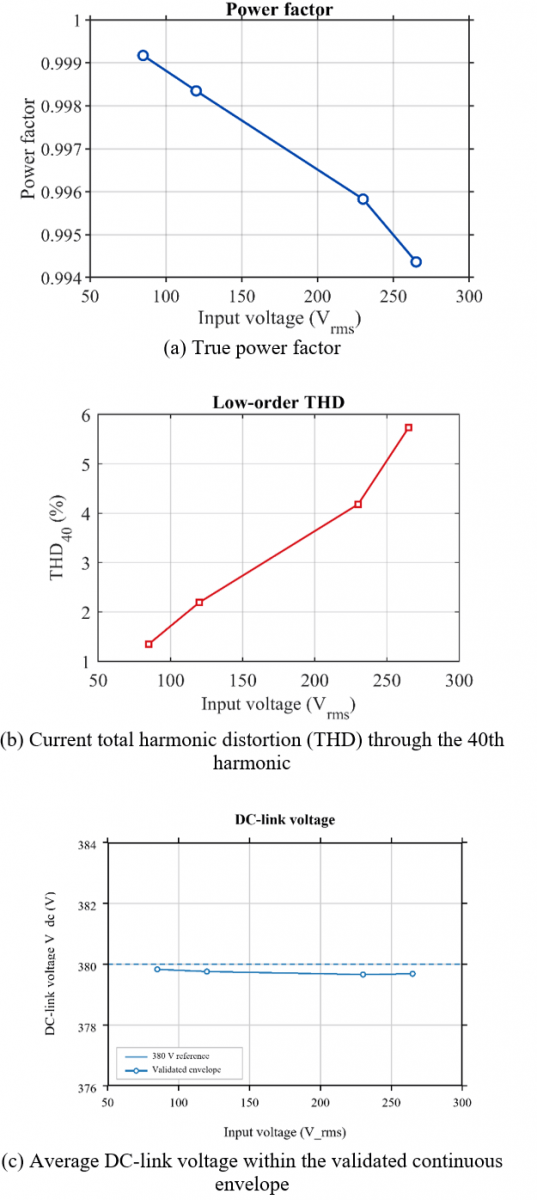
Figure 4 first compares the 230 Vrms no-PFC reference with the switching PFC case. The capacitor-input reference draws narrow charging pulses, with PF = 0.51923, THD40 = 164.09%, 21.25 A peak current, crest factor of 3.50, and an average unregulated bus of 313.59 V. Under the same input condition, the switching PFC produces a near-sinusoidal source current, PF = 0.99583, THD40 = 4.180%, a 6.23 A current peak, and a regulated DC link near 379.66 V. Because the delivered powers are not identical, this comparison is used only as a power-quality benchmark.
Figure 4. Physical comparison with and without PFC
Figure 5. Wide-input 50-Hz switching-PFC performance
Figure 5 then summarizes the wide-input 50-Hz PFC matrix. With one cascaded PI/PWM controller set and no retuning, the switching PFC gives PF = 0.99437-0.99917, THD40 = 1.347-5.734%, and average DC-link voltage of 379.658-379.829 V over 85-265 Vrms. The final integrated 230 Vrms switching case uses the distinct VF-HCC setting in Table 2 while supplying the isolated five-output stage; it gives PF = 0.99679, THD40 = 4.0815%, Vdc = 375.43 V, Vo,mean = 149.87 V, and 748.70 W.
Thus, the integrated case operates 1.20% below the nominal 380 V link while preserving the balanced feeder operating point.
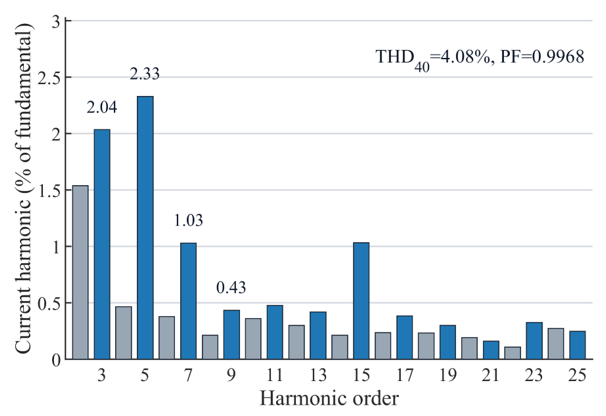
Figure 6 shows the line-current harmonic spectrum of the integrated VF-HCC case at 230 Vrms, using a 100 kHz control-update frequency. Harmonic magnitudes are normalized to the fundamental current. The spectrum supports the reported THD₄₀ = 4.0815% and PF = 0.99679; it does not represent a separate decomposition of harmonic sources.
Figure 6. Normalized line-current harmonic spectrum of the integrated VF-HCC case at 230 Vrms
5.2 Balanced operation and cross-regulation
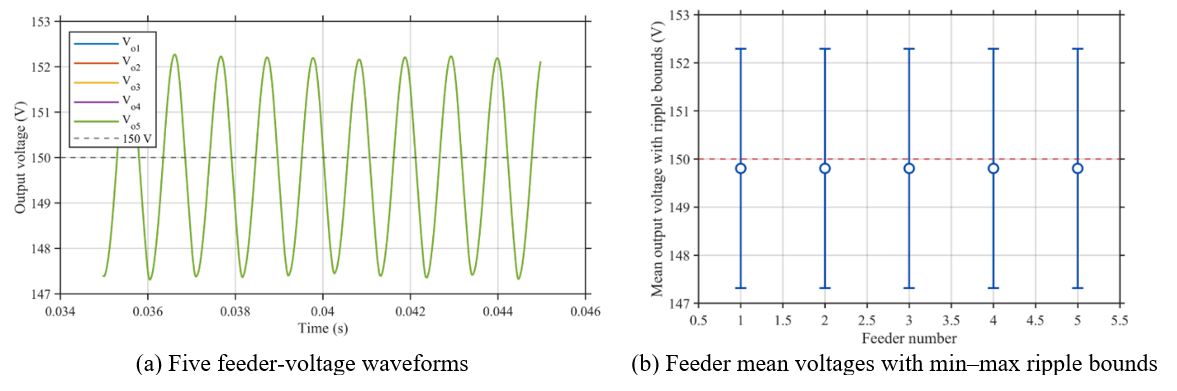
Figure 7 shows the balanced isolated-stage switching validation at the nominal 380 V DC-link input. Over a 400-switching-cycle steady-state window, the five feeder means converge to 149.805 V, the feeder-to-feeder mean mismatch is below 0.001%, and the total output power is 748.147 W. The maximum absolute mean-voltage regulation error is 0.130%, the maximum ripple is 4.978 Vpp (3.323%), and the applied modulation is 0.91988.
Figure 7. Balanced switching-level validation
This result is consistent with the nominal transformer ratio, winding polarity, rectifier/filter branches, and common feedback action for balanced loading.
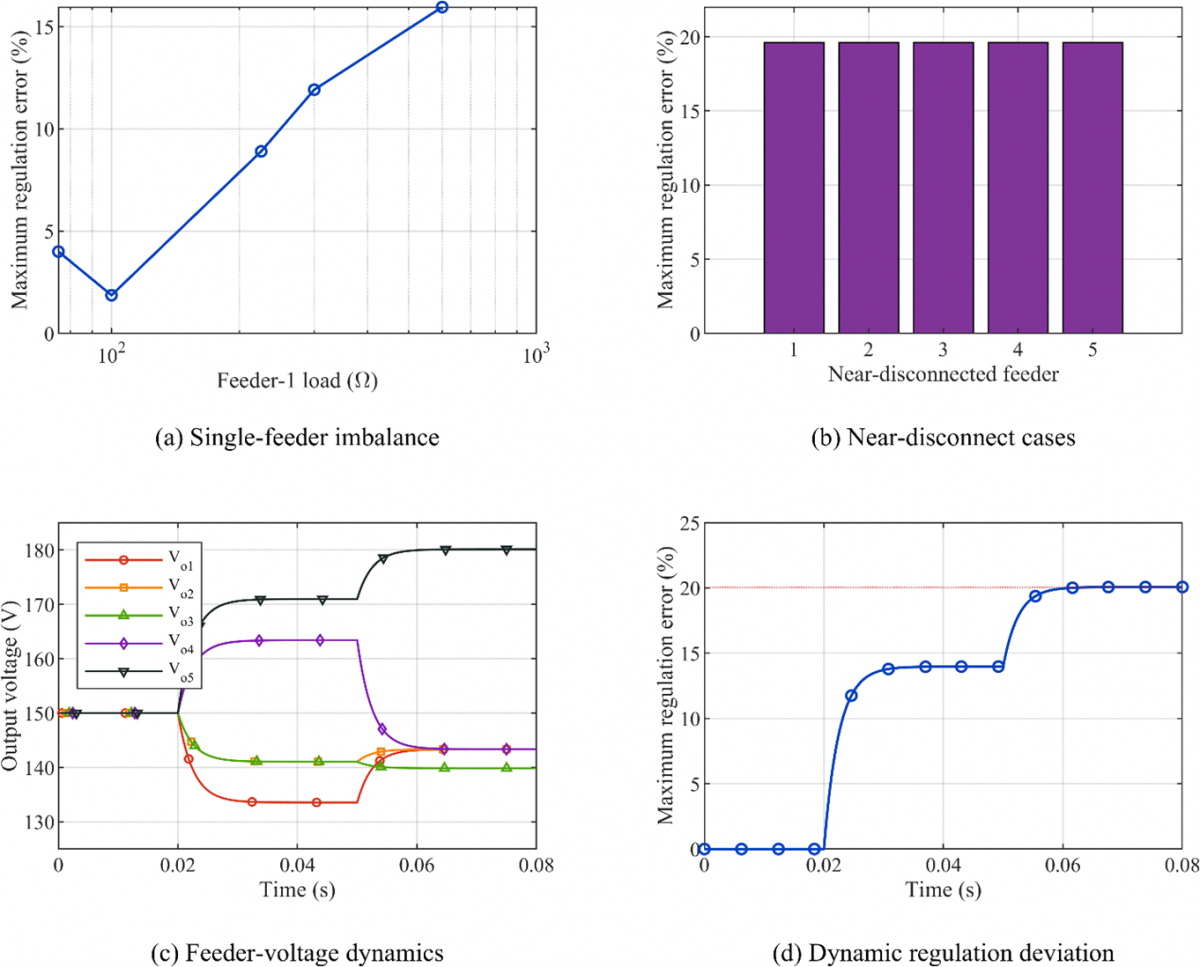
Figure 8 extends the output-side assessment with the equivalent multi-output model. In the static single-feeder sweep, the maximum regulation error reaches 15.95% before the near-disconnected limit, while representative multiple-load patterns reach 18.38%.
When any one feeder is represented by 100 kΩ, the disturbed output reaches 179.408 V (+19.61%) and the four rated-load outputs settle near 142.648 V (-4.90%). The nearly identical result obtained when each feeder is disturbed in turn indicates that the limit is structural, not tied to one secondary winding.
The voltage rise is reported in two ways: regulation error relative to the 150 V feeder reference, and cross-regulation relative to the balanced operating point. Keeping these definitions separate prevents a reference-voltage error from being interpreted as cross-regulation.
Figures 8(c) and (d) show that the same coupling also appears during load transitions. The first disturbance raises the maximum absolute regulation error to about 14%, and the following transition drives the deviation toward the 20.07% peak. The static cases identify the limiting states, whereas the dynamic case shows how the interaction evolves during feeder-load changes. These imbalance results remain equivalent-model evidence and are not presented as a full switching-level imbalance matrix.
5.3 Operating boundaries and contribution implications
The combined results identify three design boundaries. Low-line full-load operation sets the front-end current stress, high-line operation sets the smallest current-shaping margin and the highest evaluated THD, and near-disconnected feeder loading sets the maximum secondary-side voltage stress. Because these limits occur at different operating points, component, sensing, and protection ratings cannot be selected from the nominal balanced case alone.
Table 3. Condensed numerical performance and evidence roles
|
Model/Condition |
Input or Load |
PF |
THD40 (%) |
Vdc or Vo (V) |
Power/Regulation Metric |
|
No-PFC switching reference |
230 Vrms |
0.51923 |
164.09 |
313.59 avg |
705.34 W |
|
PI/PWM PFC |
85 Vrms |
0.99917 |
1.347 |
379.829 avg |
749.36 W |
|
PI/PWM PFC |
120 Vrms |
0.99835 |
2.192 |
379.753 avg |
749.06 W |
|
PI/PWM PFC |
230 Vrms |
0.99583 |
4.180 |
379.658 avg |
748.69 W |
|
PI/PWM PFC |
265 Vrms |
0.99437 |
5.734 |
379.685 avg |
748.80 W |
|
Switching-level isolated |
380 V; 5×150 Ω |
- |
- |
149.805 mean |
748.147 W; Mfb = 0.91988; 0.5 µs minimum |
|
Equivalent static |
1 feeder=100 kΩ |
- |
- |
179.408 max |
542.947 W; +19.61% reg., +19.76% CR |
|
Equivalent dynamic |
Sequential loads |
- |
- |
- |
20.07% peak regulation deviation |
|
Integrated switching PFC + isolated five-output stage |
230 Vrms; Lin = 2 mH; fctrl,pfc = 100 kHz |
0.99679 |
4.0815 |
375.43 Vdc; 149.87 Vo,mean |
748.70 W; balanced point; energy closure outstanding |
Figure 8. Equivalent-model output-voltage regulation and cross-coupling assessment
The evidence also maps directly to the stated contributions. Figures 4-6 and Table 3 establish the grid-side power-quality improvement, harmonic performance, and 85-265 Vrms/50 Hz DC-link regulation of the centralized PFC stage. Figure 7 reports the balanced five-output switching condition at the isolated stage, and Figure 8 quantifies the static and dynamic voltage-regulation limits introduced by the shared transformer and common primary command. This evidence supports the feeder-level architecture while keeping equivalent-model imbalance results within their stated scope. Hardware efficiency, thermal performance, EMI, integrated two-stage switching dynamics over the full input range, and full switching-level imbalance validation remain future work.
5.4 Future hardware implementation
A 750 W prototype should progress from current-limited stage checks to 230 Vrms integration, low/high-line tests and load transitions. Adjustable finite loads should precede LED regulators. Measurements should include true PF and harmonics, simultaneous input/output power with uncertainty, bus/feeder ripple, regulation and cross-regulation, device stresses, gate timing, transformer-current symmetry, temperature and conducted EMI. Efficiency requires thermal steady state.
The component-level schematic in Appendix (Figure A1) provides a circuit reference for future PCB development. PCB design must minimize commutation loops and separate gate/sensing returns. Magnetics require integer turns, saturation, insulation and thermal checks. Drivers and spacing must meet working-voltage requirements. Inrush control, fuses, OCP/OVP/UVLO, capacitor discharge and qualified restart are required. PFC gate non-overlap must be verified before hardware implementation; this verification remains a future task.
A centralized feeder-level architecture has been evaluated by coordinating a wide-input non-inverting buck-boost PFC front end with a shared isolated full-bridge stage and five secondary outputs. The contribution is architectural and methodological: each power-quality, bus-regulation, balanced-output, and cross-regulation claim is assigned to a model with an explicit evidence role.
The detailed PI/PWM switching-level PFC maintains PF = 0.99437-0.99917, THD40 = 1.347-5.734%, and Vdc = 379.658-379.829 V over the 85-265 Vrms/50 Hz matrix. The integrated 230 Vrms case with Lin = 2 mH and a 100 kHz VF-HCC timing base gives PF = 0.99679, THD40 = 4.0815%, Vdc = 375.43 V, Vo,mean = 149.87 V, and 748.70 W. At 380 V DC input, the isolated-stage switching run delivers 748.147 W with a 149.805 V mean feeder voltage, feeder-to-feeder mean mismatch below 0.001%, 3.323% maximum steady-state ripple, a minimum measured 0.5 µs gate gap and no complementary gate overlap in the saved traces, subject to the numerical-reliability limitation in Section 4.2. The equivalent model shows that severe imbalance, not the balanced case, sets the main feeder-side protection limit.
The architecture is credible for predictably loaded LED clusters and for feeder systems with local current regulation, but robust deployment requires channel-level over-voltage protection and preferably at least limited local post-regulation. Future work will extend the present 50-Hz validation to 60-Hz operation and will include numerical-convergence and integrated energy-balance checks, switching-level severe-imbalance verification, hardware efficiency and EMI measurements, transformer-parasitic assessment, dimming, fault-response, and secondary-protection studies.
The authors gratefully acknowledge the University of Mosul, Mosul, Iraq, for its institutional and academic support throughout this work. The authors also appreciate the supportive research environment and resources provided by the University, which contributed to the successful completion of this study.
|
Cdc |
DC-link capacitance, F |
|
Co |
output capacitance, F |
|
fctrl,pfc |
PFC control/update frequency, Hz |
|
fsw,pfc |
fixed PWM frequency; state-dependent for VF-HCC, Hz |
|
fsw,fb |
full-bridge switching frequency, Hz |
|
Pcmd |
voltage-loop power command, W |
|
I1 |
RMS fundamental current, A |
|
Ih |
RMS current of harmonic h, A |
|
Lin |
input/source smoothing inductance, H |
|
Lo |
output-filter inductance, H |
|
Mfb |
effective full-bridge modulation, dimensionless |
|
n = Ns/Np |
transformer turns ratio, dimensionless |
|
Po |
output power, W |
|
Vdc |
DC-link voltage, V |
|
Vdc,nom |
nominal DC-link voltage, V |
|
Vo,ref |
feeder-voltage reference, V |
|
vo,i(t) |
instantaneous voltage of feeder i, V |
|
Pff |
feedforward bias or load-power estimate, W |
|
Vrms |
filtered sinusoidal-mains estimate, V |
|
Lpfc |
PFC energy-storage inductance, H |
|
AC |
alternating current |
|
DC |
direct current |
|
EMI |
electromagnetic interference |
|
HF |
high frequency |
|
LED |
light-emitting diode |
|
PF |
power factor |
|
PFC |
power-factor correction |
|
PWM |
pulse-width modulation |
|
RMS |
root-mean-square |
|
THD |
total harmonic distortion |
|
Greek symbols |
|
|
γv |
high-line voltage ratio, dimensionless |
|
ΔVdc,pp |
DC-link peak-to-peak ripple, V |
|
εv,i |
feeder-voltage regulation error, % |
|
γ |
VF-HCC reference-shaping exponent, dimensionless |
|
ωg |
grid angular frequency, rad/s |
|
Δi |
Full VF-HCC current band, A |
|
Subscripts |
|
|
dc |
DC link |
|
in |
input |
|
ref |
reference |
|
fb |
full bridge |
|
o |
output |
|
rms |
root-mean-square |
|
i, j |
feeder indices |
|
pfc |
PFC stage |
|
sw |
switching |
Figure A1 details the power-stage arrangement, including the input rectifier, four-switch non-inverting buck–boost stage, DC-link capacitor, primary full bridge, and five secondary rectifier and filter circuits. The PFC switches are drawn as MOSFETs with body diodes to illustrate a possible device implementation; the numerical model represents these devices using ideal-switch and diode blocks. Each feeder includes an output-filter inductor, a capacitor with series resistance, a shunt resistor, and a variable resistive load. Measurement blocks, device snubbers, and numerical reference resistors are omitted for clarity. The schematic supports interpretation of the simulation topology and future hardware development, but does not constitute a completed PCB design.
Figure A1. Component-level schematic of the centralized two-stage LED feeder supply
[1] Ramljak, I., Tokić, A. (2020). Harmonic emission LED lighting. AIMS Energy, 8(1): 1-26. https://doi.org/10.3934/energy.2020.1.1
[2] Uddin, S., Shareef, H., Mohamed, A., Hannan, M.A. (2012). An analysis of harmonics from LED lamps. In 2012 Asia-Pacific Symposium on Electromagnetic Compatibility (APEMC), Singapore, pp. 837-840. https://doi.org/10.1109/APEMC.2012.6238014
[3] Wantuch, A., Olesiak, M. (2023). Effect of LED lighting on selected quality parameters of electricity. Sensors, 23(3): 1582. https://doi.org/10.3390/s23031582
[4] International Electrotechnical Commission. (2024). IEC 61000-3-2:2018/AMD2:2024 - Electromagnetic compatibility (EMC)—Part 3-2: Limits—Limits for harmonic current emissions (equipment input current <= 16 A per phase).
[5] Assi, N.A., Hamdon, W.H., Ameen, Y.M.Y. (2025). Analyzing the impact of rectifier-based LED lighting fixtures on the electrical power distribution system. NTU Journal of Engineering and Technology, 4(2): 31-38. https://doi.org/10.56286/sj0th094
[6] Cheng, C.A., Cheng, H.L., Chang, E.C., Chang, M.T. (2025). An isolated AC-DC LED electronic lighting driver circuit with power factor correction. Electronics, 14(19): 3953. https://doi.org/10.3390/electronics14193953
[7] Faizan, M., Bi, J., Liu, M., Wang, L., Stempitsky, V., Yousaf, M.Z. (2023). Long life power factor corrected LED driver with capacitive energy mechanism for street light applications. Sustainability, 15(5): 3991. https://doi.org/10.3390/su15053991
[8] Kumar, K.A., Narasimharaju, B.L. (2024). Performance analysis of a bridgeless power factor correction (PFC) buck-boost LED driver with ripple diversion scheme for extended lifespan. International Journal of Circuit Theory and Applications, 52(8): 3870-3888. https://doi.org/10.1002/cta.3945
[9] Gritti, G., Adragna, C. (2019). Analysis, design and performance evaluation of an LED driver with unity power factor and constant-current primary sensing regulation. AIMS Energy, 7(5): 579-599. https://doi.org/10.3934/energy.2019.5.579
[10] Boeke, U., Wendt, M. (2015). DC power grids for buildings. In IEEE First International Conference on DC Microgrids (ICDCM), Atlanta, GA, USA, pp. 210-214. https://doi.org/10.1109/ICDCM.2015.7152040
[11] Zhang, R., Huang, X., Zhou, B., Yang, Y. (2017). Technology and application of centralized DC power supply for LED street lamp. In 6th International Conference on Energy, Environment and Sustainable Development (ICEESD 2017), Zhuhai, China, 129: 930-934. https://doi.org/10.2991/iceesd-17.2017.194
[12] Ameen, Y.M.Y., Al-Yozbaky, O.Sh., Al-Hafidh, M.S.M. (2021). Energy efficiency enhancement for residential sector: Case study of lighting in Iraq. Al-Rafidain Engineering Journal (AREJ), 26(1): 53-62. https://doi.org/10.33899/rengj.2020.127999.1056
[13] Kurylo, K., Sabat, W., Klepacki, D., Kamuda, K., Jankowski-Mihulowicz, P. (2024). Determinants of the generation of higher current harmonics in different operating states of the RGB LED lamp. Electronics, 13(3): 531. https://doi.org/10.3390/electronics13030531
[14] Wang, Y., Alonso, J.M., Ruan, X. (2017). A review of LED drivers and related technologies. IEEE Transactions on Industrial Electronics, 64(7): 5754-5765. https://doi.org/10.1109/TIE.2017.2677335
[15] Gacio, D., Alonso, J.M., Calleja, A.J., Garcia, J., Rico-Secades, M. (2011). A universal-input single-stage high-power-factor power supply for HB-LEDs based on integrated buck-flyback converter. IEEE Transactions on Industrial Electronics, 58(2): 589-599. https://doi.org/10.1109/TIE.2010.2046578
[16] Hui, S.Y.R., Li, S.N., Tao, X.H., Chen, W., Ng, W.M. (2010). A novel passive offline LED driver with long lifetime. IEEE Transactions on Power Electronics, 25(10): 2665-2672. https://doi.org/10.1109/TPEL.2010.2048436
[17] Arias, M., Lamar, D.G., Sebastian, J., Balocco, D., Diallo, A.A. (2013). High-efficiency LED driver without electrolytic capacitor for street lighting. IEEE Transactions on Industry Applications, 49(1): 127-137. https://doi.org/10.1109/TIA.2012.2227644
[18] Dragicevic, T., Lu, X., Vasquez, J.C., Guerrero, J.M. (2016). DC microgrids—Part I: A review of control strategies and stabilization techniques. IEEE Transactions on Power Electronics, 31(7): 4876-4891. https://doi.org/10.1109/TPEL.2015.2478859
[19] Dragicevic, T., Lu, X., Vasquez, J.C., Guerrero, J.M. (2016). DC microgrids—Part II: A review of power architectures, applications, and standardization issues. IEEE Transactions on Power Electronics, 31(5): 3528-3549. https://doi.org/10.1109/TPEL.2015.2464277
[20] Burmester, D., Rayudu, R., Seah, W., Akinyele, D. (2017). A review of nanogrid topologies and technologies. Renewable and Sustainable Energy Reviews, 67: 760-775. https://doi.org/10.1016/j.rser.2016.09.073
[21] Becker, D.J., Sonnenberg, B. (2011). DC microgrids in buildings and data centers. In IEEE International Telecommunications Energy Conference (INTELEC), Amsterdam, Netherlands, pp. 1-7. https://doi.org/10.1109/INTLEC.2011.6099725
[22] Institute of Electrical and Electronics Engineers. (2022). IEEE standard for harmonic control in electric power systems. IEEE Std 519-2022. https://doi.org/10.1109/IEEESTD.2022.9848440
[23] Institute of Electrical and Electronics Engineers. (2015). IEEE recommended practices for modulating current in high-brightness LEDs for mitigating health risks to viewers. IEEE Std 1789-2015. https://doi.org/10.1109/IEEESTD.2015.7118618
[24] International Electrotechnical Commission. (2020). DC or AC supplied electronic controlgear for LED modules—Performance requirements. IEC 62384:2020.
[25] Erickson, R.W., Maksimovic, D. (2020). Fundamentals of Power Electronics, 3rd ed. Springer, Cham, Switzerland.
[26] Kazimierczuk, M.K. (2015). Pulse-Width Modulated DC-DC Power Converters, 2nd ed. Wiley, Hoboken, NJ, USA. https://doi.org/10.1002/9781119009597
[27] Mohan, N., Undeland, T.M., Robbins, W.P. (2003). Power electronics: Converters, applications, and design, 3rd ed. Wiley, Hoboken, NJ, USA.
[28] Huber, L., Jang, Y., Jovanovic, M.M. (2008). Performance evaluation of bridgeless PFC boost rectifiers. IEEE Transactions on Power Electronics, 23(3): 1381-1390. https://doi.org/10.1109/TPEL.2008.921107
[29] Celidonio, M., Fionda, E., Pulcini, L., Sergio, E., Di Zenobio, D. (2014). A centralised DC power supply solution for LED lighting networks. In 2014 IEEE International Energy Conference (ENERGYCON), Cavtat, Croatia, pp. 1137-1143. https://doi.org/10.1109/ENERGYCON.2014.6850566
[30] Vossos, V., Gerber, D.L., Gaillet-Tournier, M., et al. (2022). Adoption pathways for DC power distribution in buildings. Energies, 15(3): 786. https://doi.org/10.3390/en15030786
[31] Litran, S.P., Duran, E., Semiao, J., Diaz-Martin, C. (2022). Multiple-output DC-DC converters: Applications and solutions. Electronics, 11(8): 1258. https://doi.org/10.3390/electronics11081258
[32] Park, S.G., Lee, B.K., Kim, J.S. (2020). Optimal design of multi-output LLC resonant converter with independently regulated synchronous single-switched power regulator. Energies, 13(17): 4341. https://doi.org/10.3390/en13174341
[33] Dindar, S., Hardalac, F., Aksoy, E., Ayturan, K. (2025). Investigation of multi-output single-switch forward converter in terms of cross-regulation using weighted control method. Applied Sciences, 15(1): 365. https://doi.org/10.3390/app15010365