Muhammad Fathir Qinthara | Muhammad Azhar Ismail | Fiky Yosef Suratman | Istiqomah* | Khilda Affifah | Simon Siregar
© 2026 The authors. This article is published by IIETA and is licensed under the CC BY 4.0 license (http://creativecommons.org/licenses/by/4.0/).
OPEN ACCESS
Water quality monitoring at different depths requires a submersible vehicle capable of reaching predefined depth layers and maintaining stable vertical positioning during measurements. This study focuses on the design and experimental evaluation of a thruster-based depth-control system for a submersible vehicle using three vertically oriented thrusters and a proportional-integral-derivative (PID) controller. An MS5837-30BA pressure sensor was used to provide depth feedback, while the controller regulated the vertical thrust through pulse width modulation (PWM) commands to the thrusters. The experimental stages included mechanical and electronic integration, watertight operation testing, pressure-sensor calibration, PID parameter tuning, depth-variation testing, and a full-mission depth-control experiment. The vehicle was evaluated at depth setpoints of 1 m, 2 m, 3 m, and 3.5 m, while watertight operation was additionally tested at depths of up to 4 m. Pressure-sensor calibration using linear regression reduced the average measurement error from 7.29% to 2.22%, with a coefficient of determination (R²) of 0.9991. The selected PID parameters were Kp = 500, Ki = 15, and Kd = 5. During the individual depth-setpoint experiments, the system achieved steady-state errors (SSE) of 0.50 cm, 0.27 cm, 4.25 cm, and 4.51 cm at 1 m, 2 m, 3 m, and 3.5 m, respectively. In the full-mission experiment, the SSE ranged from 0.26 cm to 1.21 cm, with an average settling time of 10.73 s. All measured errors remained below the predefined ±20 cm tolerance. The results demonstrate the feasibility of the proposed three-thruster architecture for depth regulation within the tested pool conditions and operating range.
submersible, thruster, proportional-integral-derivative control system, watertight, depth control
Water quality monitoring in reservoirs is essential for sustainable water resource management because reservoirs support domestic consumption, irrigation, fisheries, and hydroelectric power generation [1]. Water quality conditions are often non-uniform across different depths due to vertical stratification, which affects parameters such as temperature, pH, dissolved oxygen, and pollutant concentrations [2]. Studies conducted in Saguling Reservoir reported lead (Pb) concentrations exceeding water quality standards at several depth levels, highlighting the importance of monitoring water quality at multiple depths [3]. Furthermore, previous studies have shown that thermal and physicochemical stratification can occur not only in deep waters but also in shallow water bodies with depths of only 1–2 m, resulting in significant variations in water quality characteristics between surface and bottom layers [4]. Vertical profiling measurements have demonstrated that changes in water quality parameters can be observed within depth intervals as small as 10–20 cm, indicating the need for accurate depth-specific measurements to obtain representative water quality data [5].
Conventional water quality monitoring methods generally rely on manual sampling techniques such as spot sampling and Patterson grab samplers, although transporting collected samples to laboratories may alter their physical and chemical characteristics due to temperature changes, contamination, and transit time, thereby reducing measurement accuracy [6]. Other approaches, such as submersible pumps, are primarily designed for sample collection and still require integration with automated sensing systems to enable continuous monitoring [7]. These limitations indicate the need for more efficient and automated water quality monitoring technologies capable of performing in-situ measurements at various depths.
Recent developments have shifted water quality monitoring toward underwater vehicle-based systems. Autonomous underwater vehicles (AUVs) can perform underwater missions without direct human intervention and are widely used in scientific, military, and commercial applications [8]. They are generally classified as thruster-based vehicles using propellers for propulsion and depth control or buoyancy-based vehicles regulating motion through buoyancy variation [9]. Equipped with environmental sensors to enable more efficient and flexible monitoring at multiple depths than conventional sampling methods.
Previous studies have developed buoyancy-engine-based submersible platforms for operation at varying depths. In such systems, depth regulation is achieved by changing the vehicle's buoyancy through a fluid-transfer or variable-volume mechanism. However, the previously developed platform required an additional ballast mass of 3.7 kg to achieve neutral buoyancy, while its layered pipe structure was susceptible to leakage during operation. Furthermore, sensor data could not be monitored in real time and had to be retrieved after the vehicle surfaced, limiting its effectiveness for continuous monitoring applications. These limitations indicate the need for an alternative submersible configuration that can regulate depth through direct propulsion while maintaining a compact and watertight structure. In contrast to the buoyancy-based approach, the proposed vehicle directly generates vertical thrust using electrically driven thrusters rather than relying on buoyancy adjustment.
In this study, three vertical thrusters are employed to control the vehicle's heave motion while maintaining a compact and mechanically simple propulsion system. Two vertical thrusters can generate sufficient net vertical force but provide a less symmetrical force distribution around the vehicle center, whereas four or more thrusters offer additional actuation capability and redundancy at the expense of increased actuator count, power requirements, mechanical complexity, hydrodynamic drag, and space requirements. Therefore, three thrusters positioned symmetrically at 120° intervals were selected as a practical compromise between thrust distribution, stabilization, and system simplicity [10, 11]. This configuration supports accurate and repeatable heave control required to reach and maintain predefined measurement depths for multi-depth monitoring, rather than full multi-axis or six-degree-of-freedom maneuverability.
To address these challenges, this study develops and experimentally evaluates a thruster-based submersible vehicle for automatic depth control within the tested depth range of 1–3.5 m, while its watertight operation is additionally evaluated up to 4 m. The vehicle employs a watertight mechanical structure and three vertically oriented thrusters arranged at 120° intervals to control the heave motion and maintain the desired depth [12]. The thrusters are regulated by electronic speed controllers (ESCs) using pulse width modulation (PWM) signals from a microcontroller [13]. A pressure sensor provides depth feedback for a proportional-integral-derivative (PID) controller that regulates vertical thrust based on the difference between the measured depth and the desired setpoints to assess steady-state error (SSE) and settling time.
To maintain depth stability, a PID controller is implemented as the primary control method. PID control combines proportional, integral, and derivative actions to minimize the error between the measured depth and the desired setpoint [14]. The proportional term responds to current error, the integral term eliminates SSE, and the derivative term reduces overshoot by considering error variation [14]. Compared with more advanced control approaches such as fuzzy PID and linear quadratic regulator, PID offers simpler implementation, easier tuning, and lower computational requirements while maintaining satisfactory steady-state performance [15-17]. Depth feedback is provided by the MS5837-30BA pressure sensor, which supports measurements up to 30 bar with a resolution of 0.02 mbar and communicates through the I²C interface [18]. Depth estimation is obtained from hydrostatic pressure measurements, which are directly related to water depth according to the hydrostatic pressure principle [18]. Since hydrostatic pressure directly affects underwater vehicle operation and structural integrity, accurate depth sensing is essential [19].
The technical contribution of this work is the implementation and experimental evaluation of a compact three-thruster depth-control architecture that directly actuates vertical motion, in contrast to the buoyancy-based depth-regulation approach used in previous work. The system is evaluated through pressure-sensor calibration, PID parameter tuning, multi-depth experiments, and a full-mission test. Performance is assessed using SSE and settling time to evaluate the capability of the system to maintain stable vertical positioning at different depths. The developed depth-control subsystem is intended to provide a foundation for future autonomous multi-depth reservoir monitoring applications.
2.1 System design
The proposed system is designed as a thruster-based submersible platform with an automatic depth-control subsystem consisting of a pressure sensor for depth measurement, a Teensy 4.1 microcontroller for control computation, and three vertically oriented thrusters for generating heave motion. The study focuses on the ability of the depth-control subsystem to reach and maintain predefined depth setpoints. Depth-control experiments were conducted within a range of 1–3.5 m, while watertight operation was additionally evaluated at depths of up to 4 m. A positioning accuracy of ±20 cm relative to the desired depth setpoint was defined as performance tolerance. Stable depth positioning is considered essential for repeatable measurements at predefined depth layers; however, water-quality measurement performance itself is outside the scope of this study.
To support underwater operation, the mechanical and electronic components are enclosed within a watertight structure designed to prevent water ingress and withstand hydrostatic pressure variations. The three vertical thrusters generate heave motion, while depth information obtained from the pressure sensor is processed by the PID controller to regulate thruster output and maintain the desired depth automatically.
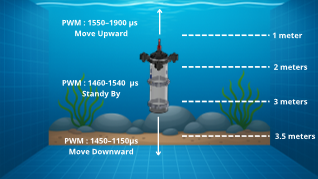
Figure 1. Illustration of the submersible system at various depths
Figure 1 illustrates the operating principle of the proposed submersible depth-control system. The vehicle utilizes three vertically oriented thrusters configured to generate heave motion along the z-axis. Vertical movement is controlled by adjusting the PWM signals supplied to the thrusters through the ESCs. When the PWM value is within the range of 1100–1450 μs, the thrusters generate downward thrust, causing the submersible to descend to a greater depth. Conversely, PWM values between 1550 and 1900 μs produce upward thrust, allowing the vehicle to ascend toward the water surface. A PWM value near the neutral point of 1500 μs produces minimal net thrust, enabling the submersible to maintain its position at a desired depth. This bidirectional thrust mechanism forms the basis of the depth-control system and allows the vehicle to perform precise vertical positioning during water quality monitoring operations.
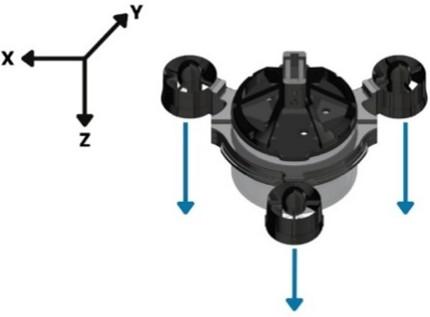
The positive z-axis is defined in the downward direction; therefore, increasing depth corresponds to a larger positive z-position. For example, when the submersible moves from the water surface to a depth of 3 m, its position along the z-axis becomes +3 m. As illustrated in Figure 2, this study focuses exclusively on controlling vertical motion (depth control) along the z-axis. Vehicle orientation control, including roll, pitch, and yaw motions, is beyond the scope of this work because the primary objective is to validate the fundamental capability of the submersible to reach and maintain a desired depth stably.
Depth feedback is provided by a pressure sensor that measures hydrostatic pressure and converts it into depth information. The measured depth is then processed by the onboard microcontroller, which executes the PID control algorithm to regulate thruster output and maintain the vehicle at the specified depth setpoint.
Figure 2. Submersible coordinate system
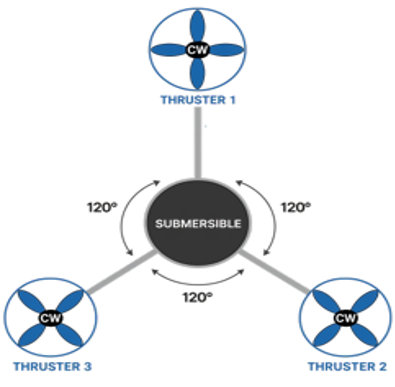
Figure 3. Three-thruster configuration of the proposed submersible vehicle
The configuration of thruster placement significantly affects the motion characteristics and stability of the submersible vehicle. In this study, a tricopter configuration consisting of three vertical thrusters positioned 120° apart around the vehicle’s center of mass was adopted, as illustrated in Figure 3. This arrangement was selected because it enables a symmetrical distribution of thrust forces relative to the vehicle center, resulting in improved vertical stability during depth-control operations. According to the tricopter concept, placing three thrusters at equal angular intervals ensures balanced force and moment distribution because each thruster has the same distance and orientation relative to the center of mass. The total thrust generated by the propulsion system can be expressed as
$F_{{total }}=F_{T 1}+F_{T 2}+F_{T 3}$ (1)
where, $F_{T 1}, F_{T 2}$, and $F_{T 3}$ represent the thrust produced by Thruster 1, Thruster 2, and Thruster 3, respectively.
When all three thrusters generate equal thrust, the vehicle moves vertically in a stable manner without significant tilting. Conversely, unequal thrust distribution produces moments that may alter the vehicle orientation. Therefore, precise PWM regulation is required to maintain balanced thrust generation among the thrusters. In the proposed system, PWM signals are generated by the PID controller based on the error between the measured depth and the desired setpoint. The controller continuously adjusts the thrust output of each thruster to maintain stable vertical motion and accurate depth positioning.
The selection of three vertical thrusters was based on the specific objective of controlling the vehicle’s heave motion while maintaining a compact, mechanically simple, and balanced propulsion configuration. Although two vertical thrusters are sufficient to generate heave force, their arrangement yields a less symmetrical force distribution around the vehicle's center, which can introduce an uneven load distribution and reduce stabilization capability. On the other hand, using four or more vertical thrusters can provide additional actuation redundancy and control authority. Still, it also increases the actuator count, power consumption, mechanical complexity, hydrodynamic drag, and space requirements within the submersible platform. Therefore, three vertical thrusters positioned symmetrically at 120° intervals were selected as a practical compromise between force distribution, stabilization, system complexity, and energy consumption. This configuration provides balanced vertical thrust around the vehicle center while using fewer actuators than conventional four-thruster configurations. Consequently, the three-thruster arrangement is considered sufficient for the present depth-control objective, which focuses specifically on heave motion rather than full six-degree-of-freedom control [12, 13].
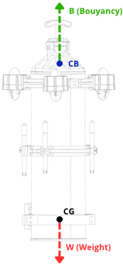
The dynamic and stability characteristics of the proposed 120° three-thruster arrangement were examined using a simplified force model, as illustrated in Figure 4. The three vertical thrusters are symmetrically positioned at 120° intervals around the vehicle center. The resultant vertical force is expressed as:
$F z=\mathrm{T}_1+\mathrm{T}_2+\mathrm{T}_3+B-W$ (2)
where, T₁, T₂, and T₃ are the thrust forces, is the buoyancy force, and is the vehicle weight. A positive produces upward motion, while a negative produces downward motion. When the resultant force approaches zero, the vehicle maintains its vertical position.
Under nominal conditions, this results in a balanced vertical thrust distribution with minimized roll and pitch moments. However, thrust imbalance between the thrusters can generate additional moments and cause small attitude deviations. The 120° symmetrical arrangement distributes the actuators around the vehicle center, reducing the effect of individual thrust differences on the overall vehicle attitude.
Figure 4. Simplified force and stability analysis of the 120° three-thruster configuration
The CG and CB positions were also considered for static stability. As shown in Figure 4, the CB is positioned above the CG, providing a restoring tendency against small roll or pitch disturbances. Changes in the internal distribution of the battery, ballast, and electronics may shift the CG and modify the vehicle attitude; therefore, the major components were arranged to keep the CG near the central region of the vehicle.
Hydrodynamic effects, including drag and disturbances generated by thruster-induced water flow, may also affect the vehicle response during vertical motion. These effects were considered qualitatively in the present design, but their hydrodynamic coefficients were not experimentally identified. Therefore, the analysis focuses on the simplified force and stability characteristics, while the resulting depth-control performance is evaluated experimentally under the controlled pool conditions described in the following sections.
2.2 Block diagram of the system
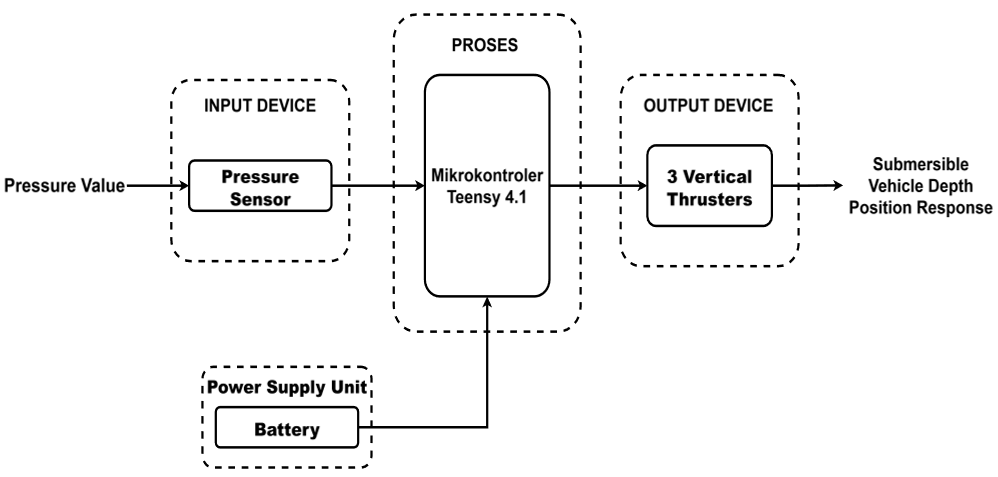
Figure 5 presents the block diagram of the submersible system, which consists of three main sections: input, processing, and output. The input block acquires depth information from the pressure sensor by measuring hydrostatic pressure and converting it into depth data. The processing block is implemented using a Teensy 4.1 microcontroller, which receives sensor data and executes the control algorithm to determine the corrective action required to maintain the desired depth setpoint.
Figure 5. Block diagram of the proposed submersible depth-control system
The control signal generated by the microcontroller is transmitted to the output block in the form of PWM signals that drive the thrusters. The thrusters convert these signals into upward or downward thrust, enabling the vehicle to ascend, descend, or maintain its position at a specified depth. All system components, including the sensor, microcontroller, and thrusters, are powered by an onboard battery during underwater operation.
Table 1. Functions of the main components
|
No. |
Component |
Function |
|
1 |
Pressure Senso |
Measures hydrostatic pressure and converts it into depth information |
|
2 |
Microcontroller |
Processes sensor data and executes the depth control algorithm to generate PWM commands |
|
3 |
Thrusters |
Actuators that generate vertical thrust to maintain the desired depth setpoint |
As shown in Table 1, the pressure sensor provides depth feedback for the control system, while the microcontroller processes the sensor data and generates control commands. The thrusters act as the final control elements, producing vertical thrust to regulate the vehicle's depth according to the desired setpoint. Together, these components form a closed-loop depth control system for the submersible vehicle.
2.3 Hadware design
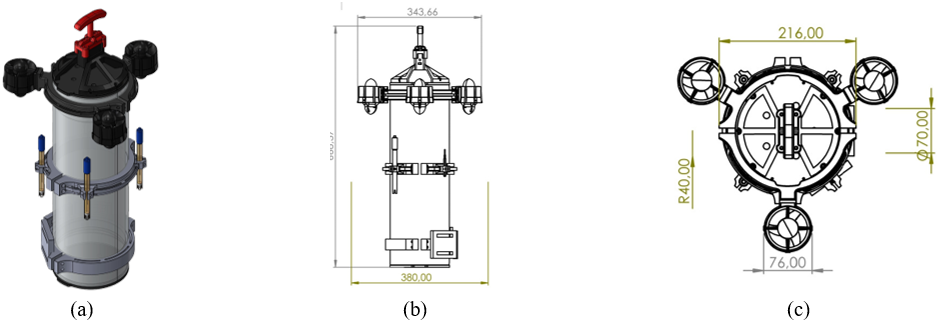
The submersible vehicle is constructed around a 6-inch watertight acrylic tube that serves as the main enclosure for the battery and electronic components. Three vertical thrusters are mounted around the upper section of the tube using dedicated brackets to provide balanced thrust distribution during vertical motion. Additional external brackets are incorporated to accommodate water quality sensors, including pH, conductivity, and dissolved oxygen sensors, allowing measurements to be performed while the vehicle remains fully submerged. The overall mechanical design of the proposed submersible vehicle is shown in Figure 6, consisting of a 3D conceptual model, a side-view sketch, and a top-view sketch.
Figure 6. External design of the proposed submersible vehicle: (a) 3D conceptual design, (b) side-view sketch, and (c) top-view sketch
An emergency kill switch is installed on the upper section of the vehicle to provide power control and an additional safety mechanism during operation. The overall vehicle length is approximately 66.8 cm, with the battery positioned at the lower section to maintain a low center of gravity and improve stability. Figure 6 illustrates the external mechanical design and the arrangement of the major components mounted on the vehicle.
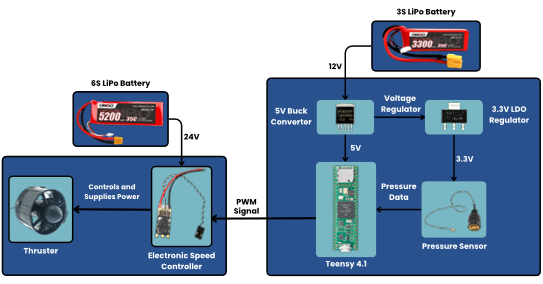
The electrical interconnection of the depth control subsystem is presented in Figure 7. The wiring diagram shows the integration between the pressure sensor, Teensy 4.1 microcontroller, ESCs, thrusters, and power supply, which together form the closed-loop depth control system.
Figure 7. Wiring diagram of the submersible
The main components used in the submersible vehicle system are selected based on technical specifications from respective datasheets to ensure they have adequate capability and can work optimally according to the needs of the submersible vehicle. The specifications of each selected component are presented in Table 2.
Table 2. Functions of the main components
|
Parameter |
Component |
Range |
Accuracy |
Interface |
|
Pressure/Depth |
MS5837-30BA |
0–30 bar (0–3000 kPa) |
±0.5% of full-scale |
I2C Digital |
|
Microcontroller |
Teensy 4.1 (ARM Cortex-M7) |
Clock up to 600 MHz |
- |
PWM, UART, I2C, SPI |
|
Thruster Actuator |
M060 BLDC Waterproof |
±6500 RPM/s±3–3.5 kgf |
- |
PWM (1100–1900 μs) |
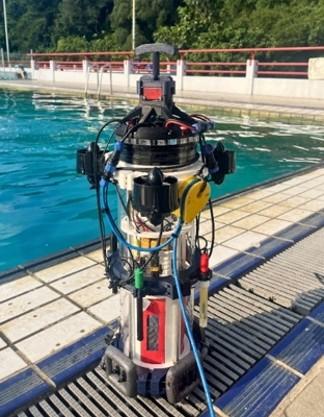
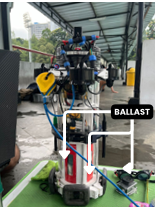
Following the mechanical and electrical integration processes, a complete submersible prototype was successfully assembled. The final implementation of the developed vehicle is shown in Figure 8.
Figure 8. Final submersible vehicle prototype
2.4 Proportional-integral-derivative control system
The control system applied in this research is a PID control, which is the most fundamental and widely used control system. PID control is a linear control system designed to regulate system behavior to conform to a desired setpoint by combining three distinct components: proportional, integral, and derivative control [14]. The mathematical model for the PID control system is expressed as a function of time as follows:
$u(t)=K_p e(t)+K_i \int e(t) d t+K_d \frac{d}{d t} e(t)$ (3)
where, u(t) is the control signal, e(t) is the control error, Kp is the proportional gain that determines the magnitude of response to current error, Ki is the integral gain that corrects cumulative error over time, and Kd is the derivative gain that responds to error changes over time to accelerate oscillation damping [14].
The proportional component generates corrective action directly proportional to the error, which is the difference between the setpoint and the actual value, thereby providing direct response to deviation. The integral component handles the accumulation of past errors, ensuring the system reaches and maintains the setpoint by compensating for SSE. The derivative component predicts future errors by analyzing the rate of error change, adding damping to reduce overshooting and minimize oscillation. Since the proposed depth-control system is implemented on a digital microcontroller, the continuous PID formulation must be discretized into a digital form that can be executed at fixed sampling intervals [20]. The digital PID controller used in this study is expressed as
$u(k)=K_p r(k)+K_i \sum_{j=0}^{k-1} r(j)+K_d(r(k)-r(k-1))$ (4)
where, u(k) is the control output at the k-th sampling instant, e(k) is the depth error, and k represents the discrete-time sampling index. The PID algorithm is implemented on a Teensy 4.1 microcontroller with a control interval of 10 ms, corresponding to a control frequency of 100 Hz. At each control cycle, the microcontroller acquires the depth measurement from the MS5837-30BA pressure sensor through the I²C interface, calculates the depth error relative to the desired setpoint, and computes the PID control output. The resulting control signal is converted into PWM commands and transmitted to the ESCs to regulate the three vertical thrusters. The control loop is continuously repeated every 10 ms to provide real-time depth feedback and actuator correction. The control sequence consists of depth measurement acquisition, depth-error calculation, PID computation, PWM command generation, thruster actuation, and feedback measurement in the subsequent control cycle.
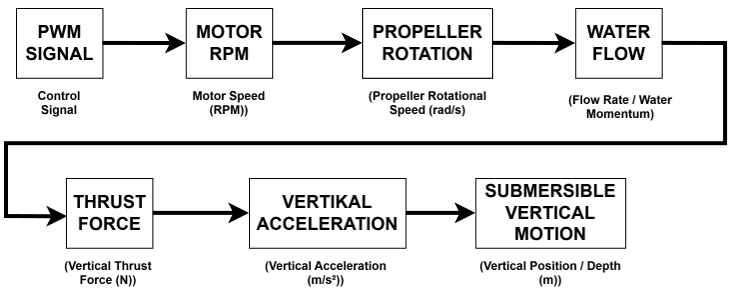
In the submersible vehicle control system, the parameter controlled by the PID algorithm is the PWM value on the thrusters. The PWM value functions as a control signal to regulate the rotation speed of the BLDC motor connected to the thruster propeller. When the PWM value increases, the ESC increases the voltage and motor rotation speed so that the motor RPM becomes higher. This RPM increase causes the propeller to rotate faster and generate greater water flow around the thruster, which then becomes thrust force acting on the vehicle body [12].
Based on the autonomous underwater helicopter research [8], the thrust force generated by the thruster is directly proportional to the square of the motor rotation speed, so changes in PWM value directly affect the magnitude of thrust force produced by the thruster. This relationship can be expressed through the equation:
$F_T=C_T \Omega^2$ (5)
where, $F_T$ is the thrust force, $C_T$ is the thrust coefficient, and Ω² is the motor rotation speed. Vertical movement of the vehicle occurs due to the action-reaction principle based on Newton's Third Law, expressed as:
$F_{{action}}=-F_{{reaction}}$ (6)
When the vertical thruster propeller pushes water downward, the vehicle is propelled upward so the AUV moves toward the surface. Conversely, when the motor rotation direction is reversed so that water flow moves upward, the vehicle receives downward thrust and dives deeper. Therefore, the direction of propeller rotation determines the direction of vertical movement on the z-axis (heave axis), as detailed in the diagram block in Figure 9.
Figure 9. Thruster workflow as a vehicle driver
2.5 Main system flowchart
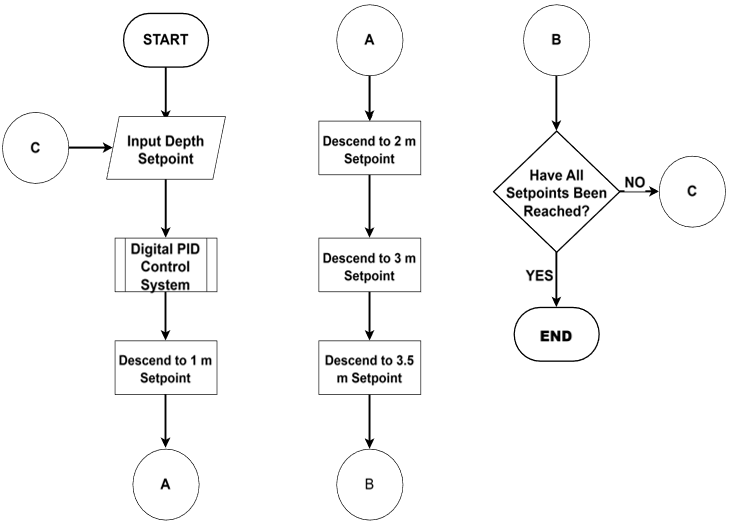
The software architecture defines the workflow of the submersible depth control system, encompassing setpoint input, sensor data acquisition, control processing, and thruster actuation. The system operation is illustrated through flowcharts to provide a clear representation of the depth control mechanisms.
The proposed system operates through a predefined sequence of depth setpoints for evaluating sequential depth regulation. After receiving the target depth sequence, the digital PID controller regulates the vertical thrusters using depth measurements obtained from the pressure sensor. As illustrated in Figure 10, the submersible sequentially moves to depths of 1 m, 2 m, 3 m, and 3.5 m while maintaining stable positioning at each depth before proceeding to the next setpoint. Once all predefined depth levels have been reached, the system terminates the mission and commands the vehicle to return to the surface.
Figure 10. Main system flowchart
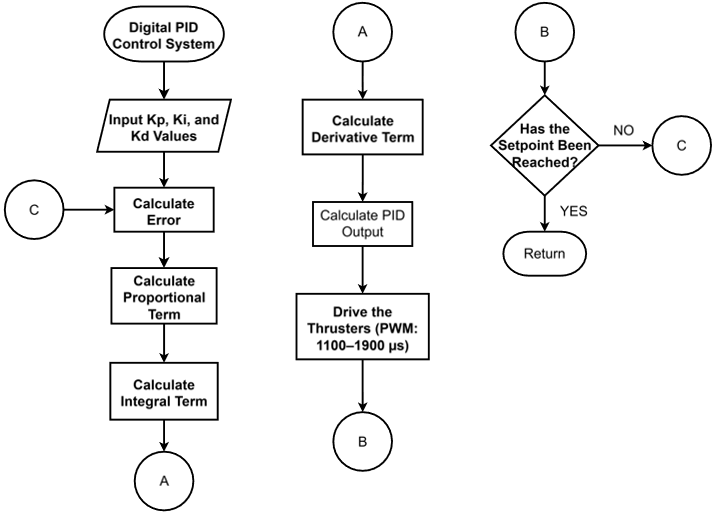
Figure 11 presents the workflow of the PID-based depth control subsystem. The algorithm receives the controller parameters (Kp, Ki, and Kd), calculates the depth error, and evaluates the proportional, integral, and derivative components to generate the control output. This output is converted into PWM commands within the range of 1100–1900 μs to regulate the thrust magnitude and direction, enabling the vehicle to track the desired depth accurately.
Figure 11. PID control system flowchart
Figure 12. Closed-loop PID control block diagram
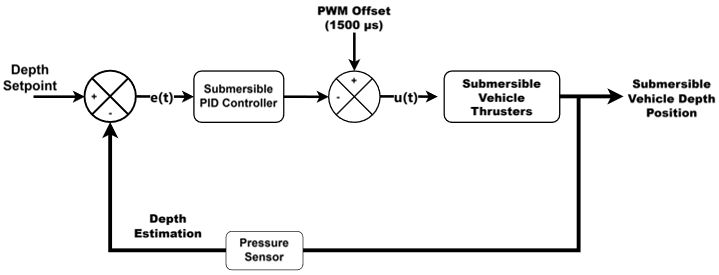
The developed PID controller adopts a closed-loop architecture, as illustrated in Figure 12. The control process begins by comparing the desired depth (setpoint) with the measured depth obtained from the pressure sensor, producing an error signal e(t). This error is processed by the PID controller through proportional, integral, and derivative actions to generate the control output u(t), which represents the corrective action required to minimize the depth deviation. A positive error indicates that the vehicle is shallower than the target depth and must descend, whereas a negative error indicates that the vehicle is deeper than the desired position and must ascend. The controller’s output is converted into a PWM command.
$P W M=o f f s e t P W M+u(t)$ (7)
where, offsetPWM = 1500 µs represents the neutral PWM value of the ESC. Positive values of u(t) increase the PWM signal above the neutral point, while negative values decrease it below the neutral point, thereby generating thrust in opposite directions. The resulting PWM signal is transmitted to the ESCs to regulate the rotational speed of the three vertical thrusters. Through continuous feedback and thrust adjustment, the controller drives the vehicle toward the target depth and maintains stable positioning as the depth error approaches zero.
3.1 Experimental conditions
The experiments were conducted in a controlled swimming pool environment at the SARAGA ITB Diving Pool, Bandung, West Java, Indonesia. The pool has a maximum depth of 4.6 m and was used to evaluate the depth-control performance of the proposed submersible vehicle. The experimental conditions were maintained as consistently as possible for all tests. Before each depth-control experiment, the vehicle was initially positioned at the water surface according to the test procedure. The selected depth setpoints were 1 m, 2 m, 3 m, and 3.5 m. The full-mission experiment consisted of sequential transitions between these depth setpoints. The main experimental conditions are summarized in Table 3.
Table 3. Experimental conditions
|
Parameter |
Experimental Condition |
|
Pool dimensions |
15 m × 15 m |
|
Maximum pool depth |
4.6 m |
|
Control test depths |
1, 2, 3, and 3.5 m |
|
Water condition |
Small surface waves |
|
Water temperature |
Approximately 28.5 ℃ |
|
Initial vehicle position |
Water surface |
3.2 Buoyancy calibration results
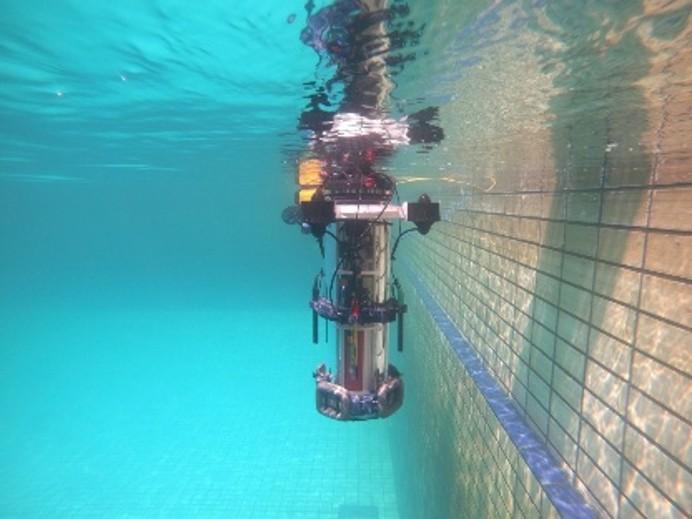
Buoyancy calibration was performed by directly adjusting the vehicle mass in the pool. The initial mass of the submersible was 7.2 kg, equivalent to a gravitational force of approximately 70.6 N. Test results showed that the vehicle still experienced positive buoyancy, meaning the buoyancy force was greater than the gravitational force, causing the vehicle to tend to float on the surface. This indicates that the net force on the vehicle was still directed upward.
Figure 13. Buoyancy calibration result of the submersible
To achieve neutral buoyancy, ballast weights were added gradually through several tests. In the final configuration, 4.25 kg of ballast was added, bringing the total vehicle mass to 11.45 kg, equivalent to a gravitational force of approximately 112.21 N, as shown in Figure 13.
The test results showed that after adding the ballast, the vehicle achieved neutral buoyancy with a slight tendency toward positive buoyancy. This condition was considered optimal because the vehicle slowly ascends when the thrusters are not operating, which facilitates depth control during testing. In addition, the pressure sensor remains submerged even when the vehicle is near the surface, resulting in more stable and consistent water pressure readings. The final buoyancy calibration result is shown in Figure 14.
Figure 14. Buoyancy results of the submersible
3.3 Pressure sensor calibration results
Depth estimation was obtained from the MS5837-30BA pressure sensor based on the hydrostatic pressure principle, where water depth is proportional to the pressure difference between the measured pressure and atmospheric pressure. The depth was calculated using the equation:
$P_{{water}}=\rho \cdot g \cdot h_{{water}}$ (8)
$h_{{water}}=\frac{P_{{water}}}{\rho \cdot g}$ (9)
$h_{{water}}=\frac{P_{{sensor}}-P_{{atm}}}{\rho \cdot g}$ (10)
where, the variables are defined as follows:
$h_{{water}}$ = water depth (meter/cm)
$P_{{water}}$ = water pressure (mbar)
$P_{{sensor}}$ = pressure measured by the sensor in water (mbar)
$P_{{atm}}$ = atmospheric pressure obtained from the sensor logger application (mbar)
$\rho$ = freshwater density (1000 kg/m³)
$g$ = gravitational acceleration (9.81 m/s²)
The atmospheric pressure value was obtained from a smartphone barometric sensor and recorded as 935.325 mbar during the experiment.
Based on Table 4, the raw pressure-sensor measurements showed deviations from the reference depths, with an average error of 7.29%. Therefore, a calibration procedure was applied to improve the accuracy of the depth measurements.
Table 4. Pressure sensor test results before calibration
|
No. |
Sensor Pressure (cm) |
Reference Depth (cm) |
Error (cm) |
Error (%) |
|
1 |
42.75 |
52 |
9.25 |
17.79 |
|
2 |
101.80 |
108 |
6.20 |
5.74 |
|
3 |
142.14 |
153 |
10.86 |
7.10 |
|
4 |
203.75 |
220 |
16.25 |
7.39 |
|
5 |
247.64 |
266 |
18.36 |
6.90 |
|
6 |
305.10 |
327 |
21.90 |
6.78 |
|
7 |
364.91 |
386 |
21.09 |
5.46 |
|
Average Error |
7.29 |
|
|
|
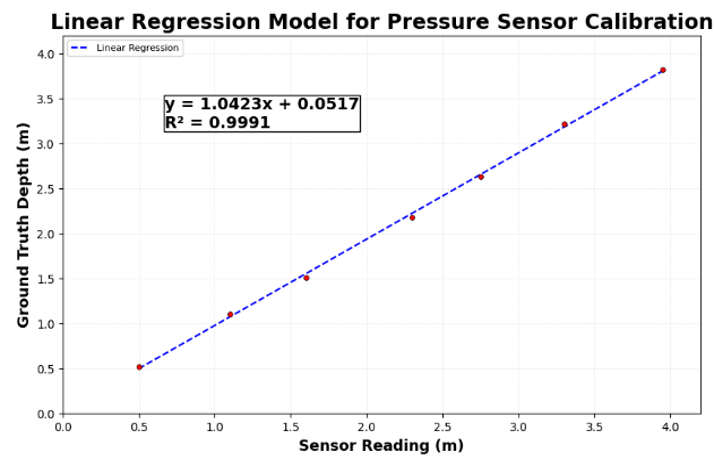
Figure 15. Linear regression model for pressure sensor calibration
A linear regression analysis was performed by comparing the raw sensor measurements with the corresponding ground-truth depth values, as shown in Figure 15. The resulting calibration equation is expressed as:
$y=1.0423 x+0.0517$ (11)
where, x represents the raw depth measurement obtained from the sensor and y represents the reference depth value. The regression model achieved a coefficient of determination (R²) of 0.9991, indicating an excellent linear relationship between the sensor measurements and the reference values.
The corrected measurements are presented in Table 5. When evaluated using a separate post-calibration dataset, the average measurement error decreased to 2.22%. The calibrated depth values were subsequently used as feedback for the PID-based depth-control system.
Table 5. Corrected pressure sensor measurements after calibration
|
No. |
Measured Depth by Sensor Pressure (cm) |
Ground Truth Depth (cm) |
Error (cm) |
Error (%) |
|
1 |
38.82 |
36 |
2.82 |
7.83 |
|
2 |
101.98 |
101 |
0.98 |
1.1 |
|
3 |
160.21 |
162 |
1.79 |
1.06 |
|
4 |
209.76 |
212 |
2.24 |
1.06 |
|
5 |
303.52 |
304 |
0.48 |
0.16 |
|
Average Error |
2.22 |
|
|
The calibration process reduced the average measurement error from 7.29% to 2.22%, based on a separate set of post-calibration measurements that was not used to determine the regression coefficients. This result indicates that the linear regression model improved the agreement between the MS5837-30BA pressure sensor measurements and the reference depth values when evaluated using separate measurements. Therefore, the regression equation obtained from the calibration dataset was integrated into the depth measurement system to provide more reliable depth feedback for the PID-based depth controller.
3.4 Proportional-integral-derivative parameter tuning results
The PID parameters were determined through a sequential experimental tuning procedure consisting of proportional (P), proportional-integral (PI), and PID stages. All configurations were tested at a fixed depth setpoint of 2 m to provide consistent operating conditions. The controller performance was evaluated using SSE settling time, overshoot, and response stability, with SSE prioritized because accurate depth holding was the primary control objective.
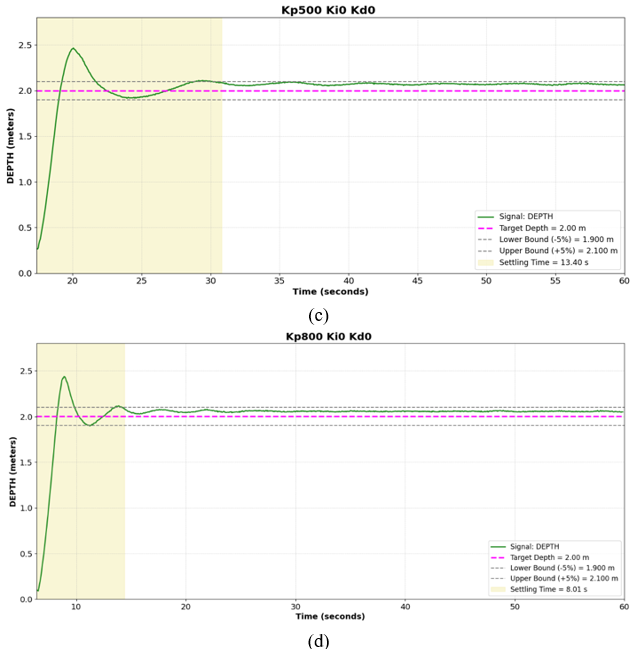
The proportional gain, Kp, initially varied between 200, 350, 500, and 800 while Ki and Kd were set at zero. The results were used to select suitable Kp candidates for the subsequent PI stage. The integral gain was then introduced to reduce the remaining SSE, followed by the derivative gain to improve transient damping and response stability.
Table 6. Control system with proportional gain (Kp)
|
Kp |
Ki |
Kd |
Setpoint (meter) |
Average SSE (cm) |
Settling Time (seconds) |
|
200 |
0 |
0 |
2 |
8.18 |
9.6 |
|
350 |
0 |
0 |
2 |
10.97 |
13 |
|
500 |
0 |
0 |
2 |
7.11 |
13.4 |
|
800 |
0 |
0 |
2 |
5.59 |
8.01 |
Table 7. Control system with proportional-integral (PI) gain (Kp, Ki) variation
|
Kp |
Ki |
Kd |
Setpoint (meter) |
Average SSE (cm) |
Settling Time (seconds) |
|
500 |
15 |
0 |
2 |
2.40 |
12.45 |
|
800 |
15 |
0 |
2 |
2.93 |
8.61 |
|
500 |
30 |
0 |
2 |
1.28 |
17.4 |
|
800 |
30 |
0 |
2 |
2.04 |
14.2 |
Table 8. Control system with PID gains (Kp, Ki, Kd)
|
Kp |
Ki |
Kd |
Setpoint (meter) |
Average SSE (cm) |
Settling Time (seconds) |
|
500 |
15 |
5 |
2 |
0.27 |
14 |
|
800 |
15 |
5 |
2 |
1.60 |
8.3 |
|
500 |
30 |
5 |
2 |
0.48 |
14.2 |
|
800 |
30 |
5 |
2 |
1.29 |
10.25 |
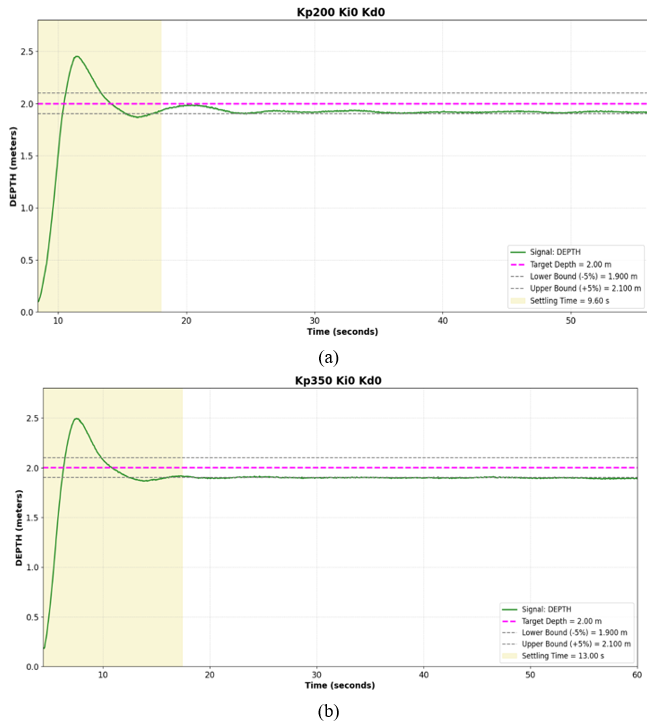
Based on the depth response curves shown in Figure 16, all tested Kp values successfully drove the vehicle toward the 2 m setpoint, with oscillations occurring before reaching steady-state conditions. However, proportional control alone was unable to eliminate the SSE because no integral action was applied. Increasing Kp generally reduced the time required to approach the target depth, although the system dynamics were also influenced by overshoot and oscillatory behavior.
The results summarized in Table 6 show that the tested proportional gains produced different trade-offs between steady-state accuracy and settling time. Among the tested configurations, Kp = 500 provided a relatively low SSE, whereas Kp = 800 produced the fastest settling response. Although increasing Kp generally improved the response speed, the relationship was not strictly proportional because the vehicle dynamics were affected by transient overshoot and oscillations.
Based on the overall response characteristics, Kp = 500 and Kp = 800 were selected as candidates for the subsequent PI tuning stage. The selection of these two gains allowed the effect of additional integral action to be evaluated using configurations with different proportional-response characteristics. The Kp = 500 configuration was retained because of its relatively low SSE, whereas Kp = 800 was retained because it provided the fastest settling response among the tested proportional gains.
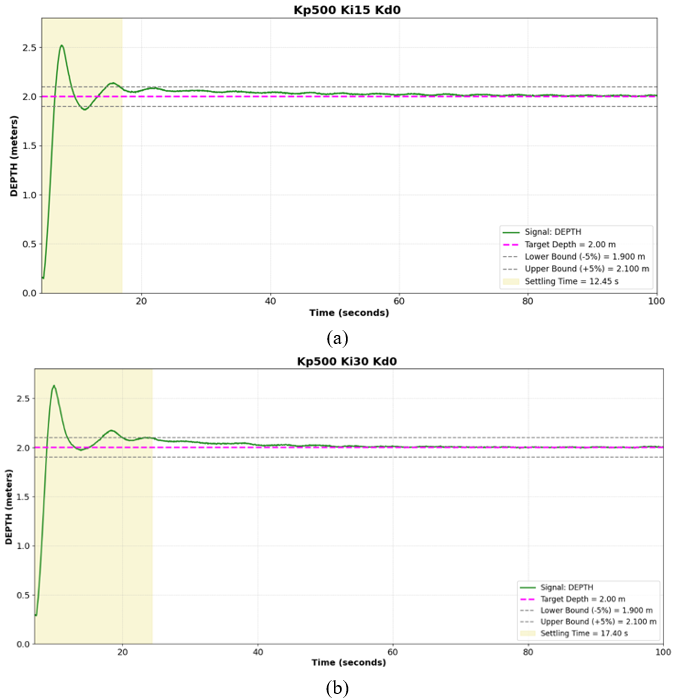
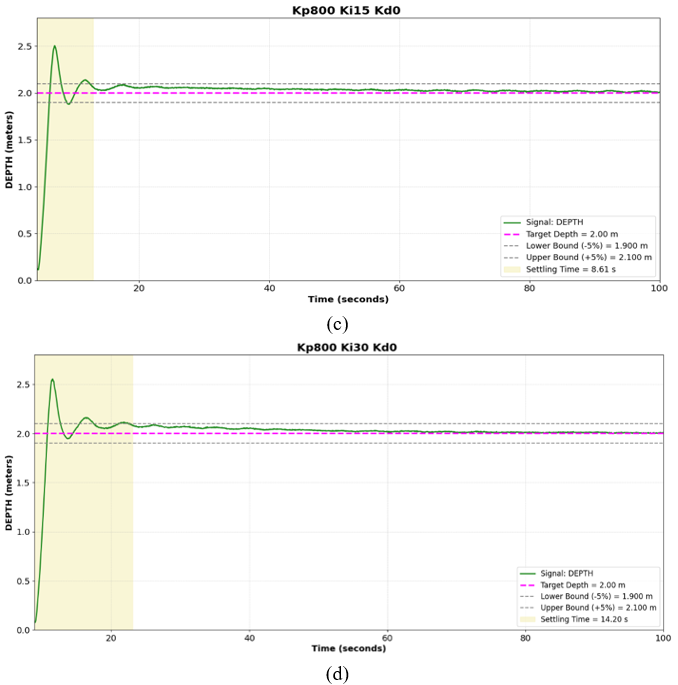
Based on the depth responses shown in Figure 17, the addition of the integral component significantly improved depth regulation performance compared with proportional control alone. For all tested parameter combinations, the vehicle successfully reached the 2 m setpoint and exhibited considerably smaller SSE, indicating that the integral action effectively compensated for the residual error observed in the proportional-only controller. However, an initial overshoot followed by oscillatory behavior was still observed before the system reached steady-state conditions.
Transient performance also varied with the integral gain. Increasing Ki from 15 to 30 generally increased the settling time, indicating that excessive integral action could prolong the stabilization process. Therefore, the PI responses demonstrate a trade-off between steady-state accuracy and transient response, where a higher integral gain can reduce the residual error but may increase the settling time.
The results in Table 7 are consistent with the responses shown in Figure 17. The addition of integral action reduced the SSE compared with proportional control alone by compensating for residual errors. However, the different PI configurations exhibited a trade-off between steady-state accuracy and transient response, as higher integral action could prolong the stabilization process. Kp = 500, Ki = 30 configuration provided the lowest SSE, whereas Kp = 800, Ki = 15 produced the fastest settling response. These PI configurations were subsequently evaluated with derivative action.
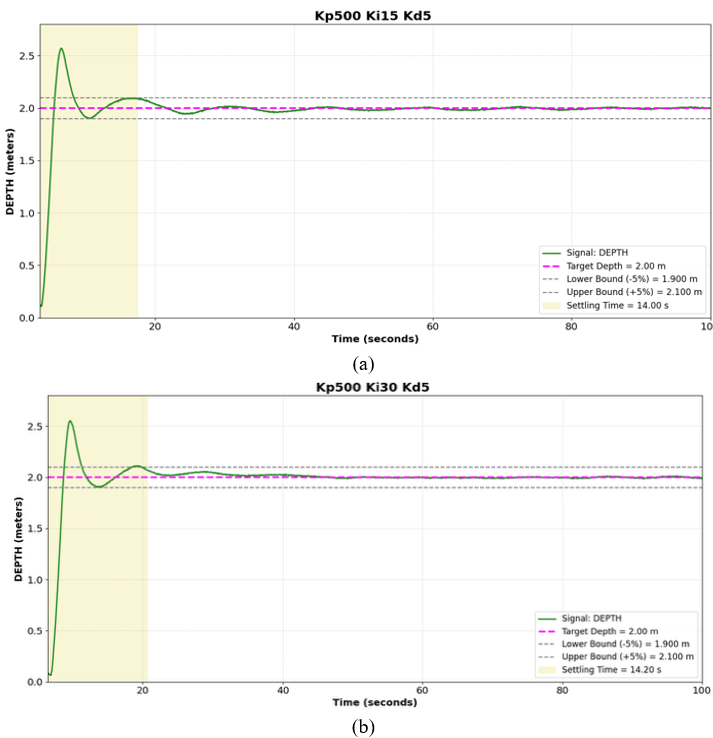
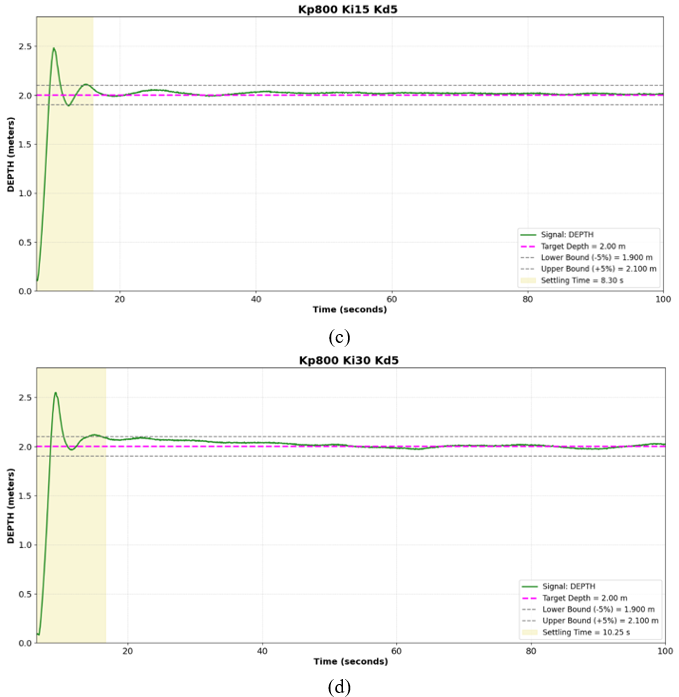
A derivative gain of Kd = 5 was added to the four PI configurations to investigate its effect on transient damping and response stability. As shown in Figure 18, all tested PID configurations reached the 2 m setpoint and maintained stable depth after the transient phase. The derivative action reduced oscillatory behavior and improved the damping of the response, resulting in smoother convergence toward steady-state conditions.
The performance results are summarized in Table 8. Compared with the PI configurations, the addition of derivative action improved the overall response by reducing the SSE and enhancing transient stability. The different PID configurations still exhibited trade-offs between steady-state accuracy and settling time; therefore, the final controller parameters were selected based on the overall response characteristics rather than a single performance metric.
The derivative action also improved the transient response characteristics. The measured settling times ranged from 8.30 s to 14.20 s, demonstrating that the controller was able to achieve stable operation within a relatively short period. Compared with the PI controller, the addition of the derivative term reduced oscillatory behavior during the transient phase and improved overall system damping, resulting in smoother depth regulation.
Among the tested PID configurations, Kp = 500, Ki = 15, and Kd = 5 achieved the lowest SSE of 0.27 cm while maintaining an acceptable settling time of 14 s. Although the Kp = 800, Ki = 15, Kd = 5 configuration produced a shorter settling time of 8.30 s, its SSE was higher at 1.60 cm. Therefore, Kp = 500, Ki = 15, and Kd = 5 were selected as the final controller parameters because they provided the most favorable balance between steady-state accuracy and transient response among the tested configurations. These parameters were subsequently fixed for the depth-variation and full-mission experiments.
During the PID tuning process, most parameter configurations were evaluated in a single experimental run. The purpose of this stage was to compare the control response of different parameter combinations and identify a suitable controller configuration rather than to statistically characterize the performance of each configuration. Therefore, the values reported in Tables 6–8 represent the measured response obtained for each tested configuration. The selected PID parameters were subsequently evaluated through depth-variation and full-mission experiments to assess their performance under different operating conditions.
The repeated measurements generally exhibited similar response characteristics under the same tuning condition. Because the number of repetitions was not consistent across all configurations, the tuning results are presented as measured performance values rather than as a statistically balanced comparison. Where repeated measurements were available, their consistency was used as an additional qualitative indication of repeatability. No standard deviation or confidence interval was calculated for configurations with insufficient repeated measurements. The SSE reported in the experimental results represents the average steady-state depth error calculated from the measurement samples within the steady-state interval of each test. It should therefore not be interpreted as an average across repeated experimental runs.
3.5 Final proportional-integral-derivative parameter value testing
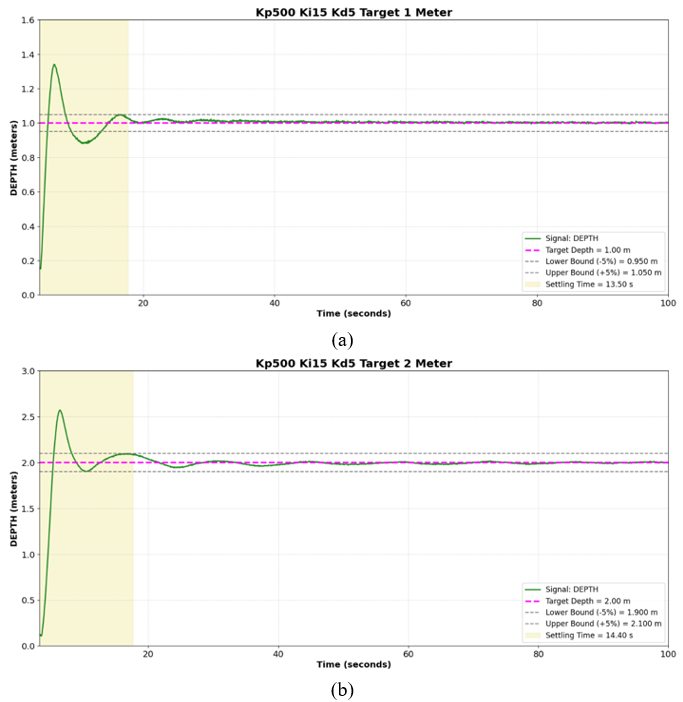
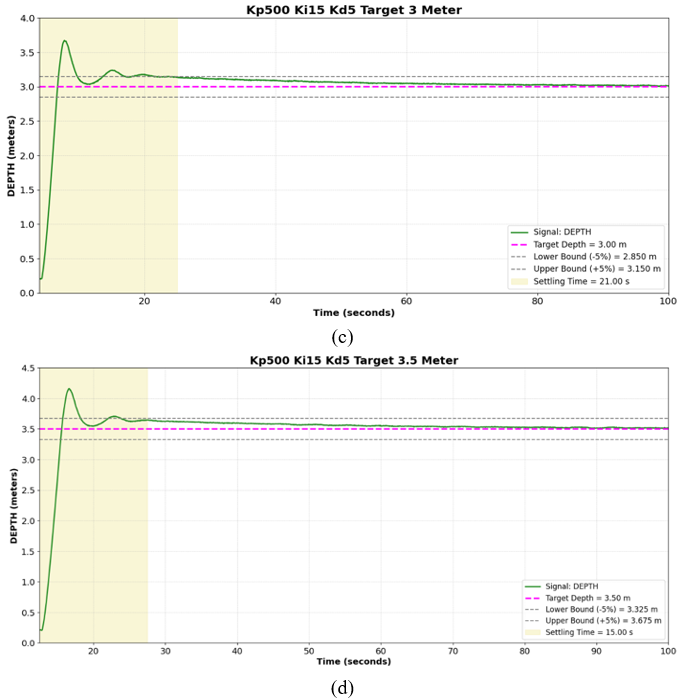
After the PID tuning process, the selected controller parameters of Kp = 500, Ki = 15, and Kd = 5 were fixed and evaluated at different depth setpoints. The controller was tested at 1 m, 2 m, 3 m, and 3.5 m without retuning to evaluate whether the parameters selected at the 2 m tuning condition could maintain stable depth regulation across the tested operating range. SSE and settling time were used to assess the consistency of the controller performance.
Overall, the results presented in Figure 19 demonstrate that the PID controller with these parameters successfully maintained stable depth control at setpoints of 1 m, 2 m, 3 m, and 3.5 m. In all experiments, the submersible reached the desired depth after experiencing an initial overshoot and transient oscillations, followed by stable steady-state behavior. As the depth setpoint increased, larger overshoots and slightly longer settling times were observed due to the greater thrust required to overcome increased hydrostatic pressure and hydrodynamic resistance. Nevertheless, once the system reached the settling region, depth fluctuations remained small across all tested setpoints. These results indicate that the selected PID parameters maintained stable depth regulation across the tested depth setpoints without requiring retuning, although the control performance varied with operating depth.
Importantly, the PID parameters were not retuned between the tested depth setpoints. The increase in SSE at 3 m and 3.5 m indicates that the controller performance was affected by the operating depth; however, the vehicle remained within the predefined depth tolerance at all tested setpoints. Therefore, the selected parameters could be applied across the tested depth range without parameter adjustment, although identical control performance was not obtained at every depth.
Based on the results summarized in Table 9, all measured SSE values remained well below the predefined ±20 cm tolerance limit, indicating that the selected PID parameters maintained the vehicle close to the target depth across all tested setpoints. Although the control performance varied with operating depth, the results demonstrate satisfactory depth-control accuracy. The settling-time results indicate that the system reached steady-state conditions within a practical period after each depth transition and provide a reference for determining the required waiting time before measurements are performed at the target depth.
Table 9. Control system performance at various depth setpoints using final Proportional-Integral-Derivative (PID) parameters
|
Kp |
Ki |
Kd |
Setpoint (meter) |
Average SSE (cm) |
Settling Time (seconds) |
|
500 |
15 |
5 |
1 |
0,50 |
13,5 |
|
500 |
15 |
5 |
2 |
0,27 |
14,4 |
|
500 |
15 |
5 |
3 |
4.25 |
21 |
|
500 |
15 |
5 |
3.5 |
4,51 |
15 |
|
Average Settling Time |
15,975 |
|
|
|
|
Overall, the experimental results indicate that the PID controller with Kp = 500, Ki = 15, and Kd = 5 maintained stable depth regulation across the tested depth setpoints without requiring retuning. Although the control performance varied with operating depth, all tested setpoints remained within the predefined ±20 cm depth tolerance. Therefore, within the tested pool conditions and depth range, the selected PID parameters were able to regulate the vehicle depth at multiple setpoints.
3.6 Final mission test of the submersible proportional-integral-derivative control system
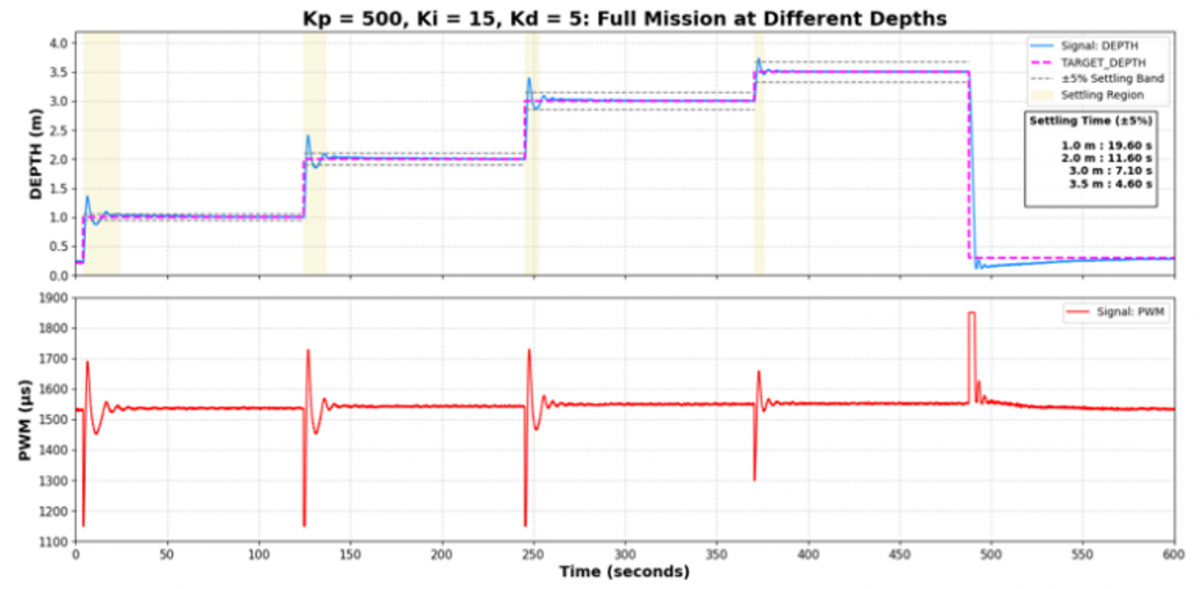
As a final evaluation stage, a full-mission experiment was conducted to assess the performance of the selected PID controller during sequential depth transitions. The submersible moved from the water surface to setpoints of 1 m, 2 m, 3 m, and 3.5 m before returning to the surface, while maintaining its position for approximately 2 min at each depth. The experiment evaluated the controller's ability to perform sequential transitions, maintain stable depth at each setpoint, and sustain consistent performance throughout the mission. Settling time was also recorded to characterize the time required to reach steady-state conditions after each transition.
Figure 20. Full mission depth response and PWM signal at sequential setpoints (1 m, 2 m, 3 m, 3.5 m)
Based on the full-mission response shown in Figure 20, the PID controller with that parameter successfully guided the submersible through sequential depth transitions from 1 m to 3.5 m and back to the surface. Several full-mission trials were conducted using the same PID parameters, and the trial showing representative overall depth-control performance was selected for presentation. At each transition, the system exhibited a transient response followed by overshoot and damped oscillations before reaching steady-state conditions. Despite the successive changes in setpoint, the controller maintained stable depth tracking without significant instability.
The settling behavior varied across the successive transitions, as summarized in Table 10. The decreasing settling time during later transitions suggests that the response was influenced by the transition conditions and the depth increment between consecutive setpoints. The PWM response followed the corresponding depth transitions: the control output increased to generate the required thrust and decreased as the vehicle approached the desired depth, requiring only small corrective actions during steady-state operation.
The results summarized in Table 10 show that all SSE values remained well within the predefined ±20 cm tolerance, indicating that the selected PID controller maintained the desired depth throughout the sequential mission. Compared with the single-setpoint experiments, the selected full-mission trial produced lower SSE values, particularly at the deeper setpoints, demonstrating that stable depth regulation was maintained during successive setpoint transitions. The settling-time results also indicate that the system reached stable operating conditions after each transition and provide a practical reference for determining the waiting period before initiating measurements at the target depth.
Table 10. Control system performance during full mission test at sequential depth setpoints
|
Kp |
Ki |
Kd |
Setpoint (meter) |
Average SSE (cm) |
Settling Time (seconds) |
|
500 |
15 |
5 |
1 |
1,21 |
19,6 |
|
500 |
15 |
5 |
2 |
0,93 |
11,6 |
|
500 |
15 |
5 |
3 |
0,86 |
7,10 |
|
500 |
15 |
5 |
3.5 |
0,26 |
4,6 |
|
Average Settling Time |
10,725 |
|
|
|
|
The full-mission results demonstrate that the integration of calibrated pressure feedback and closed-loop PID control enabled stable depth tracking across the tested operating range under controlled pool conditions. The variation in control performance among the setpoints may be associated with vehicle dynamics, including buoyancy, hydrodynamic resistance, inertia, and actuator behavior. Near-surface operation may also be more sensitive to disturbances and actuator dead-zone effects when relatively small corrective thrust is required.
From an engineering perspective, the three-thruster configuration provided sufficient vertical force distribution for controlled ascent, descent, and depth holding. Combined with calibrated pressure feedback, this configuration offers a practical platform for collecting water-quality measurements at predefined depth layers. Nevertheless, the fixed PID parameters were optimized under controlled pool conditions and may not provide the same performance in the presence of currents, waves, battery-voltage variation, or prolonged sensor drift. The present system is also limited to vertical regulation and does not actively compensate for horizontal displacement. Future work should therefore evaluate long-duration operation in natural water bodies and investigate multi-axis, adaptive, or disturbance-aware control strategies.
This study successfully designed and implemented a three-thruster submersible vehicle for automatic depth regulation under controlled pool conditions. The vehicle used a watertight 6-inch acrylic enclosure that protected its electronic components and operated without leakage at depths of up to 4 m. Linear-regression calibration of the MS5837-30BA pressure sensor reduced the average measurement error from 7.29% to 2.22%, with R2 = 0.9991, confirming its suitability for depth-feedback control within the tested range. Iterative PID tuning produced optimal parameters of Kp = 500, Ki = 15, and Kd = 5, which maintained SSE within the predefined ±20 cm tolerance at setpoints of 1, 2, 3, and 3.5 m without requiring retuning. During the full-mission experiment, the controller successfully executed sequential depth transitions with SSE ranging from 0.26 to 1.21 cm and an average settling time of 10.73 s; these transitions also produced more stable responses than direct descents from the surface. Overall, the integration of the watertight mechanical structure, calibrated pressure sensor, and PID controller demonstrated the feasibility of the proposed architecture for stable multilevel depth regulation within the tested operating range. However, because the experiments were limited to controlled pool conditions, future work should include field testing in natural water environments and the implementation of adaptive or robust control methods to improve resistance to currents, turbulence, and other environmental disturbances before deployment for autonomous reservoir monitoring.
This work was supported by the Riset dan Inovasi untuk Indonesia Maju (RIIM) Kompetisi program, funded by the Indonesia Endowment Fund for Education (LPDP), the Ministry of Finance of the Republic of Indonesia, and the National Research and Innovation Agency (BRIN), under Grant No. 101/IV/KS/04/2026 and Grant No. 064/SAM4/PPM/2026.
[1] Akbar, S.A., Kalbuadi, D.B., Yudhana, A. (2019). Online monitoring kualitas air waduk berbasis ThingSpeak. Transmisi Jurnal Teknik Elektro, 21(4): 109-115. https://doi.org/10.14710/transmisi.21.4.109-115
[2] Chang, F., Hou, P., Wen, X., Duan, L., Zhang, Y., Zhang, H. (2022). Seasonal stratification characteristics of vertical profiles and water quality of Lake Lugu in Southwest China. Water, 14(16): 2554. https://doi.org/10.3390/w14162554
[3] Arinda, A., Wardhani, E. (2018). Analisis profil konsentrasi Pb di air Waduk Saguling. Rekayasa Hijau: Jurnal Teknologi Ramah Lingkungan, 3(2): 213-219. https://doi.org/10.26760/jrh.v2i3.2509
[4] Song, K., Xenopoulos, M.A., Buttle, J.M., et al. (2013). Thermal stratification patterns in urban ponds and their relationships with vertical nutrient gradients. Journal of Environmental Management, 127: 317-323. https://doi.org/10.1016/j.jenvman.2013.05.052
[5] Gu, R., Stefan, H.G. (1995). Stratification dynamics in wastewater stabilization ponds. Water Research, 29(8): 1909-1923. https://doi.org/10.1016/0043-1354(95)00011-9
[6] Madrid, Y., Zayas, Z.P. (2007). Water sampling: Traditional methods and new approaches in water sampling strategy. TrAC Trends in Analytical Chemistry, 26(4): 293-299. https://doi.org/10.1016/j.trac.2007.01.002
[7] Boy, S., Putra, A. (2023). Inovasi submersible pump sebagai water sampler untuk penunjang praktikum di manajemen sumber daya perairan. Indonesian Journal of Laboratory, 1: 78. https://doi.org/10.22146/ijl.v1i2.85138
[8] Obembe, E., Ali, B. (2025). Evaluating the applications and the growing importance of autonomous underwater vehicles (AUVs) in marine geophysical survey. Journal of Science Innovation and Technology Research, 7(9): 307-329. https://doi.org/10.70382/ajsitr.v7i9.032
[9] Zhou, J., Si, Y., Chen, Y. (2023). A review of subsea AUV technology. Journal of Marine Science and Engineering, 11(6): 1119. https://doi.org/10.3390/jmse11061119
[10] Capocci, R., Dooly, G., Omerdić, E., Coleman, J., Newe, T., Toal, D. (2017). Inspection-class remotely operated vehicles—A review. Journal of Marine Science and Engineering, 5(1): 13. https://doi.org/10.3390/jmse5010013
[11] Liu, Z., Zhou, J., Wang, Z., et al. (2022). Research on an autonomous underwater helicopter with less thrusters. Journal of Marine Science and Engineering, 10(10): 1444. https://doi.org/10.3390/jmse10101444
[12] Das, S., Gouda, G., Das, A. (2019). An experimental research on design and development of tricopter. International Journal of Recent Technology and Engineering, 8(3): 5119-5123. https://doi.org/10.35940/ijrte.C5728.098319
[13] González-García, J., Gómez-Espinosa, A., García-Valdovinos, L.G., Salgado-Jiménez, T., Cuan-Urquizo, E., Escobedo Cabello, J.A. (2022). Model-free high-order sliding mode controller for station-keeping of an autonomous underwater vehicle in manipulation task: Simulations and experimental validation. Sensors, 22(12): 4347. https://doi.org/10.3390/s22124347
[14] Ukoima, K., Ezeonye, C., Abara, I., Chikere, N. (2020). A study of the effects of proportional, integral and derivative controller in the speed regulation of an armature controlled direct current motor. Journal of Control System and Control Instrumentation, 6(1): 5-10. https://doi.org/10.5281/zenodo.3748749
[15] Subarta, B., Eteruddin, H., Setiawan, D. (2024). Analisis perbandingan sistem kendali PID dan sistem kendali fuzzy PID pada pengontrolan kecepatan motor DC. TELKA-Telekomunikasi, Elektronika, Komputasi dan Kontrol, 10(2): 178-192. https://doi.org/10.15575/telka.v10n2.178-192
[16] Ridwan, M. (2019). Perbandingan sistem kendali pid dan kendali LQR pada sistem suspensi aktif bus (1/4) menggunakan simulasi matlab. Jurnal Sains dan Ilmu Terapan, 2(2): 11-16. https://doi.org/10.59061/jsit.v2i2.128
[17] Diono, D., Pratama, Y.R., Kitton, B.K.S. (2025). Perbandingan metode PID dan fuzzy logic control dalam sinkronisasi dua motor DC. Jurnal Integrasi, 17(2): 97-108. https://doi.org/10.30871/ji.v17i2.11036
[18] Zulfa, S.I., Nikmah, A., Nisak, E.K. (2020). Analisa penguasaan konsep pada tekanan hidrostatis dan Hukum Pascal mahasiswa pendidikan fisika. Jurnal Fisika Indonesia, 24(1): 24.
[19] Li, S., Du, X., Zhang, L., Chen, K., Wang, S. (2020). Study on dynamic characteristics of underwater pressure compensator considering nonlinearity. Mechanical Sciences, 11(1): 183-192. https://doi.org/10.5194/ms-11-183-2020
[20] Nguyen, D.V., Pham, Y., Vu, H., Zhang, L., Nguyen, T. (2026). Activation steering with a feedback controller. arXiv preprint arXiv:2510.04309. https://doi.org/10.48550/arXiv.2510.04309